
When Bonds Start Competing With Stocks
A few weeks ago, I discussed how higher US Treasury yields can pressure growth stocks by raising borrowing costs and reducing the value investors place on future earnings. This week, I’d like to look at the other side of the equation: bonds are increasingly becoming competition for stocks, while several forces are pushing yields higher.
US Treasury yields continued to climb as investors weighed persistent inflation, a resilient US economy and the government’s growing debt load. Higher oil prices are adding to inflation concerns, while the strength of the economy gives the Fed more room to keep interest rates higher for longer if inflation remains stubborn. At the same time, the Treasury must continue issuing large amounts of debt to finance government spending, increasing the supply of bonds investors must absorb.
The result has been a sharp rise in longer-term yields. The 10-year Treasury yield ended the week at 5.24%, after briefly climbing to 5.34% earlier in the week, its highest level since early 2002. The 30-year yield finished around 5.63%, remaining near levels last seen in 2002. At these levels, bonds become increasingly competitive with stocks. Investors can earn a relatively high return from US government bonds without taking on the day-to-day volatility of equities, making the decision to take on additional stock-market risk less straightforward.
The concern goes beyond the level of yields themselves. Higher oil prices could keep inflation elevated and make it more difficult for the Fed to cut rates, while the need to finance a growing debt load could keep upward pressure on longer-term yields. Together, these forces are raising questions about how long interest rates may remain elevated and what that means for the relative appeal of stocks and bonds.
The 10-year Treasury yield is closing in on 5.5%, a level that could have investors, corporations and consumers redoing the math on their investment and borrowing decisions. At higher yields, bonds become more competitive with stocks, while the cost of financing everything from corporate debt to mortgages can rise. The higher yields go, the harder it becomes for investors to ignore the alternative sitting in the bond market.
With a slew of economic data released this week, let’s see how the latest numbers affected bond yields and the broader markets, and how these forces affected the three portfolios.
Items that may only interest or educate me ….
Canadian Economic news, US Economic news, ….
Canadian Economic news
This past week’s key economic data that the Bank of Canada (BoC) considers when deciding whether to raise or lower the interest rate.
Gross Domestic Product (GDP)
Statistics Canada reported that the Canadian economy was flat in July, snapping three straight months of expansion that included upwardly revised growth of 0.4% in June. On a year-over-year basis, the economy was 1.4% larger than in July 2025.
Both goods-producing and services-producing industries were unchanged during the month. Within goods-producing industries, utilities led the gains, rising 1.7%, while manufacturing posted the largest decline, falling 0.9%. Among services-producing industries, accommodation and food services rose 0.8%, while wholesale trade suffered the largest decline, falling 0.4%.
Looking back over the past year, services-producing industries have held up better, growing 1.8% compared with just 0.6% growth in goods-producing industries. Information and cultural industries led the gains among services, rising 4.4%, while agriculture, forestry, fishing, and hunting remained the weakest area overall, falling 4.7%.
The Canadian economy continues to hold up despite ongoing trade headwinds, but the latest round of US tariffs could put more pressure on growth in the months ahead. With July marking a pause after three months of expansion, the August GDP estimate will provide an early indication of whether the economy is regaining momentum or losing more ground.
Canadian Market Volatility
Canada’s version of the market’s “fear gauge” is the S&P/TSX 60 VIX Index (VIXC). Like the US volatility index (VIX), it measures expected volatility in the Canadian stock market over the next 30 days. Higher readings indicate greater uncertainty, while lower readings point to calmer conditions.
The VIXC opened the week at 14.18, up from the previous week’s close of 13.45, and quickly dropped below 14 where it primarily remained between 13.50 and 14.00 despite Middle East tensions and rising government bond yields. The index fell below 13.50 late at the end the week after the Group of 7 countries agreed to release fuel from their strategic reserves to help lower the cost of diesel and other fuels. The VIXC ultimately closed at 13.12.
Overall, the VIXC remained relatively subdued, suggesting that expectations for near-term volatility in Canadian stocks stayed fairly low. Despite swings in oil prices and bond yields adding some uncertainty, the relatively low VIXC indicated that investors were not expecting a significant increase in stock-market volatility.
Note: The VIXC typically trades at lower levels than the VIX, partly because of the different makeup of the Canadian and US markets. The S&P 500 has a much larger weighting in technology, while the TSX has greater exposure to financials, energy, and materials. Because these sectors respond differently to economic conditions and commodity prices, the two indexes can have different levels of expected volatility.
US Economic news
This past week’s key data points that the Federal Reserve (Fed) considers when deciding whether to raise or lower the interest rate.
Consumer Confidence Index (CCI)
The Conference Board’s CCI dropped noticeably in September to 81.9, compared with a downward revised 88.6 in August. That’s the lowest reading since April 2014, but the comparison comes with an important caveat. When the CCI last reached this level in April 2014, it had fallen just 1.6 points from the previous month as consumers became somewhat less confident about hiring and current business conditions. However, their expectations for the future remained positive, and the index was still near its strongest levels since before the 2008–09 Great Recession. This month’s 6.7-point decline is a much sharper move, with consumers becoming more pessimistic about both current conditions and the outlook for the next six months.
The Present Situation Index, which measures how consumers view current business conditions and employment, fell sharply to 109.3 from a downward revised 117.2. The Expectations Index, which reflects consumers’ outlook for the next six months, also declined to 63.6. A reading below 80 has historically been associated with an increased risk of recession.
The September report shows a significant deterioration in consumer confidence, both currently and six months out. Concerns about higher energy prices and inflation, elevated US Treasury bond yields, the conflict with Iran, and uncertainty surrounding artificial intelligence (AI) are weighing on consumers.
Inflation and Economic Growth
Personal Consumption Expenditures (PCE)
The Commerce Department’s Bureau of Economic Analysis (BEA) reported that the headline PCE price index, the Fed’s preferred inflation measure, rose 0.3% in August, following a revised 0.1% increase in July. The increase was below the 0.4% economists had expected. On an annual basis, the PCE price index rose 3.4%, matching July’s revised pace and coming in well below the 3.7% expected.
The core PCE price index, which excludes the often-volatile food and energy categories, rose 0.2% in August after increasing 0.1% in July. On an annual basis, core PCE rose 3.0%, matching July’s revised pace. The Fed closely watches core PCE for signs of underlying inflation.
Today’s release also incorporated the BEA’s annual update to the National Economic Accounts, including revisions to historical PCE data and changes to the methodology used to calculate the index. As a result, some of the changes in the inflation data reflect updated measurements rather than a sudden shift in underlying inflation.
The latest report provides some relief on inflation, with both headline and core PCE coming in below expectations. However, inflation remains well above the Fed’s 2% target, and both measures increased at a faster monthly pace in August than in July.
Gross Domestic Product (GDP)
The US GDP report was considerably stronger than the previous estimate suggested. The BEA’s third and final estimate for Q2 2026 showed real GDP grew at a 2.2% annualized rate, up from the previous estimate of 1.5%. Analysts had expected the 1.5% figure to remain unchanged.
The upward revision was driven by stronger consumer spending, business investment, and government spending. Business investment included spending associated with the buildout of AI infrastructure. Overall, the BEA said the 0.7 percentage-point revision primarily reflected higher estimates for these three areas.
The earlier 1.5% GDP reading had suggested a fairly sharp slowdown from Q1. Today’s 2.2% result paints a somewhat different picture: the US economy did slow in Q2, but not nearly as much as previously thought.
Analysis
Taken together, the latest data suggest the US economy has remained resilient despite the headwinds from the war in the Middle East and ongoing trade tensions. GDP was stronger than previously estimated and consumer spending remained solid, while inflation was softer than expected but still well above the Fed’s 2% target.
That creates an interesting tension for the Fed. The economy doesn’t appear particularly weak, which could make further rate cuts harder to justify, while the softer PCE readings provide some relief on inflation. For now, the data give the Fed some room to wait and see how growth and inflation develop rather than pointing clearly in either direction.
Labour data
This week’s labour data comes from three key reports: the Job Openings and Labor Turnover Survey (JOLTS), the ADP Employment Report and the Employment Situation Summary (ESS). Each looks at a different part of the US labour market. JOLTS measures job openings, hiring, and worker flows; ADP provides a timely snapshot of private-sector hiring; and the ESS provides the broadest picture, including job creation, unemployment, and wage growth. Together, they provide a more complete view of the labour market. One significant difference is timing: JOLTS covers August, while ADP and the ESS cover September.
Labor Department’s Job Openings and Labor Turnover Survey (JOLTS)
The Labor Department’s latest JOLTS data showed job openings fell to 7.1 million in August, down from July’s upwardly revised 7.3 million and below the 7.2 million analysts had expected.
The latest data points to a labour market that remains in a “low hire, low fire” state, with some cooling in demand but no significant deterioration in employment conditions. Keep in mind that fewer job openings are not the same thing as fewer jobs.
ADP Employment Report
The ADP Employment Report came in above expectations, with US private-sector employers adding 90,000 jobs in September, up sharply from a downwardly revised 36,000 in August. That marked the strongest pace of job creation since May and exceeded analysts’ expectations for roughly 70,000 new jobs.
The gains were led by education and health services, leisure and hospitality, manufacturing, and construction. However, financial activities and professional and business services reported job losses. Wage growth remained relatively steady, with annual pay gains of 3.2%.
The Bureau of Labor Statistics’ Employment Situation Summary (ESS).
The September ESS, better known as the monthly jobs report, painted a much weaker picture. US non-farm payrolls increased by just 29,000, well below expectations and down sharply from August’s revised gain of 133,000. The increase was also a far cry from the job gains that routinely topped 200,000 in the years before the pandemic, let alone the extraordinary gains that followed the economy’s reopening after COVID-19.
The weakness extended to the previous two months, with both July and August employment numbers revised lower. July was revised from a gain of 21,000 jobs to a decline of 10,000, while August was revised from 162,000 to 133,000. Combined, the revisions reduced previously reported employment gains for July and August by 60,000 jobs.
The unemployment rate edged up to 4.2% from 4.1% in August, slightly above expectations that it would remain unchanged. Average hourly earnings rose 0.1% month over month, slowing from August’s pace. On an annual basis, wages increased 3.0% in September, down from 3.1% in August and below the 3.2% increase analysts had expected.
Overall Labour Takeaway
The clearest theme across all three reports is a labour market that is losing momentum but not showing signs of a broad breakdown. Job openings have declined, hiring has slowed and unemployment has edged higher, while downward revisions to July and August show that recent job growth was weaker than initially reported. At the same time, job openings remain elevated and layoffs have not surged, suggesting businesses are becoming more cautious about adding workers rather than broadly cutting existing jobs.
That brings the “low hire, low fire” description into sharper focus. Businesses appear reluctant to expand their workforces, but they also aren’t broadly shedding employees. That can produce a slower-growing labour market without necessarily causing a sharp rise in unemployment. The gap between ADP’s 90,000 private-sector jobs and the ESS’s 29,000 total jobs is also a reminder that the two reports measure different parts of the labour market.
For the Fed, the latest data offer a mixed picture. Slower employment growth, rising unemployment and moderating wage growth suggest labour-market pressures are easing, while the economy remains resilient. But the unemployment rate is still relatively low and inflation remains well above the Fed’s 2% target, keeping price pressures firmly in focus. The labour market is cooling, but the latest data do not point clearly to a broader economic downturn.
American Market Volatility
The VIX, often called the market’s “fear gauge,” measures expected S&P 500 volatility over the next 30 days. Higher readings signal greater uncertainty, while levels above 20 are typically associated with elevated volatility.
The VIX opened the week at 16.16, up from the previous Friday’s close of 14.90 as tensions in the Middle East increased. The fear gauge remained near 16 for most of the week before spiking above 17 following the release of the monthly jobs report, as investors reacted to much weaker-than-expected employment data. The spike was short-lived, however, with the VIX quickly falling back below 16 as oil prices retreated and concerns about inflation eased. By the end of the week, the VIX had closed at 15.31, below where it started.
The VIX remained below 20 throughout the week, indicating that expected volatility in US stocks remained relatively contained. The spike late in the week showed how quickly concerns about oil, inflation and weaker employment data could unsettle markets, but the corresponding retreat in oil prices suggested those concerns had eased by week’s end. Overall, the VIX ended the week only modestly higher than the previous Friday’s close, despite the sharp late week move.
Weekly Market and Portfolio Review
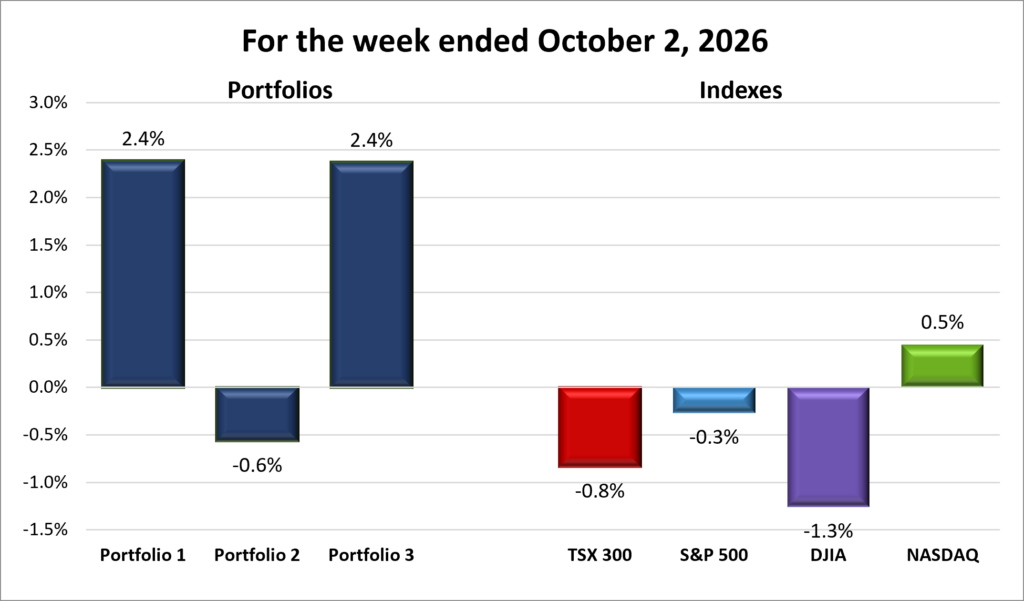
For the week, the TSX (SPTSX) shed 0.8%, the S&P 500 (SPX) slipped 0.3%, the DJIA (INDU) declined 1.3% while the Nasdaq (CCMP) advanced 0.5%.
| Index | Weekly Streak |
| TSX: | 2 – week losing streak |
| S&P: | 1 – week losing streak |
| DJIA: | 1 – week losing streak |
| Nasdaq: | 3 – week winning streak |

 September has a reputation for being the stock market’s worst month, while October is better known for volatility than consistently strong returns. This week offered a little of both. The Toronto Stock Exchange Composite Index (TSX), the S&P 500 Index (S&P), and the Dow Jones Industrial Average (DJIA) all finished lower as rising government bond yields, higher oil prices and renewed inflation concerns put investors on the defensive. A late rally lifted the Nasdaq Composite Index (Nasdaq) into positive territory. October is only getting started, but it is already living up to its reputation for keeping investors on their toes.
The US market spent much of the week caught between two competing forces: an economy that continues to show signs of resilience and growing concern that inflation may remain too high for the Fed to cut interest rates as quickly as investors had hoped. The bond market was at the centre of that tension. The 10-year US Treasury yield ended the week at 5.24, its highest level since early 2002, while the 30-year yield also reached its highest level since mid 2002. Higher yields make bonds more attractive relative to stocks while raising borrowing costs for companies and consumers. Meanwhile, Brent crude moved back above US$100 as uncertainty surrounding the Iran conflict pushed oil prices higher, adding to concerns that higher energy costs could keep inflation elevated.
Economic data added to the uncertainty. August PCE inflation came in slightly below expectations, providing some relief and helping technology stocks recover. At the same time, stronger-than-expected GDP, consumer spending, and private payroll data pointed to an economy that continues to hold up. The monthly jobs report provided a very different signal, with US employers adding just 29,000 jobs in September, well below expectations, while July and August’s gains were revised lower. The report added to evidence that the labour market is losing momentum and strengthened expectations for further Fed rate cuts, although a weakening labour market also raises questions about the strength of the economy itself.
By the end of the week, some of the pressure began to ease. Treasury yields pulled back following the weak jobs report, while the G7’s announcement of a coordinated release of 100 million barrels of oil and fuel products sent crude prices lower. The release was intended to offset supply disruptions caused by the conflict in the Middle East. Technology stocks received another boost from strong results from memory-chip maker Micron Technology (NASDAQ: MU), helping the Nasdaq finish the week in positive territory.
In Canada, the TSX fell 0.8%, despite a strong rebound on Friday that ended a four-day losing streak. Gold and mining stocks were among the biggest drags early in the week, as a sharp drop in the price of gold and higher bond yields weighed on the sector. Banks also came under pressure as Canadian bond yields climbed, while industrial and consumer stocks weakened.
Energy provided some support as crude oil prices rose through much of the week, while technology stocks held up relatively well on the strength of US technology shares and Micron’s results. The TSX then found its footing late in the week, with mining and industrial stocks leading Friday’s rebound. The rally helped erase some of the earlier losses, but not enough to turn the week positive.
It was a week that started with investors becoming increasingly cautious and ended with a welcome change in direction. With October already showing how quickly market sentiment can change, it was a good reminder that a rough few days in the market can turn around surprisingly quickly.
| Portfolio | Weekly Streak |
| Portfolio 1: | 3 – week winning streak |
| Portfolio 2: | 1 – week losing streak |
| Portfolio 3: | 3 – week winning streak |
After the way the week started, I wasn’t surprised to see three of the four major indexes finish in the red, with only the Nasdaq managing a gain thanks to a late rally in technology stocks. My portfolios told a different story, with two of the three posting weekly gains that more than quadrupled the Nasdaq’s performance. Even more surprising, one of those gainers had only 36% of its holdings finish the week higher, showing that the number of winners doesn’t always tell the full story.
Portfolio 1 gained 2.4% even though only 36% of its holdings finished the week higher. Its largest holding, Nvidia (NASDAQ: NVDA), did much of the heavy lifting after announcing a massive US$150 billion share buyback authorization. The announcement pushed Nvidia to a new all-time high and its market capitalization to US$5.7 trillion. The stock itself gained only about 1% for the week, but with a roughly 26% weighting in the portfolio, that was enough to make a meaningful contribution. The announcement also helped revive enthusiasm around AI spending and technology stocks more broadly, playing into Portfolio 1’s technology-heavy positioning.
Carnival Corp. (NYSE: CCL) provided another significant boost, surging more than 13% after reporting strong earnings and finishing the week up 16%. Shopify (TSE: SHOP) also added 10%, helping offset the many holdings that finished lower.
Portfolio 2 was the week’s biggest surprise. Despite 61% of its holdings posting gains, the portfolio fell 0.6%. Its largest position, Bank of Nova Scotia (TSE: BNS), was not among the winners, outweighing gains elsewhere, including a 17% jump in MongoDB (NASDAQ: MDB). The week was a good example of how much more influence a portfolio’s largest holdings can have than the number of stocks moving higher.
Portfolio 3 also gained 2.4%, but unlike Portfolio 1, the gain was broadly supported. An impressive 73% of its holdings finished the week higher. Nvidia again provided a boost, while the late-week technology rally lifted Shopify and 5N Plus (TSE: VNP), both of which gained about 10%. With nearly three-quarters of its holdings finishing higher, Portfolio 3 had the strongest breadth of the three portfolios.
Overall, it was another interesting week for the portfolios and a good reminder that performance is ultimately about where the gains and losses occur, not simply how many stocks move in each direction.
Companies on the Radar
 This week, no new companies came across my radar, but I dropped Generac Holdings (NYSE: GNRC), the power generation and energy management company. I decided I already had enough exposure, directly or indirectly, to the AI sector and didn’t want to add more. I did keep Ingredion on my radar for further evaluation, as it could provide some diversification from the growth-oriented companies in my three portfolios.
With that subtraction, my radar list is now down to five companies.
- Mattr Corp. (TSE: MATR): A small cap Canadian industrial technology company that designs and manufactures specialized infrastructure products using advanced materials. The company may not be familiar to most investors, but its products support industries such as energy, electrification, communications, transportation, and water management. From composite pipes and underground storage tanks to specialized wire and cable solutions, Mattr creates products designed to be lighter, more durable, and resistant to harsh environments. Think of it as a behind-the-scenes supplier helping modern infrastructure operate more safely and efficiently, generating revenue by selling specialized products to industrial customers around the world.
- Capital Power Corporation (TSX: CPX): A mid cap Canadian power producer that generates electricity from a mix of natural gas, wind, solar and battery storage across North America. With electricity demand rising rapidly from AI data centres, industrial growth and electrification, Capital Power is expanding its natural-gas generation while adding renewable and storage capacity. Its recent agreement to supply 250 MW of power to a new Meta (NASDAQ: META) data centre in Alberta for more than 10 years highlights how the AI boom is creating opportunities beyond the technology companies building the data centres themselves.
- Emera Incorporated (TSX: EMA): A large cap Canadian energy company that owns regulated electric and natural gas utilities serving about 2.6 million customers across Canada, the US, and the Caribbean. Its utilities provide a relatively stable source of revenue while Emera invests billions in expanding and modernizing its power networks. With electricity demand expected to grow as AI data centres, industrial activity and electrification increase, Emera could benefit from the long-term need for more reliable power.
- S&P Global (NYSE: SPGI): A large cap American company and one of the world’s most important financial information companies. Most investors know it for the S&P 500 Index, but the business also provides credit ratings, market data, analytics, and research used by banks, corporations, governments, and investors worldwide. Think of it as one of the key information providers that helps global financial markets function, generating revenue through subscriptions, licensing fees, and rating services.
- Ingredion (NYSE: INGR): A mid-cap American ingredient manufacturer that turns plant-based raw materials into starches, sweeteners, fibres, and specialty ingredients used in thousands of everyday products. Its customers span food and beverage, animal nutrition, brewing, and industrial markets. With 10 consecutive years of dividend growth, Ingredion could provide an interesting counterbalance to the more growth-oriented companies in my portfolios.
As always, these are not buy recommendations. Make sure to do your own research and choose investments that fit your personal financial goals.
The Radar Check was last updated October 2, 2026.


That’s a wrap for this week, thanks for reading – may your portfolio stay green and your dividends steady. See you next time!