
How Oil Moves Markets
This past week, higher oil prices and rising US Treasury bond yields were among the main factors weighing on the markets. At first, I didn’t see the connection between the two, so I did a bit of digging to understand how a rise in crude could help push government bond yields higher. This week, I thought I’d try to explain that connection because, on the surface, the two don’t appear to have much in common.
Oil prices have a way of reaching into almost every corner of the economy. When crude rises sharply, the immediate impact is easy to see at the gas pump, but the bigger story is what happens next. More expensive oil raises transportation and production costs for businesses, while consumers have less money left over after paying for fuel and other energy-related expenses. That can push prices higher across the economy and raise concerns that inflation could become more persistent.
That is where the first domino falls.
If investors believe higher oil prices will keep inflation elevated, they may also expect central banks, such as the Bank of Canada and the US Federal Reserve, to keep interest rates higher for longer. Those expectations matter to the bond market. Central banks don’t directly control government bond yields, but their interest-rate decisions and expectations about future inflation have a major influence on them. When investors expect rates to remain high, they generally demand higher yields from bonds. And when bond yields rise, something important happens to stocks.
A bond is essentially a promise to pay investors interest over a set period of time. Stocks don’t make that same promise. Their potential returns come from the future profits and growth of the companies that issue them. When investors can earn more from relatively low-risk government bonds, stocks need to offer enough potential reward to remain attractive. That can mean investors are willing to pay less for shares, particularly companies whose value depends heavily on profits expected many years into the future.
This is why higher bond yields can put pressure on the broader stock market, even when companies have little direct connection to oil. Higher yields can make future profits less valuable today, while higher borrowing costs can make it more expensive for businesses and consumers to spend and invest. The effects can range from a company delaying a new factory to a consumer thinking twice about a major purchase.
There is another side to the oil story, though. Higher crude prices can benefit oil producers and other energy companies by boosting revenue and profits. That’s one reason energy stocks can sometimes rise while the broader market is falling. But those gains can be offset if higher oil prices begin weighing on the rest of the economy.
That helps explain why investors were paying so much attention to oil this week. Crude prices climbed above US$100 a barrel, raising concerns that the recent decline in inflation could stall or even reverse. The concern wasn’t simply that gasoline would become more expensive. It was that higher oil could set off a chain reaction through inflation, interest rates and bond yields, eventually putting pressure on stock prices.
So the dominoes aren’t really separate events. They’re connected. Higher oil can push inflation higher. Higher inflation can keep interest rates elevated. Higher rates can push bond yields higher. And higher yields can make stocks less attractive. Nobody is completely insulated from crude: oil is an input cost for businesses across the economy.
For investors, understanding that connection is more useful than simply knowing that the market went up or down. It helps explain why it moved.
With that connection in mind, let’s see how oil, inflation and rising bond yields affected the markets, and how those market moves affected my portfolios.
Items that may only interest or educate me ….
Canadian Economic news, US Economic news, ….
Canadian Economic news
This past week’s key economic data that the Bank of Canada (BoC) considers when deciding whether to raise or lower the interest rate.
Consumer Price Index (CPI)
Canada’s inflation picture looked a little better in August than the headline number might suggest. Statistics Canada reported that consumer prices rose 3.0% from a year earlier, matching July’s pace. But monthly prices fell 0.1%, a sharp turnaround from July’s 0.5% increase and well below the 0.5% gain analysts expected. The annual rate was slightly higher than the 2.9% consensus forecast.
Beneath the headline, there was plenty of movement. Clothing and footwear prices fell 0.8% during the month, while household operations, furnishings and equipment rose 0.3%, the largest monthly increase. Over the past year, gasoline was the clear outlier, with prices up a striking 22.8%. At the other end of the spectrum, household operations, furnishings and equipment rose just 0.4%.
Shelter costs, including rent and mortgage interest, increased 0.1% for the second consecutive month, leaving them 1.5% higher than a year ago, up from 1.3% in July.
The more encouraging news came from inflation excluding the more volatile food and energy categories, which was unchanged in August and rose 2.1% year over year. That suggests the 3% headline rate is being driven more by energy prices than by a broad acceleration in consumer prices.
That makes August’s report less troubling than the headline suggests. Inflation remains above the BoC’s 2% target, but the underlying numbers are still close to target, with little evidence that higher prices are spreading broadly through the economy.
There is one catch. The August numbers don’t capture the full impact of the latest oil surge, which has pushed crude above US$100 a barrel. If oil stays elevated, gasoline prices could give inflation another jolt in the months ahead. For now, though, the underlying trend remains encouraging.
Canadian Market Volatility
Canada’s version of the market’s “fear gauge” is the S&P/TSX 60 VIX Index (VIXC). Like the US volatility index (VIX), it measures expected volatility in the Canadian stock market over the next 30 days. Higher readings indicate greater uncertainty, while lower readings point to calmer conditions.
The VIXC opened the week at 14.62, up slightly from the previous week’s close of 14.21, before quickly dropping to 14. It then fluctuated mainly between 14.0 and 14.75 as rising oil prices and government bond yields added some uncertainty. As both eased, the VIXC dropped below 14 and ended the week at 13.85.
Overall, the VIXC remained relatively subdued throughout the week, suggesting that expectations for near-term volatility in Canadian stocks remained fairly low despite the swings in oil prices and bond yields.
Note: The VIXC typically trades at lower levels than the VIX, partly because of the different makeup of the Canadian and US markets. The S&P 500 has a much larger weighting in technology, while the TSX has greater exposure to financials, energy and materials. Because these sectors respond differently to economic conditions and commodity prices, the two indexes can have different levels of expected volatility.
US Economic news
This past week’s key data points that the Federal Reserve (Fed) considers when deciding whether to raise or lower the interest rate.
Federal Reserve Open Markets Committee (FOMC) Rate Decision
The Fed’s FOMC voted unanimously to raise the benchmark interest rate by .25%, bringing the target range to 3.75%–4.00%. It was the first rate hike in three years. The decision comes as economic growth remains resilient, while persistent inflation concerns have been compounded by rising oil prices, uncertain trade conditions and the country’s long-term fiscal outlook.
Perhaps more importantly, the Fed’s latest projections point to a stronger economy but a slower path back to its 2% inflation target. The median projection now calls for another .25% increase by the end of 2026, suggesting another hike later this year is possible. For investors, the message is clear: the Fed sees enough strength in the economy to keep fighting inflation, even as higher oil prices and trade concerns add another challenge.
Retail Sales
The US retail sales report for August was considerably stronger than expected, showing that American consumers continued to spend despite higher prices and borrowing costs. The Census Bureau reported that retail sales rose 1.2% in August, the largest monthly increase since March, following an upwardly revised 0.5% decline in July. Economists had expected a gain of just 0.8%. Year over year, retail sales were up 6.0%, accelerating from July’s 5.0% increase.
The strength was fairly broad, although gasoline stations led the monthly increase, with sales rising 3.1%. Building material and garden equipment and supplies dealers was the only major category to decline, falling 0.2%. Over the past year, gasoline stations also recorded the largest increase, with sales up 21.0%, largely reflecting higher fuel prices. Food and beverage stores saw the smallest increase, up 0.5%.
Looking beyond gasoline and vehicles gives us a better sense of consumer spending. Core retail sales, which exclude motor vehicles and parts and gasoline stations, rose 1.2% in August after falling 0.2% in July. On an annual basis, core sales increased 5.6%, up from July’s 4.8%.
This is basically good economic news with an inflation complication.
Consumers are still spending, and that’s important because consumer spending is a major driver of the American economy. The strength of the August report has led economists to raise some third-quarter GDP estimates.
But strong consumer demand can also make it harder for inflation to cool, particularly when oil prices are already putting upward pressure on prices. The Fed had this strong retail sales report in hand before announcing its rate decision today, but the data arrived only hours before the announcement and after the meeting had already begun. While it’s too early to say the report influenced the decision, it provided another sign that consumer demand remains resilient even as inflation pressures persist.
American Market Volatility
The VIX, often called the market’s “fear gauge,” measures expected S&P 500 volatility over the next 30 days. Higher readings signal greater uncertainty, while levels above 20 are typically associated with elevated volatility.
The VIX opened the week at 17.50, up from the previous Friday’s close of 15.84, as higher oil prices, inflation concerns and the possibility of a rate hike kept investors on edge. It fluctuated between 17 and 18 through the first part of the week before spiking to 18.55 after the Fed announced it was raising the benchmark interest rate. However, the next day the VIX dropped below 16 as investors digested the Fed’s decision and appeared to approve of its focus on bringing inflation back to its 2% target. The VIX continued to fall through the rest of the week, eventually closing at 14.81.
The VIX remained below 20 throughout the week, indicating that volatility was still relatively contained. Despite the midweek spike, it finished below where it started, suggesting that the market ended the week with less uncertainty than it began with. The combination of easing oil prices, greater clarity on interest rates and rising stock prices points to a more comfortable market heading into the weekend.
Weekly Market and Portfolio Review
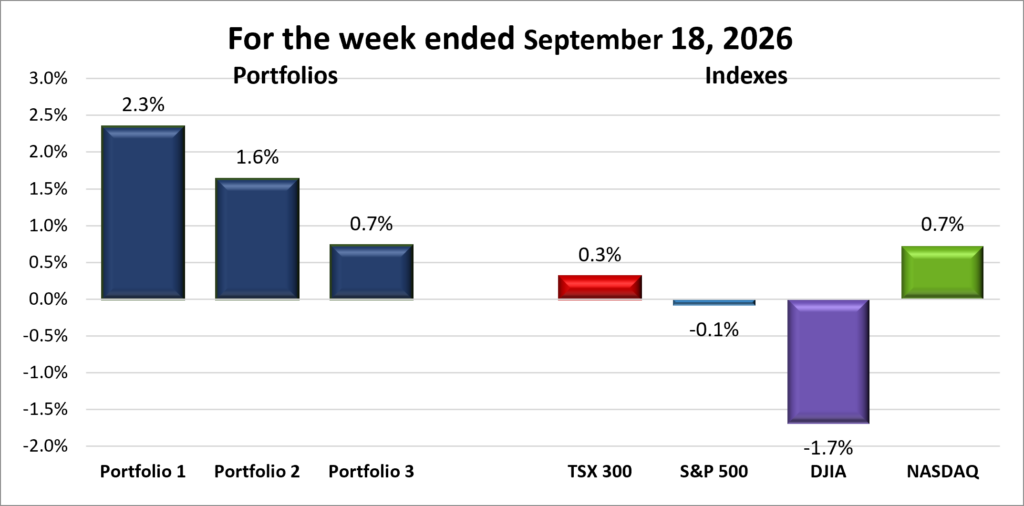
For the week, the TSX (SPTSX) gained 0.3%, the S&P 500 (SPX) slipped 0.1%, the DJIA (INDU) dropped 1.7% and the Nasdaq (CCMP) advanced 0.7%.
| Index | Weekly Streak |
| TSX: | 1 – week winning streak |
| S&P: | 2 – week losing streak |
| DJIA: | 3 – week losing streak |
| Nasdaq: | 1 – week winning streak |

 After a slow start to the week, with only the Toronto Stock Exchange Composite Index (TSX) posting a daily gain, markets trended lower. The S&P 500 Index (S&P), the Dow Jones Industrial Average (DJIA), and the Nasdaq Composite Index (Nasdaq) each extended their daily losing streaks to three days before snapping them late in the week, with the TSX and Nasdaq going on to claw their way into positive territory for the week, ending the TSX’s four-week losing streak and the Nasdaq’s one-week losing streak.
The US markets were largely driven by oil, inflation and interest-rate expectations, with concerns about artificial intelligence (AI) adding pressure on technology stocks. Rising crude prices early in the week, fuelled by continued Middle East supply disruptions, pushed Brent crude oil above US$109 at the start of the week. Fuel prices have also risen significantly since the start of the Iran war, raising concerns that higher energy costs could keep inflation elevated. Those concerns intensified after a drone attack temporarily shut down Saudi Arabia’s key East-West Pipeline, while the ongoing bottleneck in the Strait of Hormuz continued to threaten the flow of a significant share of the world’s oil. Oil prices eased later in the week, with Brent crude ending the week below US$100 per barrel, providing some relief, but investors remained concerned about the inflationary impact of elevated energy costs.
US Treasury bond yields climbed to levels not seen since before the Great Financial Crisis, with the 10-year yield moving above 5% for the first time since 2007. Fed policy expectations, surging oil prices, government debt concerns and rising global interest rates are all pushing yields higher. For stocks, higher yields increase borrowing costs and make future corporate earnings less valuable today, putting particular pressure on growth companies and heavily indebted businesses, including those investing heavily in AI infrastructure. The 10-year yield pulled back Thursday, helping fuel the market’s broad rebound, but climbed back above 5% Friday, renewing some of that pressure.
At the same time, fresh concerns about the pace and cost of AI development, along with mounting fears over AI’s potential risks after several prominent technology executives warned about the potential dangers of rapidly advancing AI, weighed on technology stocks. However, following the Fed’s rate decision, technology stocks rebounded, pushing the Nasdaq into positive territory and the S&P closer to the flatline.
The Fed raised its benchmark interest rate by 0.25%, as expected, in its first rate increase since 2023. Fed Chair Kevin Warsh said the economy has strengthened, but inflation is still elevated and has been above the Fed’s 2% target for five years. The bigger issue for investors was the signal that more tightening could lie ahead, with most Fed officials projecting at least one more rate increase this year. Stocks initially fell following the announcement, but rebounded Thursday as oil prices eased and Treasury yields pulled back. The combination helped investors look past the rate hike and sparked a broad, tech-led rally.
In Canada, the TSX was pulled in different directions by its heavy exposure to energy, gold, commodities and financial stocks. Energy stocks initially benefited from the higher crude prices, but that support faded as inflation fears came to the forefront. Later in the week, oil prices eased, cooling inflation concerns and helping the TSX climb into positive territory for the week.
Gold and other metals rebounded sharply late in the week after falling earlier in the week. Financial stocks also participated in the rebound as Canadian bond yields eased alongside US Treasury yields, reducing some pressure on banks and other rate-sensitive companies.
Overall, the week’s swings reflected investors reassessing the relationship between oil-driven inflation, interest rates and the cost of future growth. With oil prices, inflation, interest rates and AI uncertainty all pulling on investor sentiment, the markets appear to be treading water.
| Portfolio | Weekly Streak |
| Portfolio 1: | 1 – week winning streak |
| Portfolio 2: | 1 – week winning streak |
| Portfolio 3: | 1 – week winning streak |
The week looked like it was heading in the wrong direction for all three portfolios. With the major indexes underwater and trending lower by midweek, another losing week seemed likely. Higher oil prices gave Portfolios 1 and 2 an early lift, but it was the late-week rally in technology stocks that changed the story, pushing all three portfolios into positive territory and snapping their two-week losing streak. All three portfolios also finished ahead of the major indexes, giving the week a much better ending than it appeared headed for by midweek.
Portfolio 1 was the top performer, gaining 2.3% for the week and beating all four indexes. It also had the highest percentage of weekly winners, with 50% of its holdings ending the week higher. There were no major moves in either direction, although CrowdStrike (NASDAQ: CRWD) did set a new record closing high.
Portfolio 2 also beat all four indexes, gaining 1.6% and more than doubling the Nasdaq’s gain, the best among the indexes, despite only 42% of its holdings finishing higher. Dollarama (TSE: DOL) provided a nice boost after its earnings report, when the company raised its annual comparable sales growth forecast. The stock jumped 5.5% before giving back some of those gains to finish the week up 3.8%. Guardant Health (NASDAQ: GH) also helped, gaining 14% for the week.
Portfolio 3 had the weakest performance of the three, but its 0.7% gain was still enough to beat every index except the Nasdaq, the week’s top-performing index, when gains were measured to one more decimal place. Only 46% of its holdings finished higher, but Nvidia (NASDAQ: NVDA), its largest holding, gained 5%, providing enough of a boost to push the portfolio into positive territory.
All in all, a much better week than I initially expected. Sometimes leaning into technology stocks can bite, hard; other times, it can really boost a portfolio’s performance. For me, this approach has worked well over the long term, and I’ve grown comfortable with the volatility, though there have certainly been times when the ride has been rough. 😊
Companies on the Radar
 My stock radar stayed quiet again this week, with no new companies making the cut. That leaves just four companies still under consideration, shown below.
- Mattr Corp. (TSE: MATR): A small cap Canadian industrial technology company that designs and manufactures specialized infrastructure products using advanced materials. The company may not be familiar to most investors, but its products support industries such as energy, electrification, communications, transportation, and water management. From composite pipes and underground storage tanks to specialized wire and cable solutions, Mattr creates products designed to be lighter, more durable, and resistant to harsh environments. Think of it as a behind-the-scenes supplier helping modern infrastructure operate more safely and efficiently, generating revenue by selling specialized products to industrial customers around the world.
- Capital Power Corporation (TSX: CPX): A mid cap Canadian power producer that generates electricity from a mix of natural gas, wind, solar and battery storage across North America. With electricity demand rising rapidly from AI data centres, industrial growth and electrification, Capital Power is expanding its natural-gas generation while adding renewable and storage capacity. Its recent agreement to supply 250 MW of power to a new Meta (NASDAQ: META) data centre in Alberta for more than 10 years highlights how the AI boom is creating opportunities beyond the technology companies building the data centres themselves.
- Emera Incorporated (TSX: EMA): A large cap Canadian energy company that owns regulated electric and natural gas utilities serving about 2.6 million customers across Canada, the US and the Caribbean. Its utilities provide a relatively stable source of revenue while Emera invests billions in expanding and modernizing its power networks. With electricity demand expected to grow as AI data centres, industrial activity and electrification increase, Emera could benefit from the long-term need for more reliable power.
- S&P Global (NYSE: SPGI): A large cap American company and one of the world’s most important financial information companies. Most investors know it for the S&P 500 Index, but the business also provides credit ratings, market data, analytics, and research used by banks, corporations, governments, and investors worldwide. Think of it as one of the key information providers that helps global financial markets function, generating revenue through subscriptions, licensing fees, and rating services.
As always, these are not buy recommendations. Make sure to do your own research and choose investments that fit your personal financial goals.
The Radar Check was last updated September 18, 2026.


That’s a wrap for this week, thanks for reading – may your portfolio stay green and your dividends steady. See you next time!