
Monthly Market and Portfolio Review
| Indexes | Monthly Streak |
| TSX: | 4 – month winning streak |
| S&P: | 2 – month losing streak |
| DJIA: | 4 – month winning streak |
| Nasdaq: | 2 – month losing streak |

 July was a month of shifting investor preferences, with the major indexes moving in noticeably different directions. The Toronto Stock Exchange Composite Index (TSX) and Dow Jones Industrial Average (DJIA), with their greater exposure to traditional companies, extended their monthly winning streaks. Meanwhile, the more growth-oriented S&P 500 Index (S&P) and Nasdaq Composite Index (Nasdaq) extended their monthly losing streaks. Beneath those headline numbers, investors weren’t necessarily moving out of stocks. They were changing what they wanted to own.
Artificial intelligence (AI) remained the biggest story of the month. After a strong first half, investors hit the pause button on the AI-driven rally. The central question shifted from “How fast is AI growing?” to “When will these massive capital expenditures turn into profits?” Investors shifted some money toward dividend-paying financials, industrial companies, and other areas less dependent on AI spending, giving the DJIA a relative boost.
As second-quarter earnings season got underway, strong revenue and profit growth from several technology companies reassured investors that demand for AI is still strong. At the same time, the enormous costs of building AI infrastructure remained a concern. This tug-of-war between AI’s potential and its price tag contributed to sharp swings in technology stocks.
Despite those concerns, corporate earnings told a surprisingly strong story. More than 85% of S&P companies reporting during July beat consensus earnings estimates, with strength extending well beyond technology into energy, insurance, consumer discretionary and financials. The broad-based results helped support the market.
Economic data painted a generally resilient picture. Inflation showed signs of easing, while employment and consumer spending suggested the American economy remained healthy. Investors also watched the Federal Reserve for clues about interest rates. A resilient economy, moderating inflation and relatively stable rate expectations supported stocks, although investors remained alert to signs that inflation could return or growth could weaken.
Geopolitical tensions in the Middle East added another source of uncertainty. Oil prices surged in the middle of the month, raising concerns that higher energy costs could push inflation higher again. While this benefited energy producers, it created a headwind for growth stocks. New US tariffs and uncertainty surrounding global trade added to the caution and contributed to several volatile trading sessions.
In Canada, the TSX benefited from its different sector mix. Rising oil prices provided a major boost to energy producers, potentially increasing revenues and profits in one of the index’s largest sectors. Basic materials, home to many of Canada’s mining companies, also provided support as gold remained at historically elevated levels early in the month, helping push the TSX to a record high before mining stocks became more volatile. Financials added further support, with Canada’s major banks and insurers benefiting from a stable interest-rate environment. The Bank of Canada held its policy rate at 2.25% in July while noting signs of improvement in the economy.
July showed why looking beyond headline index numbers matters. American investors became more selective about technology stocks and questioned whether massive AI investments would deliver enough profits to justify their cost. In Canada, energy, basic materials, and financials provided a stronger tailwind. Investors weren’t necessarily moving out of stocks. They were shifting toward companies and sectors where they could see stronger earnings and a clearer path to profits. This sector rotation, where investors move money from one part of the market to another, can produce quite different results for different indexes even when they are responding to the same economic and global events.
| Portfolio | Monthly Streak |
| Portfolio 1: | 1 – month losing streak |
| Portfolio 2: | 4 – month winning streak |
| Portfolio 3: | 1 – month losing streak |
[bear/ Just as the markets had a mixed month, so did my three portfolios. And like the major indexes, the portfolios showed how different sector exposure can produce very different results, particularly when technology stocks fall out of favour.
Portfolio 1 started July strongly before a mid-month pullback erased those gains and then some, leaving it down 0.9% for the month. It ended July with a positive week, but that wasn’t enough to extend its monthly winning streak. Semiconductor weakness, including a decline in Nvidia (NASDAQ: NVDA), weighed heavily on the portfolio, while Apple (NASDAQ: AAPL) added to the volatility. Strong performances from companies such as Amazon (NASDAQ: AMZN), CrowdStrike (NASDAQ: CRWD) and Constellation Software (TSE: CSU), along with the portfolio’s diversification, helped limit the damage.
Portfolio 2 had a more unusual month, bookending a three-week losing streak with strong winning weeks to start and end July. Those gains were enough to produce a 1.7% monthly increase and extend its winning streak. Its lower exposure to technology helped cushion the impact of the sector selloff, while financial and energy holdings provided support. Bank of Nova Scotia (TSE: BNS) and iA Financial (TSE: IAG) both reached new record highs. Microsoft (NASDAQ: MSFT) and MongoDB (NASDAQ: MDB) remained major influences, delivering strong gains at times but also adding to the portfolio’s volatility.
Portfolio 3 followed a similar path to Portfolio 1, with two winning weeks followed by two down weeks before ending the month on a positive note. That wasn’t enough to prevent the portfolio from losing 0.8% in July. Strong early gains from space and technology stocks were followed by a pullback, with Rocket Lab (NASDAQ: RKLB) and MDA Space (TSE: MDA) providing some eye-catching gains before giving back some of their progress. Microsoft and Nvidia also provided support at various points, while declines in several growth and technology holdings, including Vertiv (NYSE: VRT), weighed on the portfolio. Energy stocks and Royal Bank of Canada (TSE: RY) helped cushion the weakness.
Perhaps the most interesting result was Portfolio 2, which outperformed the other two portfolios despite suffering three weekly losses. It is a good reminder that limiting losses can be just as important as capturing gains. A portfolio doesn’t have to win every week to deliver strong long-term results. Avoiding the big losses can make a significant difference when the market eventually turns higher again.
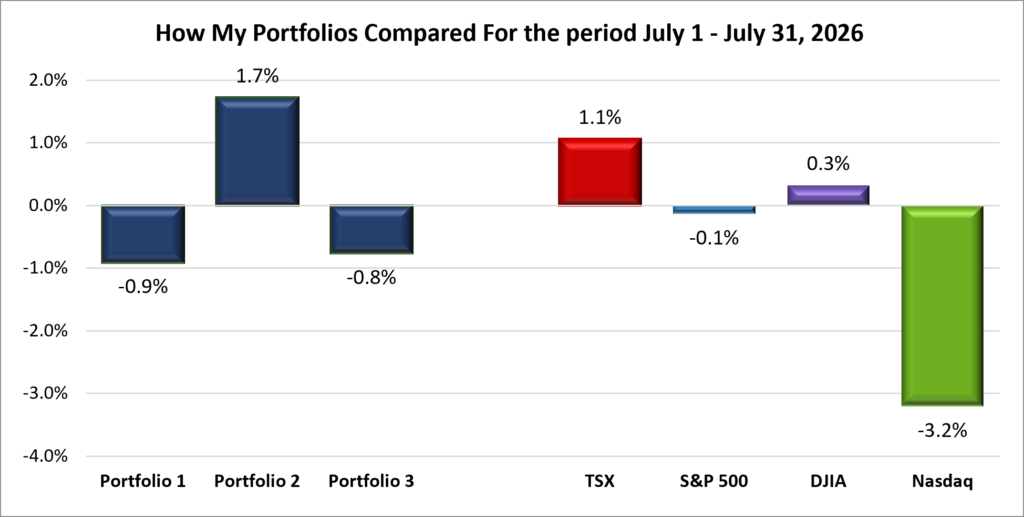
A comparison of the monthly returns of my three portfolios and the major market indexes.
Year To Date
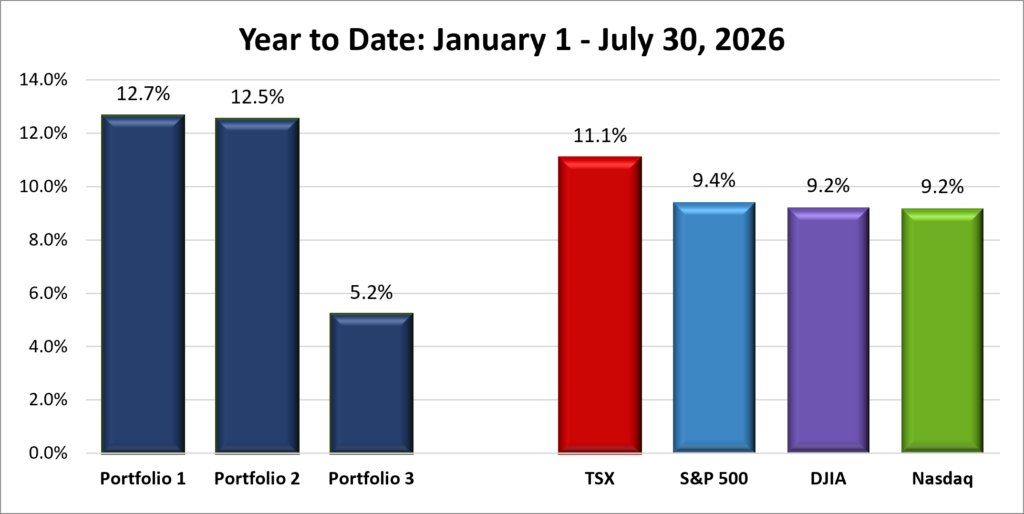
A comparison of the year-to-date returns of my three portfolios and the major market indexes
July reshuffled the year-to-date leaderboard, with the TSX taking over the top spot after rising oil prices gave Canadian stocks a boost. The TSX ended July up 11.1% for the year, ahead of the S&P 500 at 9.4%. The DJIA and Nasdaq were tied at 9.2%, although the DJIA takes third place when the numbers are extended to another decimal. The DJIA had a particularly strong July, increasing its year-to-date gain from 8.9% at the end of June. The Nasdaq, on the other hand, gave back some of its earlier gains, falling from 12.8% at the end of June to 9.2%.
The July pullback also trimmed the gains in all three portfolios. Portfolio 1 is still my top performer despite falling from 13.7% to 12.7%. Portfolio 2 slipped from 13.4% to 12.5% but narrowed the gap with Portfolio 1 to just 0.2 percentage points. Portfolio 3 fell from 6.0% to 5.2% and remains well behind the other two.
Despite the July setbacks, there is still a positive takeaway. Portfolios 1 and 2 remain ahead of all four major indexes for the year, while Portfolio 3 continues to trail the pack.
What My Three Portfolios Did in July 2026
Portfolio 1 for July 2026: DOWN 
Activity
Sold: The Trade Desk (NASDAQ: TTD) Please see July 31 Weekly Update
Dividends Received this month:
Companies followed by DRIP (Dividend Re-Investment Plan) indicate additional shares were purchased with the dividend. Any cash leftover was added to the cash balance.
Canadian $
Telus (TSE: T) DRIP
iShares S&P/TSX Global Gold Index ETF (TSE: XGD)
Dream Industrial Real Estate Investment Trust (TSE: DIR.UN)
BSR Real Estate Investment Trust (TSE: HOM.U)
Decisive Dividend (TSE: DE) DRIP
BCE Inc. (TSE: BCE) DRIP
US $
No US$ dividends this month.
Quarterly Reports
Interactive Brokers Group, Inc.
Second quarter 2026 financial results on July 21, 2026
Alphabet Inc.
Second quarter 2026 financial results on July 22, 2026
CN Rail
Second quarter 2026 financial results on July 24, 2026
Celestica Inc.
Second quarter 2026 financial results on July 28, 2026
Visa Inc.
Third quarter 2026 financial results on July 28, 2026
Tourmaline Oil Corp
Second quarter 2026 financial results on July 29, 2026
Decisive Dividend Corporation
Second quarter 2026 financial results on July 30, 2026
Hammond Power Solutions Inc.
Second quarter 2026 financial results on July 30, 2026
Amazon.com, Inc.
Second quarter 2026 financial results on July 30, 2026
Apple Inc.
Third quarter 2026 financial results on July 30, 2026
Ferrari N.V.
Second quarter 2026 financial results on July 31, 2026
TMX Group Limited
Second quarter 2026 financial results on July 31, 2026
Cameco
Second quarter 2026 financial results on July 31, 2026
Portfolio 2 for July 2026: UP 
Activity
Sold: Brookfield Infrastructure Corporation (TSE: BIPC) Please see July 24 Weekly Update
Sold: South Bow (TSE: SOBO) Please see July 24 Weekly Update
Bought: Brookfield Infrastructure Partners (TSE: BIP.UN) Please see July 31 Weekly Update
Bought: TC Energy (TSE: TRP) Please see July 31 Weekly Update
Bought: iA Financial (TSE: IAG) Please see July 31 Weekly Update
Dividends Received this month:
Canadian $
Telus (TSE: T) DRIP
Canadian Natural Resources (TSE: CNQ) DRIP
Dream Industrial Real Estate Investment Trust (TSE: DIR.UN) DRIP
Whitecap Resources (TSE: WCP)
South Bow Corp. (TSE: SOBO)
Brookfield Renewable Partners LP (TSE: BEP.UN)
Smartcentres Real Estate Investment Trust (TSE: SRU.UN)
Brookfield Infrastructure Partners (TSE: BIP.UN)
Alimentation Couche-Tard (TSE: ATD)
US $
NAPCO Security Technologies (NASDAQ: NSSC)
Walt Disney Company (NYSE: DIS)
Quarterly Reports
Aritzia Inc.
First quarter 2027 financial results on July 9, 2026
Whitecap Resources Inc.
Second quarter 2026 financial results on July 29, 2026
Tourmaline Oil Corp
See report under Portfolio 1.
Microsoft Corp.
Fourth quarter 2026 financial results on July 29, 2026
TC Energy Corporation
Second quarter 2026 financial results on July 30, 2026
Guardant Health, Inc.
Second quarter 2026 financial results on July 30, 2026
Brookfield Infrastructure Partners L.P.
Second quarter 2026 financial results on July 30, 2026
Hammond Power Solutions Inc.
See report under Portfolio 1.
Fortis Inc.
Second quarter 2026 financial results on July 31, 2026
Brookfield Renewable Partners L.P.
Second quarter 2026 financial results on July 31, 2026
Supremex Inc.
Second quarter 2026 financial results on July 31, 2026
Portfolio 3 for July 2026: DOWN
Activity
No significant activity to report this month.
Dividends Received this month:
Canadian $
Rockpoint Gas Storage (TSE: RGSI)
Brookfield Corporation (TSE: BN)
Brookfield Asset Management (TSE: BAM)
Alvopetro Energy (TSEV: ALV)
Smartcentres Real Estate Investment Trust (TSE: SRU.UN) DRIP
Brookfield Renewable Partners LP (TSE: BEP.UN)
TD U.S. Equity Index ETF (TSX: TPU)
US $
Amphenol (NYSE: APH)
GE Aerospace (NYSE: GE)
Quarterly Reports
GE Aerospace
Second quarter 2026 financial results on July 16, 2026
Corning Incorporated
Second quarter 2026 financial results on July 28, 2026
Amphenol Corporation
Second quarter 2026 financial results on July 29, 2026
Vertiv Holdings Co.
Second quarter 2026 financial results on July 29, 2026
Microsoft Corp.
See report under Portfolio 2.
Brookfield Renewable Partners L.P.
See report under Portfolio 2.