
Earnings Season: Reading Between the Lines
Earnings season is in full swing, and it’s one of the few times each quarter when the market gets a real look under the hood of the companies we own. Across my three portfolios, I currently hold around 80 companies, and this past week roughly 20 of them reported results – bringing a steady stream of updates that can move both individual stocks and the broader markets.
For example, after Apple (NASD: AAPL) reported earnings last week, its strong results not only pushed its share price higher but also lifted the broader technology sector – and, given its size, helped pull the overall market up the following day.
At its core, an earnings report is simply a company giving an update on how it performed over the past three months. It covers things like revenue (how much money the company brought in), profit (what it kept after expenses), and often includes guidance – management’s outlook for where things could be headed next.
But what really matters isn’t just the numbers themselves – it’s how those numbers compare to expectations.
Before each report, analysts set estimates for revenue and earnings. If a company beats those expectations, the stock can move higher. If it misses, it can fall. And sometimes, even “good” results can lead to a drop if investors were expecting even better. For example, Nvidia (NASD: NVDA) often beats expectations, but if it doesn’t beat them enough, or if guidance disappoints, the stock can still sell off after earnings.
That’s why earnings season can feel a bit unpredictable. Stocks aren’t reacting to the past – they’re reacting to whether the future looks better or worse than expected.
When you first start investing, it’s easy to get lost in all the headlines and numbers. So instead of trying to follow everything, here are a few key things I focus on when reading an earnings report:
First, is the company growing? Revenue and earnings trends help show whether the business is moving in the right direction. Revenue is usually right at the top of the earnings release and income statement, and you can gauge growth by comparing it to the same quarter last year or the previous quarter. Consistent growth is a good sign, while slowing or declining revenue can signal weakening demand.
Second, are margins holding up? This helps show how efficiently the company is turning revenue into profit. The most common is profit margin, which is calculated by dividing net income by revenue. You’ll find both of these numbers on the income statement. If margins are rising over time, it often means the company is becoming more efficient or has pricing power. If they’re falling, it can signal rising costs or pressure on the business.
Third, what is management saying about the future? This is usually referred to as guidance and is found in the earnings release, with more detail often discussed on the earnings call. It gives investors a sense of what the company expects in the coming quarters. Even if current results are strong, a cautious outlook can weigh on sentiment, since markets are always looking forward.
And finally, is the overall story still intact? This is about whether the main trends – growth, margins, and outlook – are still holding up. One quarter won’t make or break a company, but it can reveal whether something is starting to shift beneath the surface.
With so many companies reporting this week and over the next couple of weeks, I’ll be paying close attention – not just to the numbers, but to what they tell us about the bigger picture. With that in mind, let’s take a look at what else drove the markets this week.
Items that may only interest or educate me ….
Canadian Economic news, US Economic news, ….
Canadian Economic news
This past week’s key economic data that the Bank of Canada (BoC) considers when deciding whether to raise or lower the interest rate.
Labour Force Survey
Statistics Canada’s Labour Force Survey (LFS) for April showed a job market that continues to soften beneath the surface. Canada lost 17,000 jobs during the month, essentially reversing March’s gain of 14,100. While the headline decline was modest, the bigger concern was the mix of jobs lost. The country shed 46,700 full-time positions, partially offset by a gain of 29,000 part-time jobs. In other words, it wasn’t just the number of jobs that weakened, but the quality of employment as well. Full-time jobs typically provide stronger income stability and support consumer spending, so this shift matters for the broader economy.
The weakness was concentrated mainly in goods-producing industries like manufacturing and construction, sectors that tend to be more sensitive to economic slowdowns and trade uncertainty. Ongoing US tariffs and weaker global demand continue to weigh on export-oriented parts of Canada’s economy.
The unemployment rate climbed to 6.9% as more Canadians looked for work. Rising labour force participation is normally a positive sign, but weak job creation means more people are now competing for a limited number of openings. The April reading marked the highest unemployment rate in six months and leaves it up 0.4% since the start of the year.
Wage growth also continued to cool. Average hourly wages rose 4.5% year over year in April, down slightly from 4.7% in March. Growth is still running above inflation, but the slowdown suggests some of the intense labour market pressure seen over the past few years is gradually easing.
The report creates a difficult balancing act for the BoC. A weakening labour market would normally support future rate cuts, but rising oil prices and renewed inflation concerns tied to the Iran conflict are pushing in the opposite direction. The central bank has already warned that worsening inflation could reopen the door to additional rate hikes. The result is an economy showing clearer signs of slowing while inflation risks remain stubbornly present.
Canadian Market Volatility
Canada’s version of the market “fear gauge” is the S&P/TSX 60 VIX Index (VIXC), often shown on trading platforms as VIXI.TO. Like the better-known CBOE Volatility Index in the US, it measures expected volatility in the Canadian stock market over the next 30 days.
The index opened the week at 16.71 and quickly climbed above 17.50 as tensions in the Middle East pushed oil prices higher, reigniting concerns around inflation and the possibility of interest rates staying elevated for longer. Sentiment improved later in the week as optimism around a possible end to the Iran conflict helped calm markets and pull the VIXC lower. However, another jump in oil prices alongside a weaker-than-expected Canadian labour report briefly pushed the fear gauge back above 17.50 before it settled at 17.16 to close the week.
Even with geopolitical tensions and sharp swings in oil prices, volatility in Canada remained relatively contained overall. The VIXC finishing near where it started suggests investors became somewhat more comfortable with the broader market backdrop as the week progressed. It also reflects the more defensive nature of the Canadian market, where sectors like banks, energy, and mining tend to produce steadier market movements than the technology-heavy indexes in the US.
US Economic news
This past week’s key data points that the Federal Reserve (Fed) considers when deciding whether to raise or lower the interest rate.
Labour data
This week’s labour data includes three key reports – the Job Openings and Labor Turnover Survey (JOLTS), the ADP Employment Report, and the Employment Situation Summary (ESS) – each offering a different lens on the US job market.
JOLTS focuses on labour demand through job openings, hiring, and quits. ADP provides an early read on private-sector payrolls. The ESS, or monthly jobs report, ties it all together with job creation, unemployment, and wage growth. Taken together, they show whether the labour market is still holding firm or gradually cooling.
Labor Department’s Job Openings and Labor Turnover Survey
The JOLTS report for March showed job openings holding steady at around 6.9 million, roughly in line with expectations. That suggests demand for workers remains stable. Hiring picked up modestly during the month, reflecting continued employer confidence, while layoffs also ticked higher, hinting at early pockets of softness beneath the surface.
ADP Employment Report
The ADP report showed a pickup in private-sector hiring in April, with 109,000 jobs added, above expectations and the strongest gain in about 15 months. That was an improvement from March’s downwardly revised 61,000, suggesting hiring momentum is stabilising after a softer start to the year.
While still modest in scale, the gain points to improving business confidence. However, with growth not broad-based, the recovery still looks gradual rather than strong.
The Bureau of Labor Statistics’ Employment Situation Summary
The official jobs report for April reinforced the picture drawn by the JOLTS and ADP data. The economy added 115,000 jobs, well above expectations of around 62,000, following an upwardly revised 185,000 gain in March. Hiring is still holding up, just no longer running at the pace seen during earlier phases of the cycle.
The unemployment rate edged up to 4.3%, in line with expectations and still near historically low levels. The labour market is still tight, but clearly less overheated than in 2022-2023. Conditions are shifting toward balance rather than acceleration.
Wage growth also continued to ease, with average hourly earnings rising 0.2% on the month and 3.6% year over year. That matters for inflation because wages feed directly into services prices, one of the stickiest parts of the inflation story. Softer wage growth helps take some pressure off that side of inflation.
Overall Labour Analysis
Across all three reports, the message is consistent: the US labour market is still solid, but it is moving out of its overheated post-pandemic phase and into a slower, more balanced footing.
Job openings are holding steady, hiring is stabilising rather than accelerating, and wage growth is gradually moderating. A slight rise in layoffs points to early pockets of softness, but overall demand for labour remains healthy.
That balance matters because wages feed directly into services inflation. Strong hiring can keep wage growth firm, which makes it harder for inflation to fully cool and keeps the Fed more patient on rate cuts.
From a market perspective, this is a constructive backdrop. It eases inflation pressure without signalling a meaningful slowdown in growth. In other words, the economy appears to be transitioning toward a softer landing rather than rolling over into recession.
Consumer Sentiment Index (CSI)
The University of Michigan’s preliminary May CSI fell to a record low 48.2, down from the previous all-time low of 49.8 set in April and below expectations of 49.5. Sentiment is down 3.2% from last month and 7.7% from a year ago, showing many Americans still feel uneasy about the economy.
The weakness was most visible in how consumers view current conditions. The Current Economic Conditions Index, which reflects how people feel about their finances and job security today, fell to 47.8, down 9.0% from April and 18.8% from a year ago. Meanwhile, the Expectations Index, which measures confidence over the next six months, edged up slightly to 48.5, suggesting consumers are still cautious but somewhat less pessimistic about the future.
The biggest driver of the lower headline number was oil. As tensions involving Iran disrupted energy markets in recent weeks, gasoline prices climbed sharply, squeezing household budgets. Consumers are feeling that directly every time they fill up at the pump, and it’s starting to shape how they view both their finances and the broader economy.
What makes the report especially interesting is the disconnect between investors and non-investors. The S&P and Nasdaq remain near record highs thanks to strong earnings and artificial intelligence (AI) enthusiasm, yet consumers are still deeply pessimistic. Investors are focused on profits and future growth, while households are focused on gasoline, groceries, and borrowing costs.
The report was another reminder that a strong stock market does not always mean consumers feel confident about the economy.
American Market Volatility
The CBOE Volatility Index (VIX), often called the market’s “fear gauge,” tracks expected volatility in the S&P 500 over the next 30 days. In simple terms, it reflects how much uncertainty investors are pricing into the market. The VIX tends to rise during periods of fear or uncertainty and fall when investors feel more confident and markets are calmer. While readings above 20 often signal elevated concern, the index remained below that level throughout the week, suggesting investors stayed relatively composed despite geopolitical tensions.
The VIX started the week at 17.38 before climbing toward 19 as tensions in the US-Iran conflict intensified. Sentiment then gradually improved as the ceasefire held and companies continued to deliver strong earnings reports. By the end of the week, with Iran considering a US-backed peace proposal, the VIX closed at 17.91, suggesting investor anxiety had eased and market sentiment was stabilising.
Weekly Market and Portfolio Review
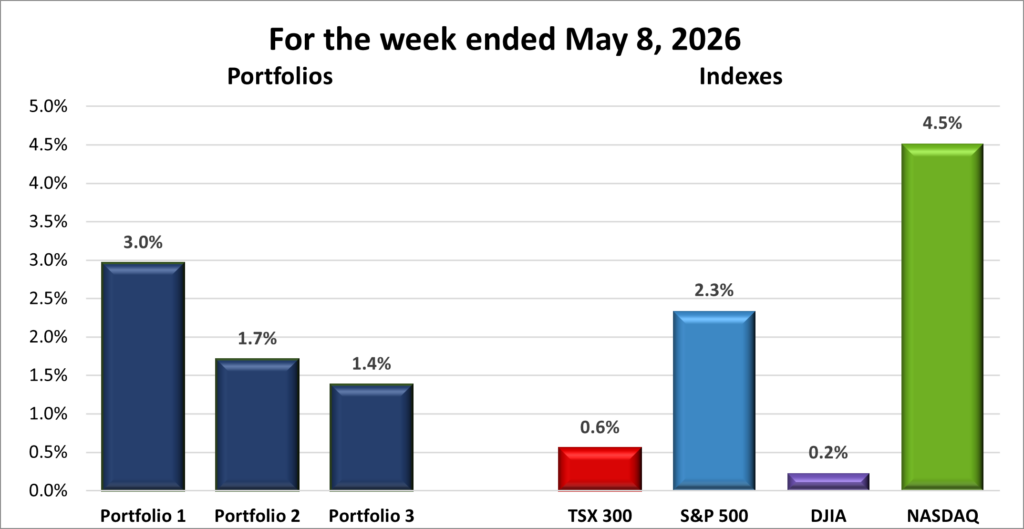
For the week, the TSX (SPTSX) gained 0.6%, the S&P 500 (SPX) climbed 2.3%, the DJIA (INDU) edged up 0.2% and the Nasdaq (CCMP) surged 4.5%.
| Index | Weekly Streak |
| TSX: | 1 – week winning streak |
| S&P: | 6 – week winning streak |
| DJIA: | 2 – week winning streak |
| Nasdaq: | 6 – week winning streak |
![]() After April’s powerful rally, markets entered the first week of May balancing strong earnings against geopolitical and inflation concerns. Despite some volatility, the S&P 500 Index (S&P) and the Nasdaq Composite Index (Nasdaq) each set consecutive record highs midweek, and both closed the week at record highs, extending their winning streaks to six straight weeks. The Dow Jones Industrial Average (DJIA) lagged somewhat behind but also finished higher for the week. Meanwhile, Canada’s Toronto Stock Exchange Composite Index (TSX) had a much bumpier ride, on the verge of extending its losing streak before a strong Friday rally pushed the index back into positive territory for the week.
After April’s powerful rally, markets entered the first week of May balancing strong earnings against geopolitical and inflation concerns. Despite some volatility, the S&P 500 Index (S&P) and the Nasdaq Composite Index (Nasdaq) each set consecutive record highs midweek, and both closed the week at record highs, extending their winning streaks to six straight weeks. The Dow Jones Industrial Average (DJIA) lagged somewhat behind but also finished higher for the week. Meanwhile, Canada’s Toronto Stock Exchange Composite Index (TSX) had a much bumpier ride, on the verge of extending its losing streak before a strong Friday rally pushed the index back into positive territory for the week.
The biggest driver remained the conflict involving Iran and its impact on oil prices. Early in the week, oil surged after an explosion disabled a South Korean-flagged ship in the Strait of Hormuz, while Iran also attacked a UAE-linked tanker and oil facility. The incidents reinforced fears that Iran could still disrupt one of the world’s most important energy shipping routes, sending crude prices sharply higher.
Later in the week, optimism around possible peace negotiations between the US and Iran helped oil prices pull back, easing inflation concerns and improving investor sentiment. Whenever ceasefire hopes improved, oil prices fell and stocks rallied. When tensions resurfaced, oil quickly moved higher again and markets lost momentum.
Interest rates also remained in focus. Investors continued digesting last week’s Fed decision to leave rates unchanged while trying to gauge how long borrowing costs may stay elevated. Higher oil prices complicated the picture because they risk pushing inflation back up, potentially delaying future rate cuts.
On the economic front, April’s jobs report showed the US economy added 115,000 jobs, well above expectations of roughly 62,000. The report reinforced the idea that the labour market is still resilient despite signs of gradual cooling, while softer wage growth helped calm fears that inflation could reaccelerate.
Technology and AI-related companies once again led the market. Earlier fears around AI overspending and disruption largely faded as enthusiasm for AI infrastructure spending sparked a powerful rally. Strong earnings and continued demand for semiconductors, cloud computing, and AI services reinforced confidence that AI spending is beginning to translate into real business growth. The rally pushed both the S&P and Nasdaq to multiple record highs, while Apple reached its first all-time high of 2026, Amazon (NASD: AMZN) its seventh, and Alphabet (NASD: GOOGL) its 14th of the year.
In Canada, the TSX followed many of the same global themes, but with very different leadership underneath the surface. While US markets leaned heavily on technology and AI momentum, the TSX was driven more by commodities, particularly oil and gold, along with several strong corporate earnings reports.
Energy stocks were front and centre for much of the week. Rising tensions involving Iran and concerns around shipping disruptions in the Strait of Hormuz pushed crude prices sharply higher early in the week, giving a strong lift to Canada’s energy sector. Later, as ceasefire optimism and peace proposals gained traction, oil prices eased back, trimming some of those gains but still leaving energy as one of the TSX’s main sources of support.
Gold also played an important role. Geopolitical uncertainty and inflation concerns kept demand for safe-haven assets elevated, helping gold prices remain near record highs and supporting Canada’s mining sector throughout the week.
Interest rate expectations remained another key driver. Early in the week, investors worried the BoC may need to keep rates elevated longer than expected, with the central bank even warning that worsening inflation pressures could reopen the door to consecutive rate hikes. Sentiment improved later in the week after new labour data showed Canada lost 17,000 jobs in April while the unemployment rate climbed to 6.9%, the highest level in six months. The softer report eased some fears around additional rate hikes.
The bigger picture is that markets spent the week balancing two competing forces: strong earnings and AI-driven momentum on one side, and geopolitical tensions, oil volatility, and interest rate uncertainty on the other. That created two very different market experiences. In the US, technology and AI enthusiasm continued pushing indexes higher, while in Canada the TSX responded more to swings in oil, gold, and interest rate expectations.
| Portfolio | Weekly Streak |
| Portfolio 1: | 1 – week winning streak |
| Portfolio 2: | 6 – week winning streak |
| Portfolio 3: | 1 – week winning streak |
![]() The week started off cautiously, but as the S&P and Nasdaq pushed to consecutive record highs, sentiment improved. Strength in technology and AI names more than offset weakness in energy, helping both Portfolios 1 and 3 join Portfolio 2 in the weekly win column.
The week started off cautiously, but as the S&P and Nasdaq pushed to consecutive record highs, sentiment improved. Strength in technology and AI names more than offset weakness in energy, helping both Portfolios 1 and 3 join Portfolio 2 in the weekly win column.
Portfolio 1 had the strongest performance, rising 3.0%, despite the lowest win rate at 59%. It was a standout week for several technology holdings, with Apple, Alphabet, Celestica (TSE: CLS), Lattice Semiconductor (NASD: LSSC) all reaching record highs. The biggest contributor was Datadog (NASD: DDOG), which surged 42% on strong earnings and an increased full-year outlook, after setting a record high during the week. CrowdStrike (NASD: CRWD) added another 15%, while iShares S&P/TSX Global Gold Index ETF (TSE: XGD) gained 10%.
Offsetting those gains were sharp declines in a few positions. Cloudflare (NYSE: NET) fell 11% after announcing workforce reductions and a weaker revenue outlook, while Arista Networks (NYSE: ANET) dropped 19%. Also weighed on returns, Shopify (TSE: SHOP) fell 12% and Celestica dropped 11% after setting its record high at the start of the week.
Portfolio 2 gained 1.7% and extended its weekly win streak to six, matching the consistency of the broader US indices. Performance was relatively broad, with 66% of holdings finishing higher. MongoDB (NASD: MDB) led the way with a 14% gain, while Aritzia (TSE: ATZ) set a record high after reporting strong results and reaching its fiscal 2027 revenue target ahead of schedule. The main drag came from Zoetis (NYSE: ZTS), which declined 27%.
Portfolio 3 rose 1.4% to return to the weekly win column, with 75% of holdings finishing in the green. Rocket Lab (NASD: RKLB) was the standout, climbing 35% for the week after strong revenue results and an upbeat outlook, while also reaching a record high. Besides Datadog, 5N Plus (TSE: VNP), TD US Equity Index ETF (TSE: TPU), and Vertiv Holdings (NYSE: VRT) also set record highs this week. Shopify and Cloudflare acted as headwinds, each falling double digits.
What started off slowly turned into a solid week by the end. A handful of strong moves offset some sizable declines, helping drive performance, with several companies across the portfolios reaching record highs. To paraphrase Marvin the Martian, “Not bad. Not bad at all.” 😊
Companies on the Radar
 After a busy stretch of buying and selling, my radar list is looking a little lighter than usual. I did come across a couple of new potential investments the previous week, but after running them through my checklist, one didn’t make the cut.
Applied Optoelectronics (NASD: AAOI) ultimately fell short, with enough red flags that the risk started to outweigh the potential reward – at least for me. As a result, it’s been cleared from the radar.
That leaves just two companies on the list for now. And after recently adding several companies across the portfolios, I’m feeling less urgency to expand and more interest in building larger stakes in the companies I already own.
Still, the search never really stops. I’m keeping my eyes open for new opportunities – it just has to be the right one. 😊
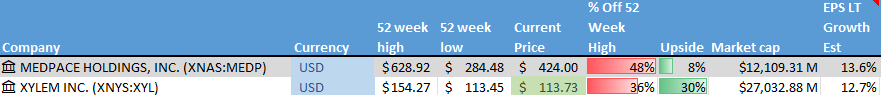
- Medpace Holdings, (NASD: MEDP): The mid-cap American healthcare company that helps biotech and pharmaceutical companies run clinical trials. It manages the process of testing new drugs, from early-stage studies through to regulatory approval.
- Xylem Inc. (NYSE: XYL): This is a large American company that develops water technology focused on moving, treating, and managing water. Its products and services are used by utilities, industrial customers, and municipalities for everything from clean drinking water and wastewater treatment to flood control and leak detection. With aging water infrastructure and more frequent climate challenges like droughts and flooding, demand for Xylem’s solutions is still strong. The business offers exposure to long-term, essential infrastructure spending tied to water scarcity, sustainability, and smarter cities.
As always, these are not buy recommendations. Make sure to do your own research and choose investments that fit your personal financial goals.
The Radar Check was last updated May 8, 2026.

Portfolio Update
Portfolio 2
Sold: Telus (TSE: T) I originally invested in Telus in 2023 to help fund a future expense, where reliability matters more than upside. At the time, the stock had pulled back, so it felt like an opportunity to buy low, and the 6.3% dividend easily beat the roughly 3.35% yield on a GIC. What could go wrong? 😊
Well, the original thesis – steady, reliable dividend growth – started to break down. What began as a stable income investment gradually turned into more of a turnaround story, with the dividend now frozen, looking less secure, and the share price continuing to trend lower. As the stock price fell, the dividend yield climbed above 9%, which is usually a warning sign rather than a bonus. Extremely high yields often signal that investors are becoming concerned about the sustainability of the payout.
The bigger issue was the payout ratio, which climbed to roughly 230%. In simple terms, Telus was paying out far more in dividends than it was earning in profit. While telecom companies often use cash flow metrics alongside earnings because of their large infrastructure investments, a payout ratio that high still raises concerns about how sustainable the dividend really is over the long term.
In other words, what started as a “safe income” stock had quietly drifted into much higher-risk territory.
That’s not what I originally signed up for.
At the end of the day, I trimmed my position because the reason I bought it changed. The dividend story weakened, the risk increased, and it no longer aligned with my goal of owning a reliable income generator.
That’s a wrap for this week, thanks for reading – may your portfolio stay green and your dividends steady. See you next time!