
When the Market Hits a Record but Your Stocks Don’t
At the start of the week, the S&P 500 hit a new high, which sounds like great news for investors. But if your portfolio doesn’t feel like it’s participating in the rally, you’re not imagining it. Beneath the headline numbers, the market has become increasingly concentrated, with a relatively small group of enormous technology companies doing much of the heavy lifting.
The reason starts with how the S&P 500 is constructed. It’s a market-cap-weighted index, meaning the largest companies have the greatest influence on its performance. When a company becomes enormous, even a modest percentage gain can have a meaningful impact on the entire index. Nvidia (NASDAQ: NVDA), Apple (NASDAQ: AAPL) and Microsoft (NASDAQ: MSFT) together account for roughly 22% of the S&P 500, while the Magnificent Seven collectively represent about 35%.
This concentration helps explain how the index can reach new highs even when many individual stocks struggle. A 5% gain in Nvidia has a much greater effect on the S&P 500 than a 5% gain in a much smaller company. When several of the largest stocks rise together, they can lift the entire index even if hundreds of other companies are flat or falling.
That’s what recent market performance illustrates. The rally has been heavily influenced by companies benefiting from the enormous investment in artificial intelligence (AI), particularly semiconductor and other technology businesses. Nvidia, Microsoft and Apple have been major contributors, alongside Meta Platforms (NASDAQ: META). One analysis found that these four companies added roughly 300 points to the S&P 500 during the third quarter of 2026, while the other 496 companies collectively subtracted about 150 points. In other words, the gains from just four companies more than offset the drag from the rest of the index.
This is why looking only at the S&P 500 can give investors an incomplete picture of what’s happening in the market. The index may be at a record high, but that doesn’t mean the average stock is also at a record high. Smaller companies, businesses more sensitive to interest rates and companies outside the technology sector can struggle even as the headline index advances.
There is nothing inherently wrong with a concentrated rally. The companies leading the market are enormous for a reason, and many have strong earnings, substantial cash flow, and dominant positions in their industries. If those businesses continue to grow, the index can continue to benefit from their success.
The important point is to understand what the index is telling us, and what it isn’t.
For me, this is a reminder that investing in the S&P 500 may be less diversified by weight than it appears at first glance. You’re buying shares in 500 companies, but a relatively small number of very large ones have an outsized influence on your returns. That’s not necessarily a problem, but it’s worth understanding when comparing your own portfolio with the headline performance of the market.
The S&P 500 hitting a new high doesn’t necessarily mean the broader market is doing well, or that your stocks are keeping pace. It’s also worth remembering that an S&P 500 ETF, such as TD US Equity Index ETF (TSX: TPU) that I have in Portfolio 3, has significant exposure to a handful of mega-cap companies, so its performance may not reflect how most individual stocks are doing.
With that in mind, let’s look at how the major indexes performed this week, what moved the markets, and how the three platforms performed this week.
Items that may only interest or educate me ….
Canadian Economic news, US Economic news, ….
Canadian Economic news
This past week’s key economic data that the Bank of Canada (BoC) considers when deciding whether to raise or lower the interest rate.
Labour Force Survey (LFS)
Statistics Canada’s September LFS delivered a much weaker result than expected. Employment fell for a second consecutive month, shedding 68,000 jobs after a revised loss of 42,000 in August. The combined decline of 110,000 has reversed many of the job gains recorded earlier in the year. Analysts had expected employment to increase by 9,200. Although employment remains 95,000 higher than a year ago, the recent reversal points to a weakening labour market.
The unemployment rate edged higher to 6.5% from 6.4% in August, as expected. However, the participation rate also fell to 64.8%, its lowest level since December 1997 outside the pandemic period. This measures the share of people aged 15 and older who are working or actively looking for work. When fewer people participate, the unemployment rate can understate labour-market weakness because those who stop looking for work are no longer counted as unemployed.
Average hourly wages rose 2.3% year over year, up from 2.0% in August. While that marks a modest acceleration, it doesn’t necessarily signal a broader wage-driven inflation problem.
Overall, this was a weak employment report, with two consecutive monthly declines painting a more concerning picture than the small increase in the unemployment rate alone suggests. For the BoC, the results strengthen the case for holding interest rates steady while BoC officials assess whether the weakness is temporary or part of a more persistent slowdown. The challenge is that a softer economy argues for caution on rates, while rising energy prices and continued wage growth could keep inflation elevated.
Canadian Market Volatility
Canada’s version of the market’s “fear gauge,” the S&P/TSX 60 VIX Index (VIXC), measures expected volatility in Canadian stocks over the next 30 days. Higher readings signal greater uncertainty, while lower readings suggest calmer market conditions.
The VIXC opened the week at 13.88, up from the previous week’s close of 13.12. It hovered between 13 and 13.5 for much of the week before briefly dipping below 10.5 as government bond yields eased. It then recovered modestly to finish at 11.19, well below where it started.
Overall, the VIXC pointed to relatively calm market expectations. Despite fluctuations in oil prices and bond yields, investors appeared less concerned about near-term volatility in Canadian stocks by the end of the week.
Note: The VIXC typically trades at lower levels than the VIX, partly because of the different makeup of the Canadian and US markets. The S&P 500 has a much larger weighting in technology, while the TSX has greater exposure to financials, energy, and materials. Because these sectors respond differently to economic conditions and commodity prices, the two indexes can have different levels of expected volatility.
US Economic news
This past week’s key data points that the Federal Reserve (Fed) considers when deciding whether to raise or lower the interest rate.
Federal Open Market Committee (FOMC) Minutes
The September 15 – 16 FOMC minutes were released this week and were more hawkish than the rate decision itself might have suggested.
While officials agreed that the economy remained relatively resilient, they were increasingly concerned that inflation was proving stubborn and had made little progress toward the Fed’s 2% target. Most officials felt another rate increase would likely be appropriate before the end of the year, although there was considerable debate over what was driving inflation and how much further the Fed needed to go.
Higher energy prices were a particular concern. Some officials viewed the increase as a temporary supply shock, while others worried that strong demand could keep inflation elevated. The minutes also highlighted a difficult balancing act: the labour market was showing signs of weakness, but the economy had not slowed enough to eliminate inflation concerns. Some officials felt interest rates were not yet restrictive enough to bring inflation down.
For investors, the message was fairly clear: the Fed still has more work to do on inflation. Although markets have become less convinced that another hike is coming soon, the minutes reinforce the possibility that rates could remain higher for longer, keeping pressure on Treasury yields and interest-rate-sensitive stocks.
Consumer Sentiment Index (CSI)
The University of Michigan’s preliminary CSI for October fell to 46.3 from 48.1 in September, missing analysts’ expectations of 47.8. That represents a 3.7% monthly decline, leaving consumer sentiment 13.6% below its level a year ago.
The weakness was concentrated in consumers’ assessment of current conditions. The Current Economic Conditions Index, which measures views of personal finances and buying conditions, dropped to 44.7 from 50.9 in September, a 12.2% monthly decline. It is now 23.7% lower than a year ago. By contrast, the Expectations Index, which reflects consumers’ outlook for the next six months, edged up to 47.3 from 46.3, although it remains 6.0% below its year-ago level.
The results suggest that consumers are feeling increasingly squeezed in the present, even as their expectations for the months ahead improve slightly. Persistent high prices and borrowing costs are making major purchases less affordable, potentially weighing on discretionary spending if household confidence continues to weaken. Inflation expectations also rose for a second consecutive month, adding to concerns about the cost of living and complicating the Fed’s efforts to bring inflation under control.
American Market Volatility
The VIX, often called the market’s “fear gauge,” measures expected volatility in the S&P 500 over the next 30 days. Higher readings signal greater uncertainty, while levels above 20 are typically associated with elevated volatility.
The VIX opened the week at 16.24, up from the previous Friday’s close of 15.31, and spent much of the week swinging between 15 and 16.3. It eased as concerns about oil supplies subsided, but rising government bond yields brought inflation worries back into focus. Lower oil prices then helped calm markets, only for renewed Middle East tensions to push the index above 16.45 late in the week. That spike proved short-lived, and the VIX retreated to close at 14.84, well down from where it started the week.
Despite the turbulence throughout the week, the VIX stayed below 20 throughout the week, suggesting expectations for near-term volatility remained relatively contained. Its brief surge showed how quickly geopolitical tensions, oil prices and inflation concerns can unsettle markets, but the retreat that followed left the index only slightly above its previous weekly close.
Weekly Market and Portfolio Review
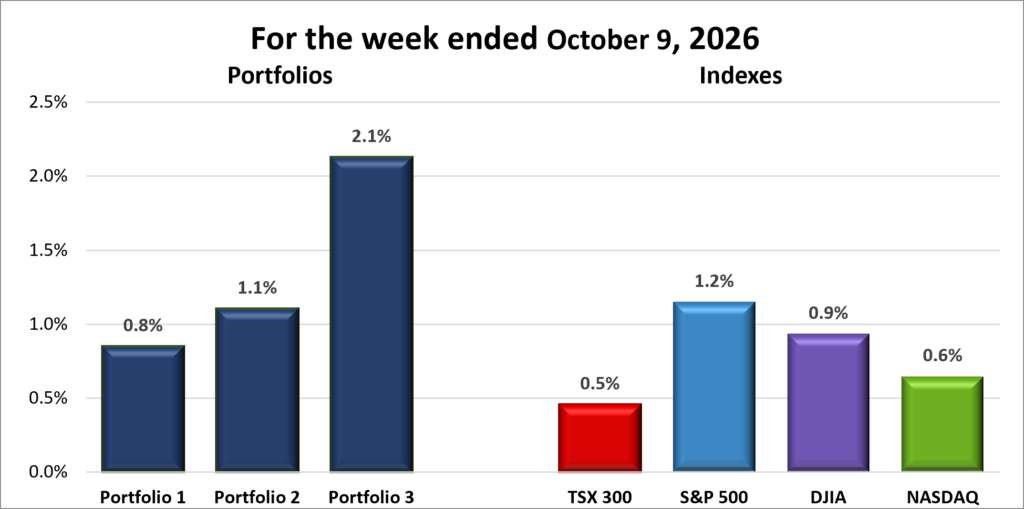
For the week, the TSX (SPTSX) gained 0.5%, the S&P 500 (SPX) jumped 1.2%, the DJIA (INDU) gained 0.9% and the Nasdaq (CCMP) advanced 0.6%.
| Index | Weekly Streak |
| TSX: | 1 – week winning streak |
| S&P: | 1 – week winning streak |
| DJIA: | 1 – week winning streak |
| Nasdaq: | 4 – week winning streak |
 The week got off to a hot start, with the Nasdaq Composite Index (Nasdaq) closing at record highs on Monday and Tuesday and the S&P 500 Index (S&P) setting a new record before markets cooled. The Toronto Stock Exchange Composite Index (TSX) and Dow Jones Industrial Average (DJIA) also started positively before turning lower midweek. A Friday rally, however, helped all four indexes finish the week higher despite considerable volatility.
US stocks initially benefited from optimism about AI’s earnings potential and expectations for another strong corporate earnings season. But the rally lost momentum as rising bond yields and doubts about the cost of AI investment challenged that optimism.
Rising oil prices and renewed pressure in the bond market were major headwinds. Uncertainty surrounding the Iran conflict, particularly when the global energy industry might return to normal operations, pushed Brent crude back above US$104 a barrel. This revived concerns that higher energy costs would keep inflation elevated and force the Fed to maintain the current interest rates or raise them further. On Monday, the 30-year Treasury yield climbed to 5.70%, while the 10-year yield reached 5.34%, both reportedly their highest levels since 2002. Higher yields increase borrowing costs and reduce the present value of future corporate earnings, putting pressure on stock prices. Although easing yields briefly supported Tuesday’s rally, that relief proved short-lived as oil prices and yields rebounded.
AI-related stocks also came under pressure late in the week as investors questioned whether enormous spending on AI infrastructure would generate sufficient returns. Reports about financing for OpenAI-related infrastructure raised concerns about growing reliance on debt, while questions about OpenAI’s revenue projections weighed on semiconductor stocks. Nvidia, Broadcom (NASDAQ: AVGO) and other chipmakers fell, dragging the Nasdaq lower. This didn’t mean demand for AI had suddenly disappeared, but it showed how sensitive investors have become to doubts about the profitability of the AI boom. On Friday, technology stocks recovered after Bloomberg reported that OpenAI expected annualized revenue to reach or exceed US$70 billion by year-end, driven largely by growth in its enterprise business. The report helped ease concerns about AI demand following the previous day’s sell-off.
In Canada, the TSX snapped two straight weekly losses, with a Friday rally lifting the index into positive territory for the week. Technology and some resource stocks provided early strength, although weakness in other major sectors weighed on the market through much of the week. Rising government bond yields added to borrowing-cost concerns for interest-sensitive stocks, while weakening gold and other precious metals contributed to a sharp Wednesday decline that sent the TSX to its lowest closing level since July. The index recovered on Thursday as rebounding oil prices lifted energy stocks, with Friday’s rally extending the gains. The week’s swings underscored the TSX’s sensitivity to commodity prices and changes in bond yields.
Ultimately, early optimism gave way to a more cautious mood as investors weighed the earnings potential of AI against rising energy costs, higher borrowing rates, and questions about the returns on AI investment. Friday’s rebound helped all four indexes finish higher, but the week’s volatility showed how quickly sentiment can shift when expectations collide with economic and financing pressures. Attention now turns to earnings season, which kicks off next week with results from major US banks.
| Portfolio | Weekly Streak |
| Portfolio 1: | 4 – week winning streak |
| Portfolio 2: | 1 – week winning streak |
| Portfolio 3: | 4 – week winning streak |
My three portfolios delivered a few surprises this week. Heading into Friday, none looked likely to finish in positive territory, but the technology rally propelled all three into the green. Even so, the results weren’t quite what I expected, particularly given how many holdings finished the week higher.
Portfolio 1 was a bit of a surprise, gaining just 0.8% despite all four major indexes finishing higher and strength across much of the technology sector. What made the modest gain more surprising was that 66% of its holdings posted a weekly gain. Several larger technology positions contributed positively, including Shopify (TSX: SHOP), which surged 12%, and CrowdStrike (NASDAQ: CRWD), which set a new high. Nvidia, however, proved a drag. After reaching a new closing high earlier in the week, it pulled back and finished down 2.6%, offsetting gains in many smaller positions. Navitas Semiconductor (NASDAQ: NVTS) added to the pressure, falling 13%.
Portfolio 2 also finished in the green, climbing 1.1%. With less exposure to technology, it seemed less likely to benefit from Friday’s rally as much as the other portfolios. So I was surprised to see it outperform the more growth-oriented Portfolio 1. Still, with 76% of its holdings posting a weekly gain, perhaps I shouldn’t have been so surprised. Aritzia (TSX: ATZ) was a standout, surging almost 18% after beating expectations for second-quarter revenue and profit. Unfortunately, the Bank of Nova Scotia (TSX: BNS), the portfolio’s largest holding, moved in the opposite direction. Without that drag, the week could have been even better. ☹
Portfolio 3 was the top performer, climbing 2.1%, even though just 53% of its holdings posted a weekly gain, the lowest proportion among the three portfolios. Shopify’s 12% surge provided a welcome boost, but Nvidia’s 2.6% decline limited the overall gain. This is the kind of weekly result I was hoping for when I leaned into the portfolio’s heavy technology and AI exposure. That said, I wouldn’t complain if the gains were even bigger! 😊
I found it interesting that the percentage of winning holdings didn’t determine which portfolio performed best. Portfolio 2 had the highest proportion of winners, yet Portfolio 3 delivered the strongest return despite having the lowest percentage of holdings posting a weekly gain. It’s a good reminder that overall performance depends not just on how many stocks rise, but on how much they contribute to the portfolio’s return.
With earnings season kicking off next week, I’m hoping the companies I own surpass expectations. But if a few big names stumble over the coming weeks, perhaps that will create some buying opportunities in companies on my radar or let me add to existing positions at more attractive prices. A little of both wouldn’t be so bad! 😊
Companies on the Radar
 This week, no new companies came across my radar, but a company that was previously on my list has made a return: Domino’s Pizza (NASDAQ: DPZ). It was on my radar at the end of 2024, but at the time I was more focused on higher-growth companies. After adding several high-growth names to the portfolios, I’m now looking more closely at stable, income-oriented companies that can provide some balance.
Domino’s fits that role well. The company has increased its dividend for more than 13 consecutive years and continues to deliver a high double-digit dividend growth rate. Even better, it uses less than half of its earnings to fund the dividend, leaving plenty of cash to reinvest in digital technology and store expansion, buy back shares, or pay down debt. That combination of dividend growth, financial flexibility, and a relatively stable business could make Domino’s a good counterbalance to the higher-growth companies already in the portfolios.
With that addition, my radar list now stands at six companies.
- Capital Power Corporation (TSX: CPX): A mid cap Canadian power producer that generates electricity from a mix of natural gas, wind, solar and battery storage across North America. With electricity demand rising rapidly from AI data centres, industrial growth and electrification, Capital Power is expanding its natural-gas generation while adding renewable and storage capacity. Its recent agreement to supply 250 MW of power to a new Meta data centre in Alberta for more than 10 years highlights how the AI boom is creating opportunities beyond the technology companies building the data centres themselves.
- Mattr Corp. (TSE: MATR): A small cap Canadian industrial technology company that designs and manufactures specialized infrastructure products using advanced materials. The company may not be familiar to most investors, but its products support industries such as energy, electrification, communications, transportation, and water management. From composite pipes and underground storage tanks to specialized wire and cable solutions, Mattr creates products designed to be lighter, more durable, and resistant to harsh environments. Think of it as a behind-the-scenes supplier helping modern infrastructure operate more safely and efficiently, generating revenue by selling specialized products to industrial customers around the world.
- S&P Global (NYSE: SPGI): A large cap American company and one of the world’s most important financial information companies. Most investors know it for the S&P 500 Index, but the business also provides credit ratings, market data, analytics, and research used by banks, corporations, governments, and investors worldwide. Think of it as one of the key information providers that helps global financial markets function, generating revenue through subscriptions, licensing fees, and rating services.
- Ingredion (NYSE: INGR): A mid-cap American ingredient manufacturer that turns plant-based raw materials into starches, sweeteners, fibres, and specialty ingredients used in thousands of everyday products. Its customers span food and beverage, animal nutrition, brewing, and industrial markets. With 10 consecutive years of dividend growth, Ingredion could provide an interesting counterbalance to the more growth-oriented companies in my portfolios.
- Emera Incorporated (TSX: EMA): A large cap Canadian energy company that owns regulated electric and natural gas utilities serving about 2.6 million customers across Canada, the US, and the Caribbean. Its utilities provide a relatively stable source of revenue while Emera invests billions in expanding and modernizing its power networks. With electricity demand expected to grow as AI data centres, industrial activity and electrification increase, Emera could benefit from the long-term need for more reliable power.
As always, these are not buy recommendations. Make sure to do your own research and choose investments that fit your personal financial goals.
The Radar Check was last updated October 9, 2026.


Portfolio Update
Portfolio 1
Sold: Carnival Corporation (NYSE: CCL) I invested in Carnival in April 2024 because the company looked undervalued and offered significant upside. Revenue, free cash flow, and net income were all trending higher, while excess cash was being used to pay down the debt that had piled up during the pandemic. At the time, I felt the potential reward justified the risk. Fast forward 18 months, and the stock is up 68%. Not a bad return. 😊
So, with the investment working out so well, why sell now?
The biggest concern is Carnival’s massive debt load, which stands at roughly US$22 billion. A significant portion of its cash flow goes toward interest and debt repayment, leaving less available for new ships, shareholder returns and future growth. It also makes the company more vulnerable if interest rates remain higher for longer or rise again.
The second concern is the age of Carnival’s fleet. Its ships are generally older than those operated by competitors such as Royal Caribbean, which means higher fuel, maintenance, and refurbishment costs. Carnival also doesn’t fully hedge its fuel costs, so a sharp increase in oil prices can put added pressure on profits.
None of this means I think Carnival is a bad company or that the stock can’t continue to rise. In fact, that’s what makes selling a little harder. But as I work toward reducing the number of companies in the portfolio, Carnival gave me an opportunity to lock in a sizable gain while reducing my exposure to a capital-intensive business carrying substantial debt. If the share price drops back into the mid-teens, I’ll take another look to see whether the stock has the potential to deliver the same kind of opportunity that attracted me in the first place.
I’ll put that freed-up cash into companies that better fit where I want the portfolio to go: businesses with strong competitive moats, minimal debt and consistent profit growth that can hold up across different economic environments.
Trimmed: Celsius Holdings (NASDAQ: CELH) I first invested in Celsius Holdings in August 2020, when the company was building its Celsius brand and had recently partnered with PepsiCo and Anheuser-Busch. I saw an opportunity to ride an emerging brand in a growing market. The strategy worked well for a while, with the stock climbing toward US$100 per share in May 2024. Since then, it has fallen to around US$25.
Celsius looks quite different today. Acquisitions of Alani Nu and Rockstar Energy have expanded its portfolio, giving it greater scale and access to more consumers. The combined brands held roughly 20% of the US energy drink market by dollar share in late 2025. However, managing three brands adds costs and complexity, and the challenge is turning that scale into sustainable growth and stronger profit margins.
PepsiCo’s (NASDAQ: PEP) distribution network helped Celsius expand rapidly into more stores, but future growth will depend increasingly on repeat purchases, new products, and further market penetration. Recent results highlight the challenge: Alani Nu continues to grow, but sales of the original Celsius brand have weakened, while higher promotional spending has pressured margins. The broader portfolio offers greater consumer appeal and bargaining power with retailers, but those benefits must outweigh the integration costs.
I considered selling my entire position but decided to keep a smaller stake to retain some exposure to the company’s long-term potential. Successful integration and a recovery in margins could offer meaningful upside, while international expansion provides another growth opportunity. Through partnerships with companies such as Suntory (OTCM: STBFY), Celsius is entering markets across Europe and the Asia-Pacific region. International sales remain a small part of the business, leaving room to grow, although meaningful profits will take time.
By trimming my position, I’ve reduced the portfolio’s exposure to Celsius while locking in some profits, though less than I would have liked given the stock’s decline from its peak. I’m leaving room for a recovery but would rather put some of that capital into other growth or income opportunities with a more attractive risk-reward profile.