
How Valuation Is Calculated (In Simple Terms)
Last week I introduced valuation. That’s great you say, but how do you actually determine a company’s valuation? This week I’ll walk through how investors put a number on it. There isn’t one exact formula, but a few common tools can help answer a simple question: how much am I paying for what this business produces?
One of the most widely used is the price-to-earnings (P/E) ratio. To calculate it, you take the company’s share price and divide it by its earnings per share.
Earnings per share (EPS) is the company’s total profit, or net income, divided by the number of shares outstanding.
Earnings per Share = Net Income ÷ Shares Outstanding
For example, if a company earns $5 billion and has 1 billion shares, its EPS would be $5. This figure is reported on a company’s income statement and is widely available on financial websites like the two I use – Fiscal.ai and Yahoo Finance.
If a stock trades at $100 and earns $5 per share, its P/E ratio is 20 – meaning you’re paying $20 for every $1 of profit.
The key question is whether that gap in valuation actually makes sense. A higher P/E usually means the market is expecting stronger future growth, while a lower one points to more modest, steady expectations. That’s why a name like Nvidia (NASD: NVDA), trading at a P/E of 40.6, often sits at a richer multiple compared to a more traditional, infrastructure-heavy business like CN Railway (TSE: CNR), which trades at 20.6. It’s the same idea playing out in real time: different growth profiles, different expectations.
Another useful way to look at valuation is through the price-to-free cash flow (P/FCF) ratio. The idea is similar to P/E, but instead of earnings, you’re looking at the actual cash the business generates.
To calculate free cash flow, you take the cash generated from operations and subtract the money reinvested back into the business:
Free Cash Flow = Cash from Operations – Capital Expenditures
You can find these numbers on a company’s cash flow statement. Divide free cash flow by the number of shares outstanding to get free cash flow per share. Most financial websites will calculate this for you.
If a company trades at $100 and generates $4 in free cash flow per share, its P/FCF ratio would be 25 – meaning you’re paying $25 for every $1 of cash the business produces.
Some investors prefer this metric because cash is harder to “adjust” than earnings and reflects what the company can actually use – whether that’s reinvesting, paying down debt, or returning capital to shareholders through dividends or buying back shares.
As with P/E, context matters. High-growth companies often trade at higher P/FCF ratios, while more mature businesses tend to sit lower. That’s why Nvidia has recently traded at a P/FCF of 23.7, reflecting expectations for continued strong growth, while CN Rail sits closer to 22, in line with its more stable, predictable cash flow profile.
When you step back, both of these follow the same basic idea.
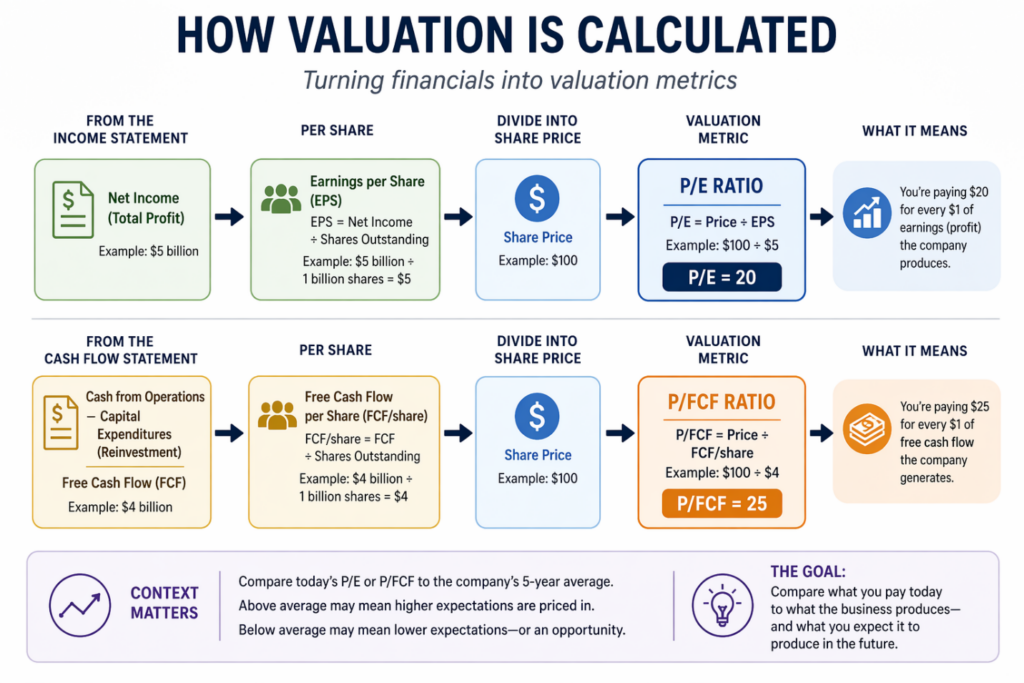 Another helpful way to put these numbers into context is to compare them to a company’s own history. A 5-year average P/E or P/FCF shows what investors have typically been willing to pay for that business.
You don’t need to calculate this from scratch. Platforms like Fiscal.ai and Yahoo Finance provide historical valuation data and averages, making it easy to see how valuation has changed over time.
If the current valuation is well above that range, it may suggest higher expectations are already priced in. If it’s below, expectations may be more modest – or the stock may be under pressure for a reason. The key is understanding why the difference exists, not just that it does.
Whether you’re using earnings or cash flow, the goal is the same: you’re comparing what you pay today to what the business produces – and what you expect it to produce in the future.
At the end of the day, valuation isn’t about finding a perfect number. It’s about building a framework for decision-making. The more growth that’s already priced in, the less room there is for things to go wrong – and that’s where risk starts to increase.
Valuation is a useful concept to keep in mind when evaluating companies and making investment decisions. With that as a backdrop, let’s take a look at how the week played out in the markets and across my three portfolios.
Items that may only interest or educate me ….
Canadian Economic news, US Economic news
Canadian Economic news
This past week’s key economic data that the Bank of Canada (BoC) considers when deciding whether to raise or lower the interest rate.
Consumer Price Index (CPI)
Statistics Canada’s March inflation report showed prices rising 0.9% month-over-month, the biggest monthly gain in over a year. That was slightly below expectations but still a sharp jump from February’s 0.5% increase. On an annual basis, inflation came in at 2.4%, also just under expectations and up from 1.8% previously.
Looking under the hood, gasoline prices drove the increase, surging 21.2% in March, the largest monthly gain across all categories. On an annual basis, gas prices were also among the biggest movers, rising 5.9% year-over-year. In contrast, household operations, furnishings, and equipment prices saw the biggest monthly decline, falling 0.9%, while footwear posted the largest annual drop, down 0.4%. Meanwhile, shelter costs – including rent and mortgages – continued to edge higher, rising 0.3% in March and 1.7% over the past year.
At first glance, that might suggest inflation is heating up again, but the why matters more than the number.
This was largely a story about energy – specifically gasoline. Higher oil prices, tied to geopolitical tensions and supply disruptions, pushed gas prices higher and had a ripple effect, since transportation is a meaningful part of the inflation basket. Food prices also continued to climb, while most other categories saw more modest moves or even declines.
That tells us this wasn’t a broad-based surge, but a concentrated increase driven by a few areas.
Core inflation helps confirm that. The BoC’s preferred measures, which strip out volatile items like food and energy, continue to show a relatively stable trend. Core inflation came in around 1.9% year-over-year. In other words, prices are still rising, but the pace is staying fairly steady and close to the Bank of Canada’s 2% target.
Put together, this looks less like inflation re-accelerating and more like a temporary bump from higher energy prices. With underlying inflation still near the BoC’s 2% target, this report is unlikely to change the current path for interest rates, even if we see some short-term volatility.
Retail Sales
Canadian consumers are still spending, but the pace is starting to cool. Retail sales rose 0.7% in February, down from a 1.1% gain in January and slightly below expectations of 0.9%. On a year-over-year basis, sales were up 3.8%, a noticeable step up from the 1.5% increase the month before.
Looking under the hood, the gains were fairly broad, with sales rising in seven of nine subsectors. On a monthly basis, general merchandise retailers led the way, with sales up 1.2%, while building material and garden supply stores saw the largest decline, falling 0.6%. Over the past year, spending has been strongest in areas like sporting goods and hobbies, up 8.5%, while bigger-ticket categories like furniture and electronics have lagged, with sales down 5.2%.
To get a clearer read on underlying demand, economists often look at core retail sales, which exclude vehicles and gasoline. These rose 0.6% in February, marking a second straight monthly increase and suggesting consumers are still spending at a steady pace. On an annual basis, core sales grew 3.8%, just below January’s 3.9%.
At first glance, the data points to resilience. But there’s an important nuance. Some of the growth is being driven by higher gasoline prices, which lift total sales in dollar terms without necessarily reflecting stronger demand. Strip that out, and the picture looks more balanced: consumers are still holding up, but not accelerating.
Early estimates point to another 0.6% increase in March, which would mark a solid three-month stretch of gains. The takeaway is fairly straightforward. The consumer remains resilient, but with prices doing more of the heavy lifting, there are early signs that momentum could slow if cost pressures continue to build.
Canadian Market Volatility
Canada’s version of the market “fear gauge” is the S&P/TSX Volatility Index (VIXC), often shown on trading platforms as VIXI.TO. Like the better-known CBOE Volatility Index in the US, it measures how much volatility investors expect in the Canadian stock market over the next 30 days.
The index opened the week at 17.86 as tensions between the US and Iran escalated following the seizure of an Iranian-flagged cargo vessel by the US Navy and a breakdown in peace talks between the two sides. The VIXC then drifted between 17 and 17.50 for most of the week before briefly jumping above 18 after reports that Iran was deploying additional mines in the Strait of Hormuz, pushing oil prices higher and raising supply concerns.
That spike was short-lived as the fear gauge eased back and finished the week at 16.97.
With the VIXC ending the week in the mid-teens and trending lower, it suggests investor anxiety is gradually cooling. It’s also worth noting that Canadian volatility tends to run lower than in the US, largely because the TSX is more heavily weighted toward financials, energy, and materials. These sectors typically see steadier price movements compared to the higher-growth technology names that dominate US markets.
US Economic news
This past week’s key data points that the Federal Reserve (Fed) considers when deciding whether to raise or lower the interest rate.
Retail Sales
The Census Bureau’s advance retail sales report showed spending rose 1.7% month-over-month in March, well above expectations of 1.4% and February’s 0.6% gain, marking the strongest increase in over a year. On a year-over-year basis, sales were up 4.0% versus 3.2% a year ago, suggesting consumers are still spending at a solid pace.
Looking under the surface, the picture was more uneven. Gas stations led the gains, with sales jumping 15.5% in March, while miscellaneous retailers saw a modest decline of 0.9%. On an annual basis, gas stations again stood out, up 18.1%, while motor vehicle and parts dealers were the weakest segment, down 2.1%.
To strip out some of the noise, core retail sales – which exclude autos and gasoline – rose 0.6% in March after being flat in February. That points to steady, but not particularly strong, underlying demand.
A meaningful part of the headline strength came from higher gas prices, which lift nominal sales without necessarily reflecting stronger real spending. Once that’s accounted for, the picture is more balanced: the consumer is still holding up, but higher essential costs may be starting to weigh on discretionary spending.
Consumer Sentiment Index (CSI)
The University of Michigan’s final reading of the Consumer Sentiment Index (CSI) for April came in at 49.8, up from the preliminary reading of 47.6 but down from 53.3 at the end of March and 4.6% lower than a year ago. While it came in slightly above expectations of 48, sentiment is still just above the preliminary reading that marked a record low, and below levels seen during both the 2008 financial crisis and the COVID-19 pandemic.
Drilling down, the Current Economic Conditions Index – which reflects how people feel about their finances and job security today – fell to 52.5, down 5.9% month over month and 12.2% lower than a year ago. Meanwhile, the Expectations Index, which looks six months ahead, dropped more sharply, falling 7.0% to 48.1. However, it was 1.7% higher than in April 2025, after the US disrupted the global trading order.
This latest reading comes against a backdrop of persistent inflation pressures. Inflation expectations have picked up again, with higher energy prices playing a key role, which tends to weigh heavily on sentiment since it directly affects day-to-day spending power. At the same time, ongoing geopolitical uncertainty and questions around interest rates are adding to the hesitation.
The takeaway is fairly straightforward. Consumers are still holding up for now, but confidence is weakening underneath the surface. If that continues, it could eventually translate into softer spending behaviour in the months ahead.
American Market Volatility
The CBOE Volatility Index (VIX), often called the market’s “fear gauge,” measures how much volatility investors expect over the next 30 days. In simple terms, it reflects how nervous or calm the market is feeling. Readings above 20 tend to signal rising uncertainty, while levels below 20 usually point to a more stable backdrop.
The VIX started the week at 19.61, up from the previous week’s close of 17.48, as geopolitical tensions flared after Iran re-closed the Strait of Hormuz, keeping peace talks in limbo. That marked the first daily increase after an eight-session decline.
From there, the index mostly hovered just above 19 for much of the week before briefly spiking above 21 after reports of Iran firing on ships attempting to transit the Strait. That move reflected a short burst of anxiety in the markets, as investors quickly reassessed risk in the region.
The spike didn’t last. The VIX eased back below 19 and eventually settled at 18.71 by the end of the week, suggesting that while tensions flared, they didn’t translate into sustained market fear.
Weekly Market and Portfolio Review
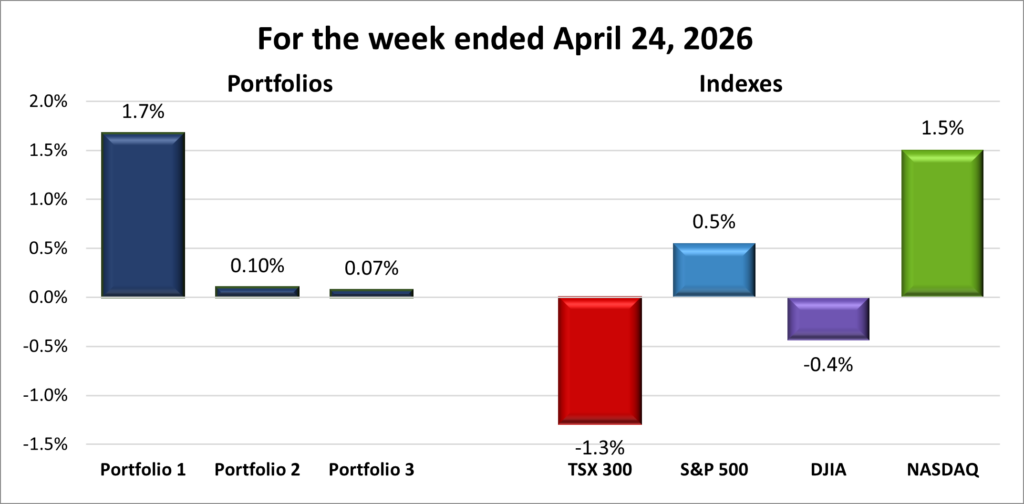
For the week, the TSX (SPTSX) fell 1.3%, the S&P 500 (SPX) rose 0.5%, the DJIA (INDU) slipped 0.4% and the Nasdaq (CCMP) surged 1.5%.
| Index | Weekly Streak |
| TSX: | 1 – week losing streak |
| S&P: | 4 – week winning streak |
| DJIA: | 1 – week losing streak |
| Nasdaq: | 4 – week winning streak |
![]()
![]() I knew this winning streak for all four major indexes couldn’t last. I just hoped it would last a little longer. Both the Toronto Stock Exchange Composite Index (TSX) and the Dow Jones Industrial Average (DJIA) spent most of the week in negative territory as they ended their respective win streaks. Meanwhile, the S&P 500 Index (S&P) and the Nasdaq Composite Index (Nasdaq) had more of a rollercoaster ride, setting record highs between down days before closing at fresh highs. The Nasdaq and S&P stretched their weekly win streak to four, their longest since the fourth quarter of 2024.
I knew this winning streak for all four major indexes couldn’t last. I just hoped it would last a little longer. Both the Toronto Stock Exchange Composite Index (TSX) and the Dow Jones Industrial Average (DJIA) spent most of the week in negative territory as they ended their respective win streaks. Meanwhile, the S&P 500 Index (S&P) and the Nasdaq Composite Index (Nasdaq) had more of a rollercoaster ride, setting record highs between down days before closing at fresh highs. The Nasdaq and S&P stretched their weekly win streak to four, their longest since the fourth quarter of 2024.
Once again, the conflict in the Middle East set the tone. US-Iran tensions flared early in the week, putting peace talks at risk and leading to the closure of the Strait of Hormuz. That disrupted shipping flows and pushed oil prices higher. President Trump initially signalled he was unlikely to extend the ceasefire in the US-Israel conflict with Iran, set to expire on April 21. That raised concerns for investors, since higher energy prices can feed into inflation and influence interest rate expectations. Volatility spiked as investors pulled back on risk. A day later, after markets closed, he reversed course and announced an indefinite extension, helping stabilize sentiment. The week ended more optimistically, with reports suggesting US and Iran will resume peace talks over the weekend.
Oil price swings then added to the story. When crude jumped on supply concerns, energy stocks offered some support, particularly in resource-heavy areas like the DJIA. At the same time, higher oil prices weighed on sentiment more broadly, especially for growth stocks sensitive to inflation and interest rates. In simple terms, higher energy costs kept pressure on the economic outlook.
Earnings helped steady markets early in the week. Strength in large-cap technology and AI-related companies supported the S&P and Nasdaq, as investors stayed focused on long-term growth despite short-term economic headlines. That helped cushion downside during volatile stretches.
Towards the end of the week, though, a familiar theme returned. IBM (NYSE: IBM) reported solid results, but cautious guidance and slower software growth raised fresh questions about its ability to keep pace in an increasingly AI-driven landscape. Just like that, concerns about AI disruption were back on the radar, like a movie villain that refuses to die. 😊
Those concerns didn’t last long. A stronger-than-expected revenue forecast from chipmaker Intel (NASD: INTC) lifted semiconductor stocks and quickly shifted sentiment back toward optimism around the AI industry.
While US markets were pulled in multiple directions, the TSX faced a more persistent drag throughout the week.
A key driver was weakness in financials, which carry significant weight on the TSX. Banks came under pressure as investors grew more cautious about the economic outlook. In simple terms, banks tend to perform best when the economy is steady and borrowing is growing. When higher costs threaten that, investors worry loan growth and profits could slow. Because financials make up a large portion of the TSX, even modest declines had an outsized impact.
Basic materials added further softness. This sector is closely tied to commodity prices like metals and minerals. When prices are rising, miners benefit. When they’re flat or mixed, as this week, it creates uncertainty around future profits and limits upside.
Energy provided some strength, benefiting from higher oil prices earlier in the week, which helped limit downside. But it wasn’t enough to offset pressure from financials and materials.
Overall, the TSX and DJIA spent most of the week on the back foot. With heavier exposure to financials and commodities, they lacked the same support from high-growth technology that helped lift the S&P and Nasdaq.
Looking ahead, attention shifts to central banks, with both the BoC and the Fed set to announce rate decisions next week. No surprises are expected, but the tone will matter just as much as the decision itself. Earnings season also continues, with several Magnificent 7 companies set to report. Given their influence on index direction right now, even small surprises can have an outsized impact on how markets head into the next stretch — hopefully to the upside. 😊
| Portfolio | Weekly Streak |
| Portfolio 1: | 4 – week winning streak |
| Portfolio 2: | 4 – week winning streak |
| Portfolio 3: | 4 – week winning streak |
![]() Based on how the week started, I expected all three winning streaks to come to an end. In fact, all three portfolios had fewer than half of their holdings post a weekly gain. That’s what made it such a pleasant surprise to see all three still manage to extend their streaks for another week. A big part of that resilience came from a shift back into technology, with the semiconductor space in particular regaining momentum and providing a tailwind for my more tech-heavy portfolios.
Based on how the week started, I expected all three winning streaks to come to an end. In fact, all three portfolios had fewer than half of their holdings post a weekly gain. That’s what made it such a pleasant surprise to see all three still manage to extend their streaks for another week. A big part of that resilience came from a shift back into technology, with the semiconductor space in particular regaining momentum and providing a tailwind for my more tech-heavy portfolios.
That semiconductor rally showed up clearly in Nvidia, which hit another record high and rose over 3% on the week, pushing its market cap back above US$5 trillion – roughly US$1 trillion ahead of Alphabet (NASD: GOOGL), the second most valuable company. As the largest holding in Portfolios 1 and 3, that move provided a meaningful lift. 😊
Portfolio 1 was the top performer, gaining 1.7% on the week. What made that more impressive was that it came despite less than half the holdings moving higher. A handful of standout performers did the heavy lifting, including Navitas Semiconductor (NASD: NVTS), which surged 43%, and Hammond Power Solutions (TSE: HPS.A), up 21%. Along with Nvidia’s record high, the portfolio also saw Celestica (TSE: CLS), Amazon (NASD: AMZN), Lattice Semiconductors (NASD: LSCC), and Arista Networks (NYSE: ANET) reach record highs.
There was also some notable company-specific news. Apple (NASD: AAPL) announced that CEO Tim Cook will step down after 15 years in the role, transitioning to Executive Chairman of the Board. This means he will remain actively involved in the company, likely focusing on strategy, relationships, and broader initiatives rather than day-to-day operations. He will be succeeded by John Ternus, Apple’s head of hardware engineering, starting September 1.
Portfolio 2 had the fewest winners, with just 37% of holdings finishing higher, but still managed to post a small 0.1% gain. Strength in energy, the strong showing from Hammond Power Solutions, and a record high from Aritzia (TSE: ATZ) were enough to keep the streak alive, even if just barely.
Portfolio 3, had an even smaller weekly gain, edging out a 0.07% increase. Like the others, it saw fewer than half of its holdings move higher, with only 47% finishing in the green. However, strength from Vertiv Holdings (NYSE: VRT), which hit a record high, along with Nvidia’s advance, was just enough to push the portfolio into positive territory.
Overall, it was one of those weeks that doesn’t quite look right at first glance. Breadth was weak across all three portfolios, but a handful of strong performers still managed to carry everything higher. It’s a good reminder that sometimes it only takes a few winners to move the needle, especially when they’re among your larger holdings. 😊
Looking ahead, next week could bring a fair bit of volatility, with five of the Magnificent 7 set to report earnings, including four held across the three portfolios. While there may be some noise around AI spending and disruption, strong results could go a long way in reinforcing confidence and keeping the current momentum intact – and potentially setting a positive tone for the next stretch. Most importantly, keeping those weekly winning streaks alive. 😊
Companies on the Radar
 It was another relatively quiet week for my radar list, with no new companies making an appearance. That said, I was able to trim the list during the early-week market pullback, picking up 5N Plus Inc. (TSX: VNP) and GE Aerospace (NYSE: GE) after they fell to levels I was comfortable buying at.
5N Plus is the small-cap Canadian company that produces ultra-pure materials at a scale that meets rigorous aerospace and medical standards, while GE Aerospace is a large-cap US aviation and defence company formed following the breakup of General Electric in 2024 (see Portfolio Updates below).
With 5N Plus and GE Aerospace now moved into Portfolio 3, my radar list is down to two companies:
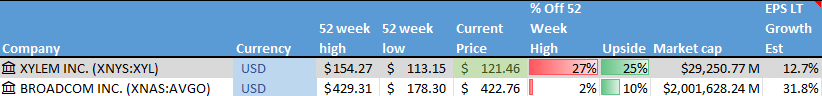
- Broadcom (NASD: AVGO): A large cap American company that sells semiconductors and software globally. It designs critical chips used in data centres, networking equipment, and broadband infrastructure, playing a behind-the-scenes role in cloud computing and AI. Broadcom also owns a growing enterprise software business following its acquisition of VMware, giving it exposure to both hardware and software spending tied to AI and cloud growth.
- Xylem Inc. (NYSE: XYL): This is a large American company that develops water technology focused on moving, treating, and managing water. Its products and services are used by utilities, industrial customers, and municipalities for everything from clean drinking water and wastewater treatment to flood control and leak detection. With aging water infrastructure and more frequent climate challenges like droughts and flooding, demand for Xylem’s solutions is still strong. The business offers exposure to long-term, essential infrastructure spending tied to water scarcity, sustainability, and smarter cities.
As always, these are not buy recommendations. Make sure to do your own research and choose investments that fit your personal financial goals.
The Radar Check was last updated April 24, 2026.

Portfolio Update
Portfolio 1
Bought: Kraken Robotics (TSEV: PNG) I made my first purchase in January 2025. Since then, the share price has increased by around 330%, which naturally caught my attention – especially for a small-cap company with a long runway for growth.
Kraken builds technology that helps people “see” and operate underwater. That includes advanced sonar systems, underwater robots, and equipment used to map the ocean floor. Most of this is used in defence, offshore energy, and marine exploration – industries that are all seeing strong structural growth.
Governments are increasing spending on maritime security as underwater infrastructure like communication cables and pipelines becomes more critical and exposed. At the same time, offshore energy and ocean mapping are shifting toward autonomous systems instead of traditional, labour-heavy methods. Kraken is positioned right in the middle of that transition.
From a financial perspective, the business has been scaling well. Revenue has grown strongly in recent years, reaching roughly the $100 million level annually. Gross margins have also held up well at around 50%+, which points to solid pricing power for a specialized technology company. Earnings have recently turned positive on a quarterly basis, although they remain modest and can swing with contract timing. Free cash flow is still negative as the company continues to reinvest heavily into growth and capacity. In short, Kraken is still in a reinvestment phase – growing quickly and improving profitability, but not yet consistently generating cash.
That said, I don’t expect growth to be smooth. Revenues tend to come in waves rather than a steady stream each quarter, which can lead to uneven results and share price volatility depending on contract timing and defence spending cycles.
In Kraken’s case, I’m not focused on perfectly steady growth. I see it as a strong long-term opportunity, which has already played out over the past 14 months, with still plenty of runway ahead. Hopefully, that momentum can continue for years to come 😊
Portfolio 3
With the cash from the partial sale of my NVIDIA position the previous week, I’ve put that capital back to work – adding to my position in Microsoft while also starting new positions in 5N Plus and GE Aerospace.
Bought: Microsoft (NASD: MSFT) This marks my fourth investment in Microsoft – two in Portfolio 2 and now a second in Portfolio 3.
Microsoft is a high-quality, cash-generating business with a strong mix of software, cloud, and enterprise services. Its products are used by millions of individuals and businesses every day, and it continues to build on that foundation through growth in cloud computing and, more recently, artificial intelligence (AI). By combining its cloud infrastructure with AI tools and integrations across its ecosystem, Microsoft is deepening its role within its customers’ operations.
While its days of explosive growth may be behind it, Microsoft offers something just as valuable – consistent growth, strong cash flow, a growing dividend, and exposure to long-term trends like cloud computing and AI.
The recent pullback – driven by concerns around AI spending and potential disruption – created an opportunity to add to my position. While those concerns are worth watching, they don’t change the bigger picture. If anything, they highlight how early we are in the AI cycle and how much investment is still flowing into the space.
Microsoft continues to execute at a high level while still having meaningful growth opportunities ahead. It has performed well since my first investment in August 2018, and I’m confident it can continue to be a leader as the world adopts AI and other emerging technologies.
Bought: 5N Plus (TSX: VNP) I’ve had my eye on 5N Plus for a few weeks, waiting for an opportunity to become an owner of this smaller-cap Canadian company. Founded in 2000, 5N Plus produces specialty semiconductors and performance materials by purifying non-ferrous metals to “five nines” (99.999%) purity or higher. These ultra-pure materials are used in areas such as space-based solar power, medical imaging, and renewable energy.
What makes the business interesting is that it operates as a critical upstream supplier. Its materials are used in highly specialised applications – from satellite solar panels to medical imaging equipment – where performance and reliability matter far more than cost. Because of that, customers rely on 5N Plus as one of the few companies globally capable of producing these materials at scale and to strict technical standards.
More recently, the business has started to show stronger momentum. Revenue has been growing steadily, reaching record levels in 2025, driven by higher demand across its key end markets. Importantly, this growth has also been supported by improving margins and stronger profitability as the company benefits from scale and better pricing.
At the same time, it is still a relatively small and less widely followed company compared to larger industrial and technology names. That combination – steady growth, improving financials, and limited market attention – helps explain why the opportunity is interesting at this stage.
That said, it does come with risks. One of the key risks is customer concentration and technology dependence. A meaningful portion of demand comes from a small number of large customers in areas like solar and aerospace. If one of these customers – such as a major solar manufacturer – shifted to a different material technology or brought more production in-house, it could significantly reduce demand for 5N Plus’s products. In simple terms, the risk isn’t just cyclical demand, but structural change driven by evolving technologies and customer strategies.
There is also exposure to critical raw materials such as tellurium and gallium, which are sourced globally and concentrated in a limited number of regions. Any export restrictions or supply disruptions – particularly from key producing countries – could increase costs or constrain production, putting pressure on margins and flexibility.
As a small-cap company, there is also added volatility. Results can vary depending on order timing and end-market demand, meaning performance won’t always be smooth from quarter to quarter.
Despite these risks, I felt the opportunity outweighed them. I see 5N Plus as a “Growth at a Reasonable Price” (GARP)-style investment, offering exposure to long-term growth themes in clean energy and advanced technologies, supported by steady demand from its industrial customer base. It’s a business tied to real-world infrastructure and technology trends rather than fast-moving or speculative cycles. The recent market pullback provided an opportunity to become a (very small) minority owner at a price I was comfortable with. 😊
Bought: GE Aerospace (NYSE: GE) GE Aerospace is another company that had been on my radar for quite some time – going back to late October 2025. The recent market pullback, driven by rising geopolitical tensions in the Middle East that pushed oil prices higher and weighed on investor sentiment, created an opportunity to become an owner of one of the world’s leading aerospace companies.
GE Aerospace is a leading provider of jet engines, components, and integrated systems for both commercial and military aircraft. Following the breakup of General Electric in April 2024, it has emerged as a focused, pure-play aviation business. Its model is simple but powerful: it sells advanced jet engines to secure decades of high-margin maintenance, repair, and overhaul work. In other words, it doesn’t just sell engines – it builds long-term relationships that generate recurring revenue over their lifespan.
The scale of the business is hard to ignore. GE Aerospace powers a significant portion of global air travel, with an installed base of more than 44,000 commercial engines. Once an engine is in service, it requires ongoing maintenance, replacement parts, and servicing – creating a durable stream of revenue that grows alongside global flight activity.
More recently, the business has been showing strong momentum. As global travel continues to recover and expand, flight hours are increasing, which directly drives demand for servicing. At the same time, supply constraints across the aerospace industry have limited the production of new aircraft, keeping older fleets in service longer and further supporting its higher-margin services business.
The company has also become more focused following its separation from General Electric. With a clearer structure and strategy, management can concentrate on its core aviation business, improve efficiency, and allocate capital more effectively.
As with all investments, there are risks to be aware of. The aerospace industry is cyclical, and demand for air travel can be affected by economic slowdowns, geopolitical events, or changes in consumer behaviour. Any decline in flight activity would reduce demand for services.
There is also exposure to supply chain challenges. The company relies on a complex network of suppliers for highly specialised components, and disruptions or quality issues could delay engine deliveries or increase costs.
In addition, while long-term service agreements provide stability, they depend on the financial health of airline customers. If airlines face pressure, it could impact service revenue or contract terms.
Despite these risks, I felt the opportunity outweighed them. GE Aerospace offers exposure to long-term growth in global air travel, supported by a business model built on recurring, high-margin revenue. It’s a company tied to real-world demand and infrastructure, with growth driven by increasing global mobility rather than short-term trends.
As Warren Buffett has said, “It’s far better to buy a wonderful company at a fair price than a fair company at a wonderful price.” This felt like one of those opportunities. Adding a “blue-chip” industrial titan with a massive competitive moat and reliable recurring revenue also provides some diversification and stability to an otherwise technology heavy portfolio.
That’s a wrap for this week, thanks for reading – may your portfolio stay green and your dividends steady. See you next time!