
With the start of another earnings season, I thought it’d be a great time to talk about earnings reports. These reports can seem a bit intimidating, but they’re one of the most important tools for assessing how a company is performing.
Understanding Earnings Reports: What New Investors Should Know
Earnings reports are like a company’s report card, showing how well they’ve performed over a specific period – usually a quarter or a year. They provide key details like revenue, profits, expenses, and earnings per share (EPS), helping investors gauge how a business is doing. For example, steadily growing revenue signals a thriving business, while shrinking profits may raise concerns. Earnings reports also offer management insights about the industry and plans for the future, giving a clearer picture of what’s ahead.
One critical aspect of earnings reports is how they stack up against expectations. Companies provide guidance and analysts make predictions. If actual results beat these forecasts, it’s often good news for the stock. But missing expectations can trigger a sell-off as investors worry about underlying issues. These reports also help calculate valuation metrics like the price-to-earnings (P/E) ratio, making it easier to decide if a stock is overpriced or a potential bargain.
Earnings reports don’t just affect individual stocks—they can influence entire markets. For instance, if a major player like Nvidia (NASD: NVDA) posts strong results, it could lift the technology sector as a whole. On the flip side, weak results from a market leader can drag down related industries. Forward-looking guidance is equally important; even if a company meets expectations, weak forecasts can weigh on its stock, while an optimistic outlook can boost confidence and prices.
Key Elements of an Earnings Report
- Revenue: Often called the “top line,” this is the total money the company made during the period. Higher-than-expected revenue is a positive sign, while missing expectations could signal slowing growth or weak demand.
- Earnings Per Share: This metric shows how much profit the company earns per share. Beating EPS expectations often drives stock prices up, while missing them can lead to declines.
- Guidance: A forward-looking statement outlining the company’s expectations for future earnings and revenue. Strong guidance can boost investor confidence, while weak forecasts may raise concerns.
- Net Income: Known as the “bottom line,” this is what’s left after expenses are deducted from revenue. Growing net income signals efficient cost management and a healthy business.
- Margins: These measure how much profit is kept after expenses. Increasing margins suggest improved efficiency, while shrinking margins may signal rising costs or slowing demand.
Key Takeaway
When it’s earnings season, don’t worry about reading every detail of the report—focus on the big picture. Look for key takeaways like revenue growth, EPS, and the company’s guidance for the future. These highlights can give you a quick sense of how a business is doing and what might come next. Even if you’re not digging into the fine print, pay attention to how the market reacts. Big surprises—good or bad—can create risks or opportunities that might affect your investments.
So, the next time a company you own makes headlines during earnings season, take a moment to see what’s driving the buzz. It’s a simple way to stay informed about your portfolio and maybe even discover where the market is headed! 😊
Strong earnings reports were a key driver of the markets’ performance throughout 2024. As we kick off another earnings season, the big question is whether this strength will continue to lift the markets in the weeks ahead. For now, let’s take a look back at what shaped the past week….
Items that may only interest or educate me ….
Changes, Canadian Economic news, US Economic news,
Changes to Weekly Updates
Before diving into the always-exciting economic news and updates, you may have noticed a few changes in last week’s ‘Weekly Update.’ After some thought, I’ve made tweaks to make the posts shorter and more enjoyable to read.
First, I’ve decided to drop the ‘Weekly Market Review’ section. While it offered a quick recap of daily market movements, there are plenty of resources out there that provide more details. My focus is to provide content that’s insightful and adds value rather than just rehashing headlines.
Second, I’ve shifted the grammar and spell-checking style to a more casual tone. You’ll notice this most in the use of contractions, like “I’ve” instead of “I have.” The goal is to make the updates flow better, feel more natural, and align with the relaxed and conversational tone I aim for here.
With these tweaks, I’m hoping to keep delivering updates that are both informative and a little easier to read. Let me know what you think – I’m always open to feedback! 😊
Canadian Economic news
This past week’s key economic data that the Bank of Canada (BoC) considers when deciding whether to raise or lower the interest rate.
End of Quantitative Tightening
The Bank of Canada (BoC) recently announced that its quantitative tightening (QT) program will conclude in the first half of this year. This shift allows the bank to resume normal bond purchases and maintain an appropriate level of settlement balances. A well-managed settlement balance provides the BoC with flexibility to inject money into the economy during times of economic crisis. The BoC is among the first central banks globally to halt the unwinding of pandemic-era asset purchases.
If you’re new to investing, even if you’re not, QT might sound complicated, but it’s essentially a way for the central bank to reduce the amount of money circulating in the economy. Let’s use an analogy to explain QT.
Imagine the economy is a garden, and money is the water. During QT, the BoC is like a gardener turning the faucet tighter and tighter to reduce the water flow. This helps control inflation but can also slow economic growth.
When QT ends, it doesn’t mean the faucet is turned back on. Instead, the tightening stops, and the flow of money remains steady. If the BoC were to switch to quantitative easing (QE), that’s when the faucet would turn back on, allowing more money to flow into the economy.
In simpler terms:
- Ending QT: Stops reducing the flow of money but doesn’t add more.
- QE: Actively increases the flow of money, like turning the faucet back on.
For us investors, this distinction is key. Ending QT can stabilize financial conditions, which is good news, but it doesn’t mean the economy is getting an extra boost – at least not yet. 😊
Canadian market volatility
Canada’s Volatility Index (VIXC) had a steady week, starting at 12.73 and edging up to close at 13.63, reflecting a modest uptick in investor uncertainty.
Listed as VIXI on the Toronto Stock Exchange (TSE), the VIXC gauges market sentiment by measuring expected volatility. A reading below 10 points to calm and stability, while levels between 10 and 20 suggest moderate, typical market fluctuations. When the index climbs above 20, it signals growing uncertainty and the likelihood of a more turbulent market environment. For now, the VIXC remains comfortably within the range of typical market movements, suggesting investors aren’t overly anxious at this time.
US Economic news
This past week’s key data points that the Federal Reserve (Fed) considers when deciding whether to raise or lower the interest rate.
Consumer Price Index (CPI)
The latest CPI report from the Labor Department shows that prices are still on the rise, though there’s a slight twist in the tale. December’s CPI went up by 0.4%, a touch higher than November’s 0.3% and a bit more than what experts predicted. On a yearly basis, the CPI climbed by 2.9%, following a 2.7% rise in November.
On a monthly basis, the prices of ‘Gasoline’ and ‘Fuel oil’ were the big drivers of inflation for the month, each shooting up by 4.4%. On the flip side, the price for ‘Medical care commodities’ was the only category to not post an increase, coming in flat after four months of declines.
Year-over-year, ‘Transportation services’ continued to see the biggest jump, up by 7.3%. Meanwhile, ‘Fuel oil’ prices saw the steepest decline in prices, falling by 13.1%.
On the housing front, ‘Shelter’ costs inched up by 0.3% in December, mirroring November’s pace. Annually, the rate of shelter costs slowed slightly, rising by 4.6%, down from 4.7% the previous month.
This is where the twist comes in. Excluding the more volatile food and energy prices, the Core CPI rose, but at a slower pace of 0.2% in December, compared to 0.3% in the prior four months. Over the year, Core CPI grew by 3.2%, the first time since July that core CPI has slowed just a tad lower than November’s 3.3%.
The monthly and annual rise in December’s headline, or all-items, CPI suggests that inflationary pressures persist. However, the slower increases in Core CPI show that while underlying inflation is cooling, it remains elevated. Analysts expect the Fed to hold the US benchmark interest rate at 4.5% at heir next meeting on January 28 – 29, giving them time to analyze incoming data and the potential impact of President Trump’s proposed regulations.
Retail Sales
The latest retail sales data from the US Census Bureau showed that consumer spending grew in December, though not as much as expected. Retail sales rose 0.4% for the month, falling short of the anticipated 0.6% and down from the upwardly revised 0.8% increase in November. On an annual basis, however, retail sales climbed 3.9%, improving on November’s 2.9% growth and slightly exceeding forecasts of 3.8%.
The strongest monthly growth came from ‘Miscellaneous store retailers,’ with a 4.3% jump in sales. At the other end of the spectrum, ‘Building material & garden equipment & supplies dealers’ saw a 2.0% decline. Looking at yearly changes, ‘Auto & other motor vehicle dealers’ led the pack with an 8.8% increase, while ‘Building material & garden equipment & supplies dealers’ posted the steepest decline, dropping 1.8%.
Core retail sales – which strip out the more volatile categories like motor vehicles, parts, and gasoline stations – rose 0.3% in December, topping the expected 0.2% increase and improving on November’s modest 0.1% growth. Annually, core sales were up 3.3%, below November’s 3.8% and the forecast of 3.9%.
These figures highlight the resilience of American consumers, who continue to spend despite rising prices and higher interest rates. Strong job growth and rising wages have sustained upward momentum in retail spending, helping to support the broader economy. This steady growth explains the Fed’s cautious approach to cutting interest rates, as robust consumer spending remains a key driver of economic growth. The rise in retail sales reflects continuing consumer confidence and a solid economic foundation.
American market volatility
The CBOE Volatility Index (VIX), known as the market’s “fear gauge,” started the week at a jittery 21.18, reflecting heightened investor anxiety. However, it steadily eased, ending at 15.97 after relatively upbeat CPI inflation data calmed the markets.
For those new to the VIX, it measures expected market volatility over the next 30 days. A reading below 12 suggests calm and stability, while 12 to 20 signals typical market fluctuations. When the VIX climbs into the 20-30 range, it points to rising investor unease, and anything above 30 signals significant stress, often hinting at major market turbulence or even a crisis.
Weekly Market and Portfolio Review
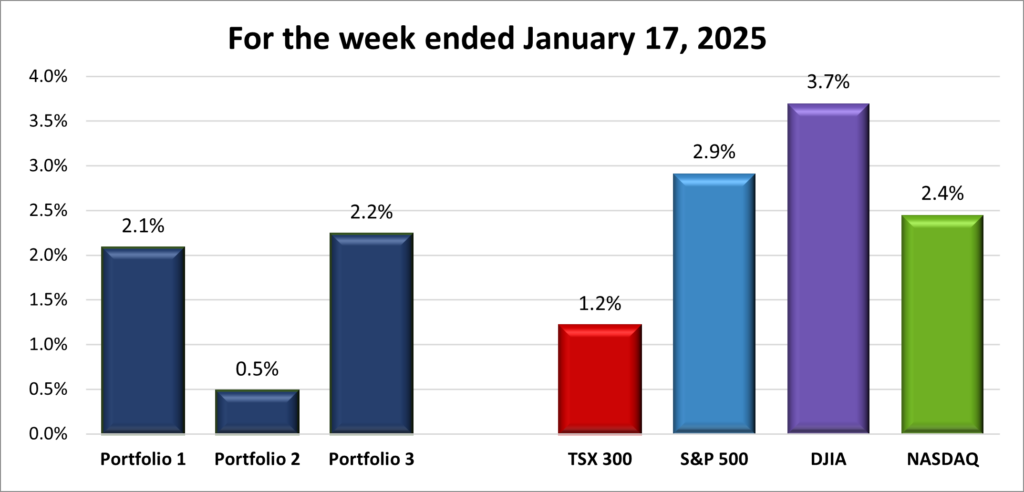
For the week, the TSX (SPTSX) rose 1.2%, the S&P 500 (SPX) gained 2.9%, the DJIA (INDU) surged 3.7% and the Nasdaq (CCMP) advanced 2.4%.
| Index | Weekly Streak |
| TSX: | 1 – week winning streak |
| S&P: | 1 – week winning streak |
| DJIA: | 1 – week winning streak |
| Nasdaq: | 1 – week winning streak |
![]() The week started on shaky ground, but better-than-expected US inflation data midweek turned the tide, propelling all four major indexes higher, as shown in the chart above.
The week started on shaky ground, but better-than-expected US inflation data midweek turned the tide, propelling all four major indexes higher, as shown in the chart above.
After a slow start to 2025, the Nasdaq Composite Index (Nasdaq) and S&P 500 Index (S&P) finally climbed into positive territory this past week with year-to-date gains of 1.8% and 2.2%, respectively. Technology stocks, which seemed stuck in a rut earlier this year, found renewed strength, helping lift these indexes. The Dow Jones Industrial Average (DJIA) has so far outpaced them with a 2.6% year-to-date gain. This marked the best week since early November for the S&P and DJIA, while the Nasdaq had its best performance since December.
Markets turned optimistic following the inflation data and strong earnings reports from several major US banks. This newfound confidence has sparked investor speculation about potential rate cuts later this year. However, uncertainty persists, especially regarding the potential impact of tariffs under President-elect Donald Trump’s administration. These tariffs will increase the cost of products and could cause inflation to rise, with Canada likely to bear the brunt of the fallout. Opinions are divided on how much strain American consumers and businesses might face.
In Canada, the Toronto Stock Exchange Composite Index (TSX) followed a slightly different path. It started the week on the wrong foot but gradually gained traction to post a modest weekly increase, pushing its year-to-date gain to 0.6%. Still, concerns over Trump’s threats to impose 25% tariffs on Canadian goods weighed on Canadian stocks, adding an extra layer of uncertainty to the country’s economic outlook.
Looking ahead, investors on both sides of the border are preparing for President Trump’s inauguration next week. His promises to lower taxes and cut regulations, along with threats of tariffs on Canada and other trading partners, are expected to stir market volatility. These actions could significantly impact the markets in the weeks to come. It’s shaping up to be an exciting week. 😊
| Portfolio | Weekly Streak |
| Portfolio 1: | 1 – week winning streak |
| Portfolio 2: | 1 – week winning streak |
| Portfolio 3: | 1 – week winning streak |
![]() After starting the year on shaky ground, the tide turned this week as all three portfolios rallied back into positive territory, buoyed by a market rebound driven by better-than-expected inflation data.
After starting the year on shaky ground, the tide turned this week as all three portfolios rallied back into positive territory, buoyed by a market rebound driven by better-than-expected inflation data.
Portfolio 1 came in a close second in terms of percentage gain thanks to an impressive 89% of its holdings ending in the green. While its weekly percentage gain wasn’t the highest among the three portfolios, strong showings from Celestica (TSE: CLS), up 16%, PayPal (NASD: PYPL), up 12%, and Sea Limited (NYSE: SE), up 10%, provided a significant boost. And, most importantly, Nvidia – making up nearly 40% of the portfolio’s value – also posted a gain, helping solidify the portfolio’s positive performance.
Portfolio 2 had the smallest weekly gain, with 74% of its holdings posting positive results. Normally, having 74% of holdings post a weekly gain would be considered impressive, but this time, it was eclipsed by both of the other portfolios. In a reversal from last week, oil and gas stocks—previously cushioning losses—acted as a drag, limiting the portfolio’s overall recovery.
Portfolio 3 stole the spotlight with the largest percentage growth, supported by 86% of its holdings finishing higher. Leading the charge were Lithium Americas (TSE: LAC), up 14%, Telus Digital (TSE: TIXT), up 11%, and Vertiv Holdings (NYSE: VRT), also up 11%.
With the tide turning in our favour, all three portfolios sailed into calmer waters, buoyed by the market’s renewed momentum. While choppy seas may still lie ahead, here’s to fair winds and following seas to continue driving the portfolios higher! 😊
Companies on the Radar
 My radar list got a bit leaner this week as two companies found new homes in my portfolios. Kraken Robotics Inc. (TSE: PNG) joined Portfolio 1, while Evolution AB (OTCM: EVVTY) was added to Portfolio 3. On the flip side, I removed Kyndryl Holdings, Inc. (NYSE: KD), the IBM IT infrastructure services spin-off. Although Kyndryl has made progress in narrowing its losses, declining revenues since 2021 and an ongoing lack of profitability remain concerns. More critically, its lack of a strong competitive moat in both its consulting arm and managed services division leaves it vulnerable to rivals. As an IBM spinoff, it has potential, but it doesn’t offer the level of growth I’m looking for from companies in the technology sector.
With three companies leaving the list, my radar list is down to these four remaining companies:
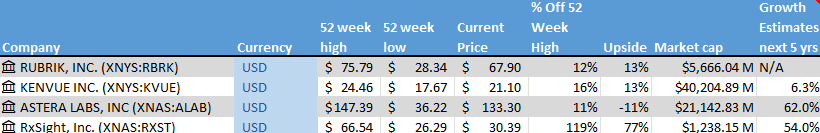
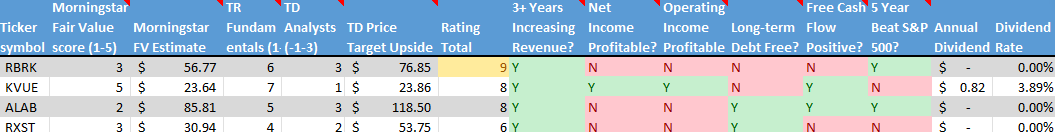
- Kenvue Inc. (NYSE: KVUE): A large-cap (a market value greater than $10 billion) American consumer health company, spun off from Johnson & Johnson in 2023. Kenvue is behind household names like Tylenol and Band-Aid, offering a wide range of health products with which you are probably familiar.
- Astera Labs, Inc. (NASD: ALAB): A large-cap American semiconductor company that’s making a mark with its purpose-built connectivity solutions, powering artificial intelligence (AI) and cloud infrastructure.
- RxSight, Inc. (NASD: RXST): A mid-cap medical technology company that’s reshaping the way cataract surgery patients experience vision. RxSight specializes in adjustable intraocular lenses, allowing for better post-surgery outcomes.
- Rubrik, Inc. (NASD: RBRK): A large-cap American player in the fast-growing cybersecurity sector.
As always, these are not buy recommendations – be sure to do your own research and make decisions that align with your personal financial goals!
The Radar Check was last updated January 17, 2025.
Portfolio Update
Portfolio 1
Portfolio 1 for the week ended January 17, 2025: UP ![]()
- Nvidia’s revenues may face headwinds as the US imposed additional export restrictions on AI chips. These measures aim to solidify US leadership in the burgeoning AI sector while restricting China’s access to the most advanced American-designed AI technology.
- Following calls from the US Federal Trade Commission to break up Alphabet’s (NASD: GOOGL) Google, Britain’s Competition and Markets Authority (CMA) has decided to investigate Google to see how their search services impact consumers and businesses alike.
Activity
Bought: Kraken Robotics is a growing marine technology company at the forefront of ocean exploration. Designing cutting-edge sensors, software, and robotic systems, Kraken specializes in high-resolution 3D acoustic imaging that helps clients tackle the challenges of ocean exploration safely, efficiently, and sustainably. Founded in 2012 and going public in 2015, the company has carved out a solid niche in underwater technology.
At the helm is a team of seasoned executives with deep expertise in marine innovation. Collectively owning nearly 9% of the company, their vested interests align with those of investors. This blend of experience and insider confidence strengthens Kraken’s foundation and positions it for long-term success.
Financially, Kraken is on an impressive trajectory. Profitable since 2023, the company continues to deliver rising revenues, earnings per share, and gross margins. A $150 million contract pipeline spanning military and commercial sectors underscores Kraken’s ability to diversify its client base while mitigating reliance on any single market—a strategic advantage in a competitive industry.
Kraken’s competitive edge lies in its innovative technology and robust intellectual property portfolio. As a leader in sonar and subsea battery technologies, its solutions power critical applications, from military mine countermeasures to offshore wind farm surveys. High-resolution imaging and extended Unmanned Underwater Vehicle (UUV) endurance create a strong moat that sets Kraken apart from competitors.
Expansion fuels Kraken’s momentum. With a growing presence in the US, the company is opening service centres and capitalizing on rising naval spending and the booming offshore energy sector. Canadian government funding and contracts with NATO navies—including the US, Netherlands, and Poland—bolster financial stability and credibility, cementing Kraken’s role as a trusted partner.
Every investment carries risks, and Kraken is no exception. Challenges include market volatility, intense competition, reliance on government spending, regulatory hurdles, and the rapid pace of technological change.
Despite these risks, Kraken’s future appears bright. With growing applications for its technology in defence and renewable energy, alongside strategic acquisitions and partnerships, the company is well-positioned for sustained growth.
With its innovative edge, growing demand for its solutions, and a clear strategy for growth, Kraken will be a valuable addition to this portfolio.
Dividends
Dividends Received this week for the following companies:
Companies followed by DRIP (Dividend Re-Investment Plan) indicate additional shares were purchased with the dividend. Any cash leftover was added to the cash balance.
Canadian $
Telus Corp (TSE: T) DRIP
Andlauer Healthcare Group Inc (TSE: AND)
US $
BSR Real Estate Investment Trust (TSE: HOM.U)
Innovative Industrial Properties Inc. (NYSE: IIPR)
Quarterly Reports
No quarterly reports this past week.
Portfolio 2
Portfolio 2 for the week ended January 17, 2025: UP ![]()
- Guardant Health (NASD: GH) is teaming with ConcertAI, an oncology data and AI software-as-a-service company, to combine patient data with their tumor profiles to improve cancer treatments.
Activity
No significant activity to report this week.
Dividends
Dividends Received this week for the following companies:
Canadian $
Telus Corp (TSE: T) DRIP
Whitecap Resources Inc (TSE: WCP) DRIP
SmartCentres Real Estate Investment Trust (TSE: SRU.UN)
US $
Walt Disney Co. (NYSE: DIS)
Quarterly Reports
No quarterly reports this past week.
Portfolio 3
Portfolio 3 for the week ended January 17, 2025: UP ![]()
- TD Bank (TSE: TD) is fast-tracking their leadership changes with the current CEO retiring and the Chairman of the board set to depart earlier than previously announced. The bank is attempting to move past the scandal over its anti-money-laundering failings.
Activity
Bought: Evolution AB was founded in 2006 and has become a powerhouse in the iGaming industry (online gambling). Specializing in live casino solutions, this Swedish company serves over 600 global gaming operators and leads the way in blending cutting-edge technology with engaging gaming experiences.
I chose to invest in Evolution for several reasons. First, the company dominates the booming live casino segment, a market that grew at an impressive 38% annual rate from 2015 to 2019. Their relentless innovation has earned numerous awards, cementing their reputation as industry pioneers. Simply put, Evolution isn’t just keeping up—they’re setting the standard.
Financially, Evolution excels. They consistently deliver strong revenue and earnings growth through organic expansion, with robust margins and rising EPS reflecting efficiency and profitability. Positive free cash flow fuels growth initiatives, keeping them ahead of the curve.
What truly sets Evolution apart is its people. The co-founders remain active on the board, and senior executives, with at least nine years at the company, hold significant stakes. This alignment with shareholders, paired with a culture of innovation and customer focus, drives their success.
Evolution’s competitive edge is formidable. Proprietary technology, strong brand recognition, extensive licensing agreements, and room for expansion make them hard to beat. With online gambling and sports betting on the rise, Evolution is well-positioned to capture market growth. Their share buyback program further underscores management’s confidence.
As with every investment, there are risks and Evolution is no exception. Regulatory scrutiny, legal challenges, and reliance on key markets bring uncertainties. These concerns have likely contributed to the share price dropping over 40% in the last ten months—or at least, that’s what I’m betting on. 😊
Despite these hurdles, I see Evolution as a leader in a thriving industry with significant upside. The rising demand for online gambling, evident in the wave of advertising, signals a growth trajectory that’s hard to ignore. By investing in Evolution, I’m betting on a market leader with the innovation, financial strength, and vision to deliver long-term value.
Note: Evolution AB shares are primarily traded on the Nasdaq Stockholm Exchange under the ticker EVO.ST. While I considered buying them through TD Direct Investing, the hefty foreign transaction fees made me rethink. Instead, I chose EVVTY, an American Depositary Receipt (ADR) (for more on ADRs, check out this post on ADRs) that trades over the counter (OTC) in the US. This option allows North American investors to access Evolution AB without incurring steep international fees. While EVVTY closely mirrors the performance of EVO.ST, it’s traded on the OTC market for added convenience.
Dividends
Dividends Received this week for the following companies:
Canadian $
Alvopetro Energy Ltd. (TSEV: ALV)
SmartCentres Real Estate Investment Trust (TSE: SRU.UN) DRIP
US $
No US$ dividends this past week.
Quarterly Reports
No quarterly reports this past week.