
Fueling Inflation: More Than Just Gas Prices
Oil prices have surged in recent weeks, driven by the US/Israel–Iran conflict and concerns about global supply disruptions – especially around the Strait of Hormuz, where roughly 20% of the world’s oil passes through. If you own a gas-powered vehicle, you’ve likely felt it firsthand. At the beginning of March, I was filling up for around C$1.25 per litre. Earlier this week, it felt like a win to get it for C$1.95 – a 56% jump in just five weeks, and it may not be over yet.
But the story isn’t just about the pump. Different types of oil, benchmarks like Brent and WTI, and even Canadian tar sands crude all help set global prices. This week, I’ll discuss these benchmarks and how rising oil prices ripple through the economy – affecting everything from jet fuel and diesel to shipping costs, and ultimately feeding into inflation.
The two main benchmarks, Brent Crude and West Texas Intermediate (WTI), have both climbed sharply since the conflict began. Brent comes from the North Sea and is named after the Brent oilfield; it’s slightly heavier than WTI but still relatively light and easy to refine. WTI, by contrast, is a light, sweet crude from US oil fields in Oklahoma.
The difference matters because they reflect different parts of the oil market. Brent reacts more to global disruptions, like tensions in the Middle East, while WTI is more influenced by North American supply and demand. In calmer markets, Brent typically trades at a small premium, but during supply shocks, both can spike quickly. Watching both helps investors gauge whether price pressure is global or regional. Since early March, Brent has climbed from the low-US$70s to the mid-US$90s, and WTI from the mid-US$60s to the high-US$90s as of April 10, 2026 – an unusually sharp move that highlights how quickly markets react to supply risk.
Canadian oil adds another layer. Crude from the Alberta tar sands is thicker and denser (“heavier”) and has higher sulfur content (“sourer”) than WTI or Brent, making it more complex and costly to refine. Because of this, it has its own benchmark – Western Canadian Select (WCS), which is currently trading in the mid-US$80s per barrel – and typically trades at a discount to WTI due to quality, pipeline constraints, and refinery demand. As a result, Canadian oil doesn’t always move in lockstep with Brent or WTI, though it’s still influenced by the same global and regional forces.
Where this really hits home is downstream. Oil isn’t just about what we pay at the pump – it drives the cost of moving almost everything. Jet fuel has surged alongside crude, in some cases doubling, pushing up the cost of flights and air cargo. Rail transport, which relies heavily on diesel, becomes more expensive, and marine shipping faces similar pressure from higher bunker fuel costs. That’s part of why rising energy costs eventually show up in the price of everyday goods.
The end result is a ripple effect across the economy. Higher transportation and production costs move through supply chains, showing up in everything from airline tickets to store shelves. While higher oil prices can benefit energy producers, they tend to pressure consumers and transport-heavy industries. When oil prices moves this quickly, the impact doesn’t stay contained – it feeds into inflation and can make central banks more cautious about cutting interest rates.
In other words, what’s happening with oil isn’t just an energy story – it’s a market story. Now, let’s see how those volatile oil prices played out in the markets this week and how they affected my portfolios.
Items that may only interest or educate me ….
Canadian Economic news, US Economic news, ….
Canadian Economic news
This past week’s key economic data that the Bank of Canada (BoC) considers when deciding whether to raise or lower the interest rate.
Labour Force Survey (LFS)
Statistics Canada’s March employment report showed the labour market stabilizing slightly, with the economy adding 14,100 jobs. While that is an improvement on February’s sharp loss of 83,900 jobs, it does little to offset the nearly 110,000 jobs lost over January and February. The result was broadly in line with expectations, as analysts had forecast a gain of around 15,000 positions.
Most of the job gains came from part-time positions, while full-time employment edged lower. Private sector employment also declined, suggesting businesses may be starting to pull back on hiring as economic conditions begin to cool.
The unemployment rate held steady at 6.7%, coming in just below expectations for a slight increase. Wage growth, meanwhile, picked up, with average hourly wages rising 4.7% compared to a year ago. That marks the fastest pace since October 2024 and a noticeable increase from the 3.2% to 3.9% range seen over the past year.
Overall, the report points to a labour market that is softening gradually rather than sharply, adding to the ongoing uncertainty around the path for interest rates and the broader economy.
Canadian Market Volatility
Canada’s version of the market “fear gauge” is the S&P/TSX Volatility Index (VIXC), often shown on trading platforms as VIXI.TO. Like the better known CBOE Volatility Index in the US, it measures how much volatility investors expect in the Canadian stock market over the next 30 days.
The index opened the week at 21.44 and remained elevated early on before dropping sharply to around the 18-level following the announcement of a midweek ceasefire in the Iran conflict. It continued trending lower into the end of the week, closing at 16.78 and signalling a significant decline in investor stress.
With the VIXC ending the week in the mid-teens and moving lower, investor confidence appears to be gradually improving. It’s also worth noting that Canadian volatility typically runs lower than in the US, largely because the TSX is more heavily weighted toward financials, energy, and materials, sectors that tend to see steadier price movements than the high-growth technology stocks that dominate US markets.
US Economic news
This past week’s key data points that the Federal Reserve (Fed) considers when deciding whether to raise or lower the interest rate.
Federal Open Market Committee (FOMC) Minutes
This week, the Fed published the minutes from its March 17–18 FOMC meeting, offering a closer look at how officials are thinking about the economy. The main takeaway was the central bank is becoming more cautious, especially as oil prices climb. Officials spent a good portion of the discussion on how rising energy costs – driven by the Middle East conflict – could push inflation higher and keep it there longer than expected. That matters for both consumers and investors, because inflation is currently the main factor guiding the Fed’s interest rate decisions.
Right now, the Fed is in “wait-and-see” mode. They’re not raising rates, but they’re also in no hurry to cut them. Higher oil prices are already doing some of the tightening for them by increasing costs across the economy – from transportation to everyday goods – which can slow spending. The concern is that if inflation stays elevated because of energy prices, the Fed may have to keep rates higher for longer than investors were hoping. Some officials even noted that persistently higher oil prices could keep inflation elevated for longer than expected, potentially reopening the door to further rate increases.
At the same time, there’s a growing concern about what’s often called a “stagflation-lite” scenario – where economic growth starts to slow, but inflation is still stubbornly high. It’s not full stagflation, but it’s enough to make the Fed’s job more difficult, as they try to balance supporting the economy without letting inflation get out of control.
In other words, what’s happening in oil markets is starting to influence interest rates. And when the Fed stays cautious on rate cuts, it tends to ripple through the markets – affecting everything from borrowing costs to stock valuations.
Gross Domestic Product (GDP)
The US economy ended 2025 on a softer note. The Commerce Department’s Bureau of Economic Analysis (BEA) reported that fourth-quarter GDP grew at just 0.5% on an annualized basis, down from 0.7% previously reported in the second estimate and a sharp slowdown from the 4.4% pace in the third quarter.
The message is fairly straightforward. The economy is still growing, but it has lost momentum. Consumer spending, which does most of the heavy lifting, began to cool, while weaker business investment and a drop in government spending – partly due to the month-long shutdown – added further drag. The economy is still moving forward, just at a slower pace.
For the Fed, this creates a balancing act. Slower growth can ease inflation pressures and support the case for rate cuts, but it also raises questions about how strong the economy really is heading into 2026. In other words, the economy hasn’t stalled, but it has clearly shifted into a lower gear, leaving both the Fed and investors watching closely to see whether this is temporary or something more sustained.
Personal Consumption Expenditures (PCE)
The BEA reported that February’s PCE price index showed headline inflation rising 0.4% for the month, up from 0.3% in January, keeping the year-over-year pace steady at 2.8%, in line with analyst expectations. Headline PCE includes everything – food, energy, and all other goods and services – which can swing month to month (think gas prices jumping around like we’ve seen since the start of the Iran war).
Core PCE, which strips out food and energy to show underlying inflation trends, is what the Fed really focuses on. In February, core PCE also rose 0.4% month over month, pushing the year-over-year rate slightly higher to 3.0% from January’s 2.8%, again matching expectations. This shows that while inflation isn’t running out of control, it’s also not cooling toward the Fed’s 2% target as quickly as they would like. Costs for services and other essentials are still creeping higher, keeping pressure on price stability.
This adds another layer to the story we saw in the GDP data. Slower economic growth might normally support rate cuts, but stubborn inflation complicates the Fed’s decisions. With price pressures still elevated and energy costs influenced by global tensions, the central bank is likely to stay cautious. In short, the economy is shifting into a lower gear, but inflation hasn’t fully eased – and that ongoing tension is a key factor investors are navigating right now.
Together, the GDP and PCE data provide a clearer picture of the US economic landscape, showing both the slowdown in growth and the persistence of inflation – an important backdrop for how us investors approach the markets in 2026.
Consumer Price Index (CPI)
The Labor Department’s March CPI report showed inflation picked up sharply, with headline prices rising 0.9% month over month, in line with expectations and up from 0.3% in February. On an annual basis, inflation accelerated to 3.3%, compared with 2.4% the previous month, also matching forecasts. The increase was the largest monthly jump in nearly four years, driven largely by higher energy prices and the impact of tariffs feeding through into select goods categories.
Energy prices drove much of the increase, surging amid the ongoing Iran conflict. Fuel oil for home heating led the way, jumping 30.7% in March. Natural gas, also used for heating, was the exception, slipping 0.9% and standing as the only fuel category to decline during the month. On an annual basis, fuel oil again saw the largest increase, soaring 44.2%. Outside of energy, prices were broadly higher across most categories, with used cars and trucks the lone exception, falling 3.2% over the past year.
Shelter costs, which include rent and homeowner-related expenses and make up the largest portion of the index, rose a more modest 0.3% in March. On an annual basis, shelter inflation held steady at 3.0%, unchanged from February, continuing to act as a steady but persistent source of inflation.
Core CPI, which excludes food and energy and is closely watched by the Fed for underlying inflation trends, rose 0.2% on the month, matching February’s pace and coming in slightly below expectations. On an annual basis, core inflation edged up to 2.6% from 2.5% in February, also slightly below forecasts. Core CPI and PCE inflation have both been influenced in part by businesses passing through some of the cost impact from tariffs.
Inflation pressures picked up again in March, largely driven by energy, while underlying inflation remained more contained. That split is important for investors, as it points to continued short-term volatility in the data even as the broader disinflation trend stays intact.
Consumer Sentiment Index (CSI)
The University of Michigan’s initial reading of the April Consumer Sentiment Index came in at 47.6, well below expectations for 52.0 and down sharply from March’s final reading of 53.3. This marks a 10.7% monthly decline and the weakest reading on record, highlighting a noticeable deterioration in household confidence. Sentiment now sits firmly in historically weak territory. On an annual basis, the index is down 8.8%.
Looking closer, the Current Economic Conditions Index, which reflects how consumers feel about their finances and job security today, fell 10.2% to 50.1 and is down 16.2% from a year ago. The Expectations Index, which gauges sentiment over the next six months, fell 10.8% to 46.1, down from 51.7 in March and 2.5% lower year over year.
The drop in current conditions suggests households are starting to feel more pressure in real time, whether from prices, market volatility, or broader economic uncertainty. The decline in expectations points to growing caution about the outlook ahead, not just current conditions. Overall, the report reinforces a familiar theme alongside recent inflation and labour data: consumer confidence is clearly weakening, especially around expectations for the months ahead, but not breaking down entirely.
American Market Volatility
The CBOE Volatility Index, often referred to as the market’s “fear gauge,” tracks how much volatility investors expect over the next 30 days. Think of it as the market’s pulse, where readings above 20 signal rising uncertainty.
With the rapidly evolving situation in Iran, the VIX started the week elevated, opening at 24.93. It climbed further midweek, peaking near 28 as tensions remained high. As signs of easing tensions appeared, the VIX dropped sharply, falling toward the 20 level, its lowest point since the start of the conflict. The index continued to cool into the end of the week, closing at 19.23 and signalling a meaningful pullback in investor fear.
Weekly Market and Portfolio Review
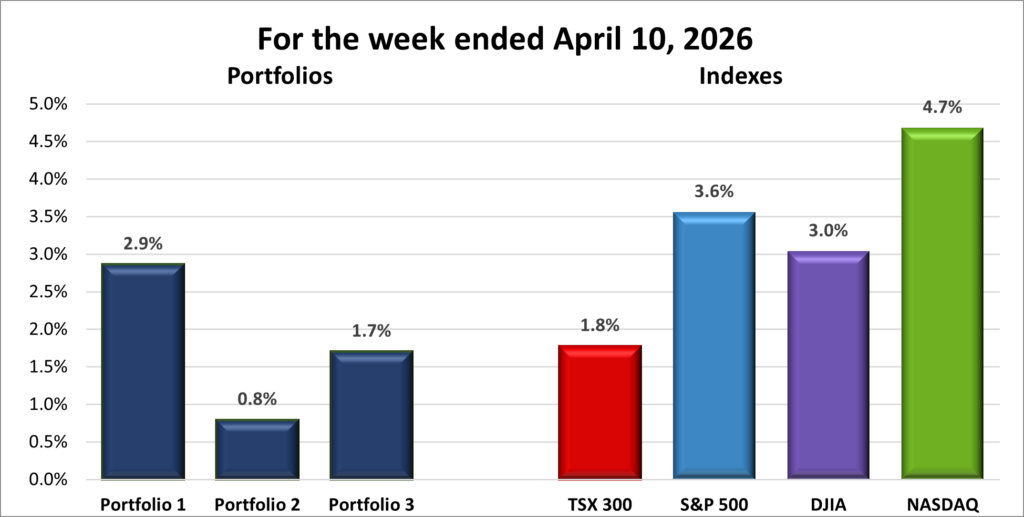
For the week, the TSX (SPTSX) gained 1.8%, the S&P 500 (SPX) rose 3.6%, the DJIA (INDU) advanced 3.0% and the Nasdaq (CCMP) surged 4.7%.
| Index | Weekly Streak |
| TSX: | 3 – week winning streak |
| S&P: | 2 – week winning streak |
| DJIA: | 2 – week winning streak |
| Nasdaq: | 2 – week winning streak |
![]() It was another strong but headline-driven week in the markets, as momentum from the previous week carried through with only minor speed bumps along the way. All four major indexes extended their winning streaks at some point during the week. The Nasdaq Composite Index (Nasdaq) stretched its streak to eight straight sessions, while the S&P 500 Index (S&P) posted seven consecutive gains before being snapped at the end of the week. The Toronto Stock Exchange Composite Index (TSX) reached six straight sessions before a late-week setback, while the Dow Jones Industrial Average (DJIA) saw a four-session winning streak snapped midweek before rebounding sharply the next day, marking its largest single-day percentage gain since April 9, 2025.
It was another strong but headline-driven week in the markets, as momentum from the previous week carried through with only minor speed bumps along the way. All four major indexes extended their winning streaks at some point during the week. The Nasdaq Composite Index (Nasdaq) stretched its streak to eight straight sessions, while the S&P 500 Index (S&P) posted seven consecutive gains before being snapped at the end of the week. The Toronto Stock Exchange Composite Index (TSX) reached six straight sessions before a late-week setback, while the Dow Jones Industrial Average (DJIA) saw a four-session winning streak snapped midweek before rebounding sharply the next day, marking its largest single-day percentage gain since April 9, 2025.
All three major US indexes posted their biggest weekly gains since November 2025. On a year-to-date basis, the DJIA’s surge pushed it into positive territory, joining the TSX. Meanwhile, the S&P and Nasdaq are now both within 1% of turning positive for the year following their recent two-week rebound.
Once again, the US/Israel conflict with Iran drove the markets. The week got off to an ominous start after President Trump threatened to destroy “an entire civilization” if Iran failed to surrender and reopen the Strait of Hormuz. Tensions cooled following the announcement of a two-week ceasefire. As oil prices pulled back below US$100 per barrel, inflation pressures eased slightly, giving investors more breathing room. That shift showed up quickly in the markets, as energy stocks fell while other sectors moved higher. A strong rebound in technology stocks helped push the Nasdaq to the strongest performance among the major indexes.
Economic data also played a role. A weaker GDP reading reinforced earlier signs that the economy is slowing, while the latest PCE and CPI data showed inflation remains sticky, largely driven by higher energy prices tied to the conflict. That combination raises the risk of stagflation, where growth slows while inflation rises. Minutes from the Fed’s latest meeting added to those concerns, indicating that Fed officials see a risk of inflation remaining elevated even as growth weakens.
While slower growth would typically support rate cuts, persistent inflation makes that option far less clear. Consumer sentiment added to the cautious tone, tumbling to a record low, with near-term expectations falling to their lowest level since May 1980.
In Canada, investor sentiment was shaped by many of the same factors, including the Iran conflict, oil prices, inflation, and interest rate expectations, though the TSX’s heavier weighting toward energy amplified the moves.
Early in the week, strength in energy stocks supported the index as oil prices remained elevated amid Middle East tensions. However, as the ceasefire took hold and oil prices pulled back, energy stocks moved lower. That weakness was partly offset by strength in other areas of the market, along with a broader sense of investor relief as tensions eased.
Late in the week, the latest labour data showed a modest gain following significant job losses in the first two months of the year, providing a slight boost to the TSX.
All in all, it was a positive week for the major indexes, supported by easing geopolitical tensions and cautious optimism around interest rates. With the ceasefire expected to hold in the near term, attention now turns to first-quarter earnings season which starts next week. A strong start could help sustain the recent momentum and give investors something more concrete to build on beyond headlines.
| Portfolio | Weekly Streak |
| Portfolio 1: | 2 – week winning streak |
| Portfolio 2: | 2 – week winning streak |
| Portfolio 3: | 2 – week winning streak |
![]() After watching the three portfolios scuffle along for most of March, its great to see all three of them stretch their weekly winning streak to two. While most of the oil and gas stocks pulled back this week, the technology stocks more than picked up the slack, especially the Magnificent 7 members.
After watching the three portfolios scuffle along for most of March, its great to see all three of them stretch their weekly winning streak to two. While most of the oil and gas stocks pulled back this week, the technology stocks more than picked up the slack, especially the Magnificent 7 members.
Portfolio 1 was the top performer, rising 2.9% on the week. It also had the highest percentage of gainers, with 74% of holdings moving higher. Leading the way were Celestica (TSE: CLS) up 17%, Hammond Power Solutions (TSE: HPS.A) up 16%, Arista Networks (NYSE: ANET) up 15%, and Amazon (NASD: AMZN) up 13%. Offsetting some of those gains were Cloudflare (NYSE: NET) which plunged 21% and a 10% decline by Datadog (NASD: DDOG).
Portfolio 2 trailed the group but still posted a modest 0.8% gain, with 55% of holdings finishing higher. Top performers included Hammond Power Solutions 16% gain, while Aritzia (TSE: ATZ) and Birkenstock (NYSE: BIRK) both were up 11%. On the downside, MongoDB (NASD: MDB) declined 10%. With the highest exposure to energy stocks, it wasn’t surprising to see this portfolio lag as oil prices pulled back.
Portfolio 3 posted a solid 1.7% gain, with an impressive 71% of its holdings moving higher. Vertiv Holdings (NYSE: VRT) was a standout, hitting a record high on its way to an 11% gain for the week. Weighing on performance was Cloudflare, which dropped 21% amid concerns that artificial intelligence (AI) could disrupt its business model.
Overall, it was a solid week across all three portfolios, with broad participation across the markets and strength in technology helping offset weakness in energy. It was a good reminder of the value of diversification, as different sectors took turns driving performance. Fingers crossed earnings season can deliver a bit of stability to the markets, which would help push the portfolios’ weekly winning streaks to three weeks. 😊
Companies on the Radar
 This week brought a bit of a reshuffle on my radar list – one name moved to the backburner, while an old familiar face made its return.
Heading to the backburner is Enerflex Ltd. (TSE: EFX), the Canadian provider of infrastructure and energy transition solutions tied to global natural gas and power markets. After a solid run, the shares feel like they may have lost some momentum, suggesting I may have missed the latest upswing. It also sits in that middle ground – not quite a high-yielding dividend defensive play, but not a true high-growth name either – making it harder to prioritize. For now, it joins Corning (NYSE: GLW) on the backburner rather than front and centre like the other companies on my radar.
Joining the list is an old friend: Arm Holdings (NASD: ARM). I first invested in the company shortly after its Initial Public Offering in September 2023 but ended up selling after a 20% drop from my purchase price (US$59.87) – one of those decisions that’s easy to second-guess in hindsight. Today, the shares sit around US$148, which would’ve been roughly a 250% gain. Not my finest investing moment. ☹
That said, a past mistake doesn’t mean the company isn’t worth revisiting. Arm stands out as a classic picks-and-shovels play in the technology ecosystem. Rather than building end products, it designs the chip architecture that companies like Apple (NASD: AAPL) and Nvidia (NASD: NVDA) rely on. That puts it in a position to benefit from long-term growth across smartphones, AI, and data centres without having to bet on a single winner. Its designs sit quietly at the core of modern computing, and once companies build around its architecture, switching becomes unlikely – giving the business a durable edge that’s hard to ignore.
Sometimes the best opportunities are the ones that deserve a second look – and this time around, I’ll be watching a little more closely. With these two moves, alongside the five holdovers, my radar list stays at six.
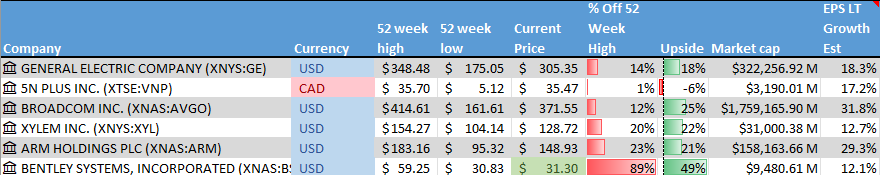
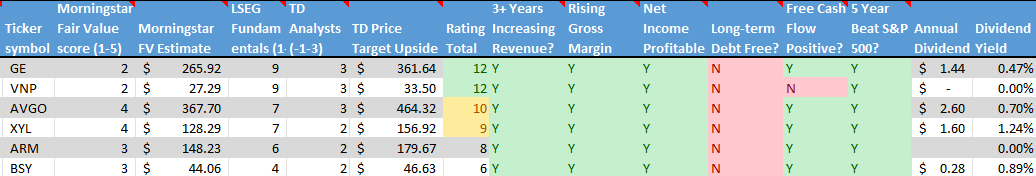
- 5N Plus Inc. (TSX: VNP): a small-cap Canadian company that produces high-purity specialty metals and semiconductor materials used in space solar power, renewable energy, medical imaging, and electronics. Many of its products are mission-critical, requiring consistent quality and long-term supply. With exposure to space programs, clean energy, and strategic materials, 5N Plus operates in several niche but expanding markets where technical expertise creates competitive advantages.
- GE Aerospace (NYSE: GE): This is the large American aviation and defence business that remained after General Electric split into three separate companies in 2024. It has been on a strong run thanks to high demand for commercial jet engines as global air travel continues to recover. The company focuses on aircraft propulsion systems and services for both commercial and military customers, and it’s also moving into drones. As a global leader in jet engines and aircraft systems, GE Aerospace offers exposure to long-term trends in travel, defence spending, and emerging aviation technology.
- Broadcom (NASD: AVGO): A large cap American company that sells semiconductors and software globally. It designs critical chips used in data centres, networking equipment, and broadband infrastructure, playing a behind-the-scenes role in cloud computing and AI. Broadcom also owns a growing enterprise software business following its acquisition of VMware, giving it exposure to both hardware and software spending tied to AI and cloud growth.
- Xylem Inc. (NYSE: XYL): This is a large American company that develops water technology focused on moving, treating, and managing water. Its products and services are used by utilities, industrial customers, and municipalities for everything from clean drinking water and wastewater treatment to flood control and leak detection. With aging water infrastructure and more frequent climate challenges like droughts and flooding, demand for Xylem’s solutions is still strong. The business offers exposure to long-term, essential infrastructure spending tied to water scarcity, sustainability, and smarter cities.
- Bentley Systems (NASD: BSY): an American software company that sits just above the mid-cap threshold (under US$10 billion market cap), leaving plenty of room for growth. They provide specialized software for professionals who design, build, and operate the world’s infrastructure. From bridges and roads to power plants and water networks, Bentley’s tools help engineers and architects model, manage, and maintain complex physical assets throughout their entire lifecycle.
As always, these are not buy recommendations. Make sure to do your own research and choose investments that fit your personal financial goals.
The Radar Check was last updated April 10, 2026.
That’s a wrap for this week, thanks for reading – may your portfolio stay green and your dividends steady. See you next time!