
The Shifting Sands of Oil Supply
The war in Iran has now stretched on for over two months, with both sides appearing locked in a stalemate. While the conflict hasn’t directly affected us here in North America, its effects have still been felt – most notably through rising oil prices following disruptions in the Strait of Hormuz, a critical chokepoint that handles roughly 20% of global crude flows.
For most of us, oil shows up as gasoline – the fuel that powers our cars and moves goods through the economy. But behind the scenes, it sits inside a much larger system shaped not just by supply and demand, but by coordination between major producers.
To understand where oil prices could go next – and what that means for investors and the broader economy – it helps to look at how global supply is managed. That’s where OPEC – and more recently OPEC+ – come in.
Oil markets are shaped as much by coordination and politics as by supply and demand. At the centre of that sits OPEC – the Organization of the Petroleum Exporting Countries – and its expanded version, OPEC+, which together influence a significant share of global supply.
OPEC was formed in 1960 by major producers including Saudi Arabia, Iran, Iraq, Kuwait, and Venezuela to coordinate output and stabilise prices in a market long dominated by large international oil companies. As production outside the group grew, its influence gradually weakened.
That led to OPEC+ in 2016, which added producers such as Russia to broaden coordination and manage supply through periods of surplus or volatility. In practice, OPEC+ acts as a “swing producer,” adjusting output to help balance global markets.
However, not all major producers are part of this system. The United States is now the world’s largest oil producer, while Canada ranks among the top five globally. Both operate outside OPEC+, with production driven largely by market prices rather than quotas.
That creates a key dynamic. While OPEC+ manages supply through coordination, North American producers respond to price signals – increasing output when prices rise and pulling back when they fall. As a result, a large share of global supply sits outside direct control.
For markets, the key variable is stability of coordination. Even small shifts in cohesion can move prices by changing expectations for future supply. Tighter coordination supports prices; weaker coordination tends to increase volatility.
Against that backdrop, the announcement that the United Arab Emirates will leave OPEC and OPEC+ effective May 1, 2026, marks a meaningful shift. The UAE has been a key producer within the group, and its exit reduces the level of coordinated supply management.
At the core of the decision is flexibility. The UAE has invested heavily to expand production capacity, but OPEC+ quotas haven’t always reflected that growth. Leaving the group gives it more freedom to align output with its own economic priorities.
In simple terms, it adds uncertainty around global supply – and by extension, the direction of oil prices.
From here, the impact feeds into the broader economy. Oil remains a key input into global growth, from transportation to manufacturing. Higher prices tend to pass through quickly into inflation via energy and fuel costs, complicating the outlook for central banks like the Bank of Canada and the US Federal Reserve.
Put together, this isn’t just a story about oil producers or shifting alliances. It’s a reminder that oil still sits at the centre of the bigger economic picture. Changes in supply coordination flow directly into prices, inflation, interest rates, and ultimately equity markets.
For investors, that’s the key link. Oil isn’t just an energy input – it’s a driver of broader market conditions. When supply dynamics shift, the impact rarely stays contained. It ripples across the entire market landscape.
While oil and geopolitics continue to dominate the headlines, this week also brought a steady flow of economic data and significant earnings reports that helped move markets. Let’s take a look at how it all played out – and how it filtered through to my three portfolios this past week.
Items that may only interest or educate me ….
Canadian Economic news, US Economic news, ….
Canadian Economic news
This past week’s key economic data that the Bank of Canada (BoC) considers when deciding whether to raise or lower the interest rate.
Bank of Canada Rate Decision
Following the Bank of Canada’s April 29 meeting, Governor Tiff Macklem announced that the bank would be holding its key interest rate at 2.25%. The last change came back in October 2025, when the BoC lowered the rate by 0.25%, bringing it to its current level, where it has now remained for the past six months.
This decision wasn’t much of a surprise for investors. On one hand, inflation pressures have started to pick up again, largely driven by higher energy prices and ongoing global geopolitical tensions. On the other, the domestic economy is still showing uneven growth. Consumer and government spending continue to support overall activity, but that strength is being partly offset by tariffs and broader trade uncertainty, which are weighing on exports and business investment. The labour market has also cooled from its earlier strength, adding to the sense of a more balanced but still uncertain backdrop.
Rather than leaning too heavily in either direction, the BoC is effectively staying patient here, signalling that it is willing to look through short-term inflation bumps while it waits for clearer evidence on the underlying inflation trend. In other words, this was less about a policy shift and more about maintaining flexibility in an uncertain environment.
Gross Domestic Product (GDP)
Statistics Canada reported that Canada’s economy grew by 0.2% in February, following a 0.1% increase in January. That marks the fourth straight month of expansion, right in line with expectations and continuing a steady, but modest, growth trend.
Looking closer, gains were once again driven by goods-producing industries, which rose 0.4% on the month and are up 0.8% year-over-year. Manufacturing led with a strong 1.8% increase, while agriculture, forestry, fishing and hunting declined 1.3%. Over the past year, mining, quarrying, and oil and gas extraction has climbed 3.6%, while utilities are down 4.0%.
Services activity edged up 0.1% in February, a slight improvement from January’s flat reading, and is now up 1.1% over the past year. Transportation and warehousing led the way with a 0.8% gain, while the arts, entertainment and recreation industry fell 2.6%. On a yearly basis, transportation and warehousing has grown 3.2%, while wholesale trade has slipped 1.9%.
The good news is the economy is growing. The not so good news is its not accelerating. Strength in manufacturing and energy is helping keep things moving forward, but trade uncertainty and weakness in interest rate-sensitive areas continue to act as a drag, leaving Canada in a middle ground where growth is positive, but still modest.
Looking ahead, the early estimate for March suggests growth may have stalled. If that holds, it would put first-quarter growth at around 1.7% annualized – slightly above the Bank of Canada’s expectations, but still a relatively moderate pace.
Canadian Market Volatility
Canada’s version of the market “fear gauge” is the S&P/TSX Volatility Index (VIXC), often shown on trading platforms as VIXI.TO. Like the better-known CBOE Volatility Index in the US, it measures expected volatility in the Canadian equity market over the next 30 days.
The index opened the week at 17.93 and held in a relatively tight range between 17.50 and 17.00 through the early part of the week. It then drifted lower, slipping below 16 following a series of Canadian and US economic releases that largely came in as expected. From there, the VIXC continued to ease, ending the week at 15.86.
With the index finishing in the mid-teens and trending lower, it points to a gradual cooling in investor anxiety. It’s also worth noting that Canadian volatility tends to run lower than in the US, largely because the TSX is more heavily weighted toward financials, energy, and materials. These sectors typically experience steadier price swings compared to the higher-growth technology names that dominate US markets.
US Economic news
This past week’s key data points that the Federal Reserve (Fed) considers when deciding whether to raise or lower the interest rate.
Consumer Confidence Index (CCI)
The Conference Board’s latest Consumer Confidence Index came in at 92.8 in April, up from 92.2 in March and, importantly, ahead of expectations. On the surface, that sounds good – but the details tell a more cautious story.
The improvement was driven by the present. The Present Situation Index, which reflects how consumers feel about current business conditions and the job market, ticked higher, supported by a still-resilient labour market. Fewer people reported that jobs are hard to find, and income expectations held up – helping keep overall confidence stable.
But the future is where cracks are starting to show. The Expectations Index rose slightly to 72.2 but stays well below the 80 level that is often associated with recession risk. Rising costs – particularly energy – along with still-elevated inflation expectations continue to weigh on how consumers feel about the months ahead.
All of this points to a familiar pattern. Consumers are holding up, supported by a strong job market, but confidence in the future remains fragile – enough to keep spending going, but not enough to feel comfortable.
Fed Rate Decision
Following the Fed’s latest FOMC meeting, Fed Chair Jerome Powell – in what was his final meeting as Chair – announced that the central bank would hold its benchmark interest rate steady in the 3.5%-3.75% range. This marked the third straight meeting with no change.
That wasn’t the surprise. The vote was.
The Federal Reserve split 8–4, its most divided decision since the early 1990s. Eight members supported holding rates steady, but four dissented – three pushed back against signalling future rate cuts, while one supported cutting rates immediately.
That split highlights a growing divide inside the Fed. Some policymakers are open to cutting rates if the economy weakens, while others are increasingly concerned inflation isn’t fully under control – and could start moving higher again.
A big reason comes down to energy. The ongoing Iran conflict has pushed oil prices back above $100 per barrel, driving gasoline prices higher and putting upward pressure on inflation.
Powell emphasized the Fed is in no rush to act, but the tone has shifted. The conversation is no longer just about when to cut rates – it’s increasingly about whether conditions are stable enough to cut at all.
The next FOMC meeting is set for June 16–17, when Kevin Warsh is expected to take over as Chair. The meeting will also include updated economic projections, which should give investors a clearer sense of where interest rates may be headed.
Personal Consumption Expenditures (PCE)
The Commerce Department’s Bureau of Economic Analysis (BEA) reported that the inflation as recorded by the PCE price index rose 0.7% in March, easing from February’s 0.9% increase. On an annual basis, inflation came in at 3.5%, up from 2.8% the month before. Both figures were in line with expectations.
Core PCE, which excludes food and energy to better reflect underlying inflation trends, rose 0.3% on the month, following a 0.4% increase in February. On a yearly basis, core inflation climbed to 3.2% from 2.8%, moving further away from the Fed’s 2.0% target, Both number matched expectations.
The increase was largely driven by higher oil and gasoline prices, tied to ongoing Iran war, which pushed up broader consumer costs. At the same time, core inflation is still elevated, suggesting price pressures are still fairly broad-based rather than a one-off spike.
The overall message is that inflation isn’t cooling – it’s starting to pick back up. Even though the economy continues to grow, higher prices – especially for essentials like energy – are beginning to weigh more on consumers’ purchasing power. You can see that in the data, where spending is rising, but much of that increase is being driven by higher prices rather than stronger demand.
Gross Domestic Product (GDP)
The BEA also published its advance estimate for first-quarter GDP, showing the American economy grew at an annualized pace of 2.0%. That’s a significant pickup from the fourth quarter’s revised 0.5% pace but still came in below expectations of around 2.3%.
Under the surface, the growth story was a bit of a mixed bag. Business investment was a key driver, particularly in areas tied to artificial intelligence (AI) and infrastructure, while government spending also rebounded after a weaker prior quarter. At the same time, consumer spending – which makes up the bulk of the economy – continued to grow, but at a slower pace, showing some early signs of pressure.
Inflation also remained a key theme. Higher energy prices, tied to ongoing geopolitical tensions, pushed price pressures higher during the quarter, which is starting to weigh on household buying power.
The overall takeaway is that the US economy is still holding up, but the momentum isn’t coming from everywhere. Investment and government spending are doing much of the heavy lifting, while the consumer – the biggest piece of the puzzle – is beginning to slow. If that trend continues, it could eventually start to drag on overall growth.
Taken together with the PCE report, it reinforces the idea that while the US economy is holding up, inflation is proving stickier than expected – keeping the Fed in a patient, wait-and-see mode.
American Market Volatility
The CBOE Volatility Index (VIX), often referred to as the market’s “fear gauge,” tracks expected volatility in the S&P 500 over the next 30 days. In simple terms, it reflects how much uncertainty or calm investors are pricing in. Readings above 20 typically point to elevated concern, while levels below 20 tend to signal a more stable market backdrop.
The VIX started the week at 19.21, slightly below the previous week’s close. Early in the week, volatility briefly picked up on concerns around AI, after OpenAI reportedly fell short of some internal sales and user expectations. Later in the week, sentiment softened again as investors turned cautious ahead of the Fed’s rate announcement and earnings from several major technology companies.
Outside of those short-lived spikes, volatility steadily eased as markets stabilized, with the index gradually trending lower through the week. By the end of the week, the VIX had settled at 16.99, pointing to a calmer tone and a pullback in near-term uncertainty.
Weekly Market and Portfolio Review
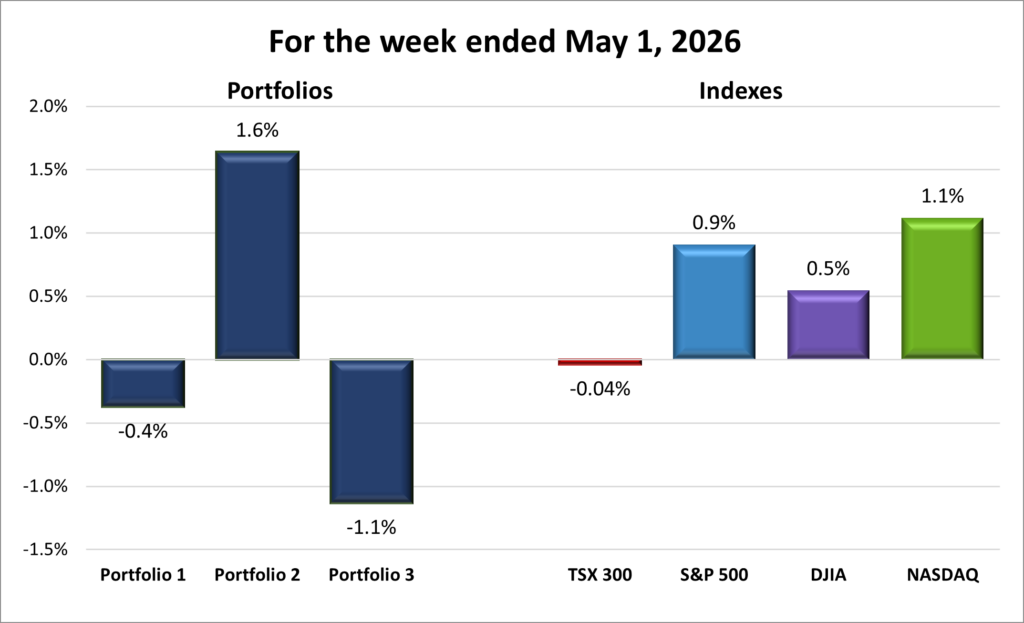
For the week, the TSX (SPTSX) slipped 0.04%, the S&P 500 (SPX) climbed 0.9%, the DJIA (INDU) advanced 0.5% and the Nasdaq (CCMP) gained 1.1%.
| Index | Weekly Streak |
| TSX: | 2 – week losing streak |
| S&P: | 5 – week winning streak |
| DJIA: | 1 – week winning streak |
| Nasdaq: | 5 – week winning streak |
![]()
![]() After spending most of the week trending lower, markets rebounded strongly on Thursday, pushing the four major North American indexes—the Toronto Stock Exchange Composite Index (TSX), the S&P 500, the Dow Jones Industrial Average (DJIA), and the Nasdaq Composite—into positive territory for the week. The TSX snapped a five-day losing streak, its longest of the year, with its biggest daily gain since late March. Meanwhile, both the Nasdaq and S&P posted consecutive record highs to close out the week. The S&P finished above 7,200 for the first time to end of April on a high note, while the Nasdaq kicked off May by closing above 25,000 for the first time.
After spending most of the week trending lower, markets rebounded strongly on Thursday, pushing the four major North American indexes—the Toronto Stock Exchange Composite Index (TSX), the S&P 500, the Dow Jones Industrial Average (DJIA), and the Nasdaq Composite—into positive territory for the week. The TSX snapped a five-day losing streak, its longest of the year, with its biggest daily gain since late March. Meanwhile, both the Nasdaq and S&P posted consecutive record highs to close out the week. The S&P finished above 7,200 for the first time to end of April on a high note, while the Nasdaq kicked off May by closing above 25,000 for the first time.
The three US indexes were driven by a mix of crosscurrents this week, with geopolitical developments, economic data shifting interest rate expectations, and earnings all playing a role.
The ongoing war involving Iran remained a key backdrop, driving oil prices higher and keeping inflation concerns front of mind. While it didn’t trigger sharp selloffs on its own, it added a layer of caution as investors weighed the risk that rising energy costs could feed back into broader inflation and keep interest rates higher for longer.
At the same time, economic data pointed to a mixed but resilient picture. American GDP showed the economy is still growing, but at a slower-than-expected pace, while both headline and core PCE inflation came in as expected but continued to point to sticky price pressures. That combination reinforced a “higher for longer” rate outlook, which helped limit upside momentum.
Earnings season also played an important role, particularly in the technology sector. Results were generally solid, but markets remained sensitive to any signs of slowing growth or cautious guidance, leading to short-term volatility, especially in the Nasdaq.
There were also renewed questions around AI, which has been a key driver of market performance in recent months. Early concerns after reports suggested OpenAI missed its own sales and user targets triggered brief pullbacks, but sentiment stabilized as earnings from several mega-cap technology companies reinforced that AI-related spending remains strong, with combined projections pointing to roughly US$725 billion in investment this year. Apple’s (NASD: AAPL) strongest quarterly sales growth in more than four years also helped support the broader technology rally, signalling that demand across the sector is still healthy.
Adding to the backdrop, the Fed left its benchmark interest rate unchanged at 3.75% at its latest FOMC meeting, expected to be Jerome Powell’s final meeting as Chair. While the rate decision wasn’t a surprise, it reinforced the broader “wait-and-see” stance, as officials continue to balance resilient growth against persistent inflation.
In Canada, the TSX was driven mostly by commodity prices and domestic economic updates, while still following the broader US market.
Energy was the main driver. Both Brent crude and WTI crude moved higher for most of the week, extending a multi-day advance driven mainly by the ongoing Iran conflict and tightening supply expectations, before pulling back slightly into the close, with both benchmarks still ending above US$100 per barrel. The TSX’s heavy weighting to oil and gas meant rising crude prices helped support the index and offset weakness elsewhere, limiting losses.
On the domestic side, recent economic data reinforced a familiar theme: Canada’s economy is still growing, but at a modest and uneven pace. Strength in select goods-producing sectors continues to be offset by softer areas tied to trade and investment, keeping the overall growth profile steady rather than accelerating.
The Bank of Canada’s decision to hold its policy rate at 2.25% also influenced sentiment. While widely expected, it reinforced the view that policymakers remain patient as they balance sticky inflation against slower growth, helping keep rate-driven volatility contained.
With that in mind, let’s take a look at how each portfolio performed this week.
| Portfolio | Weekly Streak |
| Portfolio 1: | 1 – week losing streak |
| Portfolio 2: | 5 – week winning streak |
| Portfolio 3: | 1 – week losing streak |
![]()
![]() With the late surge in the markets, I expected it would be enough to lift all three portfolios into positive territory for the week. Alas, it was not to be. ☹️
With the late surge in the markets, I expected it would be enough to lift all three portfolios into positive territory for the week. Alas, it was not to be. ☹️
It ended up being a mixed week, with one portfolio outperforming all of the indexes and another finishing below them. By the end of the week, two winning streaks had come to an end.
Portfolio 1 fell 0.4%, snapping its run of weekly gains. Despite the decline, 61% of its holdings still moved higher. Alphabet (NASD: GOOGL) led the way, hitting a record high on its way to an 11% gain for the week. Nvidia (NASD: NVDA) also reached a record high early in the week, but couldn’t hold the momentum and finished down 5%.
Portfolio 2 was the standout performer, gaining 1.6% and even beating the Nasdaq, the top-performing index for the week. It also had the highest percentage of winners, with 68% of holdings posting gains. There weren’t any big individual standouts – just steady performance across the board.
There was also some interesting company-specific news. Microsoft (NASD: MSFT) and OpenAI ended their exclusive partnership, allowing OpenAI to provide services to Microsoft’s competitors while Microsoft remains its primary cloud provider. In return, Microsoft will no longer pay a revenue share, while still receiving payments from OpenAI through 2030. Overall, this looks like a win-win, giving both companies more flexibility to pursue their own strategies.
Portfolio 3 had the toughest week, falling 1.1%, the largest decline among the portfolios and indexes. A 22% jump in Lithium Americas (TSE: LAC) was largely offset by a 15% drop in Brookfield Renewable (TSE: BEPC). At the same time, Nvidia – still the largest holding despite recent trimming – fell 5%, which outweighed gains from the 62% of holdings that did move higher.
On a side note, Portfolio 3 has quietly, and somewhat unintentionally, built out significant exposure to the AI ecosystem. With the addition of Broadcom (NASD: AVGO) this week – alongside existing positions in Nvidia, Arista Networks (NYSE: ANET), Vertiv Holdings (NYSE: VRT), and Microsoft – the portfolio now spans much of the AI data centre stack. Each plays a different role: Nvidia provides the computing power, Broadcom and Arista handle data movement, Vertiv supports the physical infrastructure, and Microsoft ties it together through the cloud.
All of these companies are connected, in different ways, to AI spending and data centre buildout. If that investment continues to accelerate, this group is well positioned. But if it slows, the impact will likely be felt across multiple holdings at once. Long live the datacentre build out. 😊
Not the best week, but it’s a good reminder that even with over 60% of holdings posting gains, those gains can be offset when a larger position isn’t among the winners. Taking a glass-half-full view, it’s still encouraging to see the underlying strength across many holdings, especially with long-term themes like AI still firmly in place. 😊
Companies on the Radar
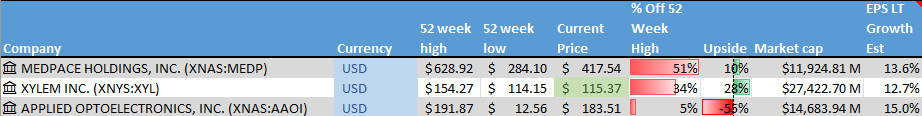
 And then there was one. With Broadcom moving into Portfolio 3, my radar list had been trimmed back to a single holdover – Xylem Inc. (NYSE: XYL).
The last few weeks I’ve been on a bit of a buying spree, leaving the radar list looking a little bare. However, that didn’t last long as one new company came onto my radar, while another has made a return.
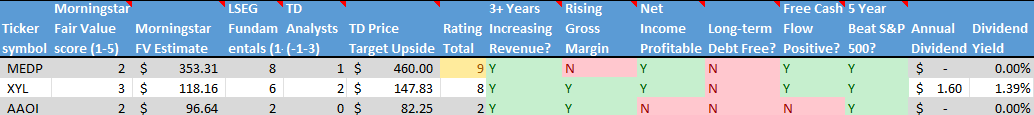
New to the radar is Applied Optoelectronics (NASD: AAOI), an American technology company that has surged into large-cap territory after a sharp run-up in its share price. Despite that, it still behaves more like a mid-cap – with higher volatility, greater sensitivity to individual contracts, and a less diversified revenue base.
AAOI is a “picks and shovels” AI play, sitting behind the scenes of the boom. Instead of building chips or models, it makes optical transceivers – the components that move data between servers inside data centres. It’s not flashy, but it’s essential.
As AI systems scale, data movement between chips – the heart of AI – is exploding, turning network speed into a bottleneck. That’s driving demand for faster technologies, and AAOI has started landing significant orders tied to that shift.
If data centre investment keeps accelerating, AAOI is well positioned. But this is still a higher-risk, higher-reward company where execution will matter.
The returning company is Medpace Holdings, (NASD: MEDP) a mid-cap American healthcare company I previously looked at back in August 2023. Medpace is a “picks and shovels” play on drug development – a contract research organization (CRO) that helps biotech and pharmaceutical companies run clinical trials. It manages the process of testing new drugs, from early-stage studies through to regulatory approval. It’s behind-the-scenes work, but essential to bringing new treatments to market.
What stands out is the business model. Drug development is complex and costly, so many smaller biotech companies outsource it rather than build that capability in-house. That creates steady demand for CROs like Medpace, especially as innovation in biotech continues to expand.
As that demand grows, Medpace benefits from a backlog of contracted work, which provides some visibility into future revenue. But growth isn’t always smooth. One key metric to watch is bookings – new contracts coming in – as slowdowns there can signal weaker growth ahead.
If biotech innovation and funding remain strong, it is well positioned – but future growth will depend on consistently winning new business.
With their addition alongside Xylem, the lone holdover, the radar list now sits at three names.
- Xylem Inc.: This is a large American company that develops water technology focused on moving, treating, and managing water. Its products and services are used by utilities, industrial customers, and municipalities for everything from clean drinking water and wastewater treatment to flood control and leak detection. With aging water infrastructure and more frequent climate challenges like droughts and flooding, demand for Xylem’s solutions is still strong. The business offers exposure to long-term, essential infrastructure spending tied to water scarcity, sustainability, and smarter cities.
As always, these are not buy recommendations. Make sure to do your own research and choose investments that fit your personal financial goals.
The Radar Check was last updated May 1, 2026.
Portfolio Update
Portfolio 3
Bought: Broadcom Inc. As with my investments in 5N Plus (TSE: VNP) and GE Aerospace (NYSE: GE) last week, Broadcom had been on my radar for quite some time. The recent volatility across technology stocks, driven by concerns over interest rates and ongoing debate around the pace of AI spending, created an opportunity to become an owner of one of the most important companies behind today’s digital infrastructure.
Broadcom operates at the heart of the modern technology stack. It designs semiconductors and networking hardware that power data centres, cloud computing, and increasingly, artificial intelligence systems. In simple terms, it helps move and process the massive amounts of data that today’s digital world depends on.
Broadcom focuses on highly specialised, mission-critical chips and connectivity solutions, often working closely with a small number of large customers to design custom products. Once embedded, its technology tends to remain in place for years, creating long product cycles and durable revenue streams. Its expansion into software – most notably through the VMware acquisition – also adds a layer of recurring revenue.
The scale and positioning of the business are hard to ignore. As companies continue to invest heavily in AI infrastructure, demand for high-performance chips and fast, reliable networking is accelerating.
AI models require enormous amounts of data to move between processors, turning connectivity into a key bottleneck. Broadcom sits directly in the middle of that trend, supplying both custom chips and networking solutions.
More recently, that demand has been showing up in its results. AI-related revenue has been growing rapidly, supported by large, multi-year commitments from companies such as Microsoft and Alphabet’s Google as they build out data centre capacity. This creates a level of visibility that is often rare in the semiconductor industry.
As with all investments, there are risks to consider. A significant portion of Broadcom’s revenue comes from a relatively small number of large customers, creating concentration risk. If spending from these customers slows, it could affect growth.
There is also exposure to the broader semiconductor cycle. While AI is a strong tailwind, other parts of the business remain sensitive to economic conditions and fluctuations in demand.
In addition, expectations for AI-related growth are high. If the pace of investment moderates, the market’s reaction could be volatile, even if the long-term story remains intact.
Despite these risks, the opportunity felt compelling. Broadcom offers exposure to one of the most important trends in today’s market – the buildout of AI and data centre infrastructure – supported by a business model that combines long product cycles, deep customer relationships, and growing recurring revenue.
As demand for data, connectivity, and computing power continues to grow, Broadcom is well positioned to grow alongside it. Using the proceeds from trimming some NVIDIA shares a few weeks ago, I’ve put that capital back to work here – adding to the portfolio’s exposure to the broader AI infrastructure trend.
That’s a wrap for this week, thanks for reading – may your portfolio stay green and your dividends steady. See you next time!