Items that may only interest or educate me ….
Canadian Economic news, US Economic news, World’s second largest economy stumbles, Robotaxis move among us, …
While my initial intention was to primarily focus on the Canadian and American economies, it’s important to recognize that the global economic landscape is interconnected. Recent turbulence in the world’s second-largest economy, China, has the potential to reverberate and impact both Canada and the US. When China, a major economic player, faces challenges, it can trigger a cascade of effects that extend beyond its borders.
The reduced demand from Chinese consumers can directly influence Canadian and American products, leading to decreased exports. Considering China’s significant role as the world’s largest exporter, any slowdown in its manufacturing sector could trigger supply chain disruptions, contributing to price hikes and potentially fueling inflation. This interconnectedness is why I expanded my coverage this week to include updates on three economies, rather than just the Canadian and American ones.
Understanding these global economic dynamics is crucial for us as investors. Grasping the bigger picture in which economic events unfold is essential to comprehend the influence they can have on investment decisions and overall financial outcomes. Next week, I will return to our regular focus on the Canadian and American economies.
Canadian Economic news
In June, Canada recorded a substantial international trade deficit, widening the shortfall to C$3.73 billion. This deficit marks the largest since October 2020 and exceeded analysts’ projections of a C$2.9 billion deficit.
The combination of inflation pressures and diminished global demand contributed to a monthly decline of 2.2% in exports, following a 3.0% drop in May. Among the eleven subsectors, nine registered lower figures, with the Metal and Non-Metallic Mineral Products subsector witnessing the most significant decrease. Aircraft components and consumer goods were the only subsectors to report increases. Looking at the yearly perspective, exports experienced a 12.3% decrease, with six of the subsectors posting declines. Exports were dragged lower by energy products, while the Motor Vehicles and Parts subsector posted the biggest gain.
Turning to imports, there was a 0.5% decrease from May and a 2.2% decline on a yearly basis. In the month-to-month assessment, seven of the eleven subsectors displayed lower figures. Energy products witnessed the most substantial decline, whereas Metal and Non-Metallic Mineral Products experienced the largest increase. A similar pattern emerged on an annual basis, with energy products demonstrating the most significant decline, and Metal and Non-Metallic Mineral Products recording the largest increase.
US Economic news
Inflation
The Consumer Price Index (CPI) data for July revealed inflation slowing, but still above the Federal Reserve’s (Fed) target of 2%. On a monthly basis, consumer prices climbed 0.2%, mirroring the 0.2% uptick observed in June. On an annual basis, CPI surged 3.2%, marking the first annual increase in over a year. While this surpassed June’s 3.0% increase, it fell short of analysts’ predictions of a 3.3% rise.
The Fed’s preferred measure of inflation, core CPI, which excludes food and energy prices, also rose 0.2% in July. On an annual basis, Core CPI increased 4.7%, the smallest increase since October 2021. The increase was slightly lower than June’s 4.8% and once again lower than analysts anticipated 4.8%. However, core inflation is still above 4%, which is well above the Fed’s target.
On a yearly basis, shelter, which includes mortgages, rent, utilities and other housing related expenses, was by far the largest contributor to the monthly rise in prices, accounting for over 90% of the total increase. The biggest decline was in energy commodities such as gasoline.
Despite the deceleration in inflation, the rate remains higher than the Fed’s goal of 2% and the current rate is slightly higher than a year ago. Typically, when inflation falls, the unemployment rate rises. However, that has not been the case as the labor market remains “very tight.” As long as there are more jobs available than people looking for work, wages will continue to rise, which will put upward pressure on prices.
On one hand, falling inflation would suggest that the Fed does not need to raise the benchmark interest rate further. However, a look beyond the headline CPI number at the core CPI shows that core inflation remains high. Combined with a tight labor market, this suggests that the Fed may lean towards another interest rate increase in September to drive down core CPI.
Overall, the July CPI data suggests that inflation is still a problem, but it is starting to slow. Analysts are predicting the Fed will maintain the current interest rate of 5.5% at their next meeting in September. However, those same analysts are split over what the Fed will do at following sessions. The Fed itself has suggested another increase may be necessary to further cool inflation, but they will follow the data.
Consumer Sentiment
The University of Michigan’s Consumer Sentiment Index for August presented an initial reading of 71.2, showing a slight decline from July’s reading of 71.6. On a monthly basis, consumer sentiment decreased by 0.6% compared to July. However, there was a sizable 22.3% increase on an annual basis and a significant rise of nearly 42% from the all-time low recorded in June 2022. To throw water on the better-than-expected CSI, the Fed signaled that doesn’t mean they are finished with interest rate increases.
World’s second largest economy stumbles
Data has revealed a significant decline in China’s imports for July, marking a 12.4% drop compared to the same period a year ago. This decline exceeded analysts’ expectations of a 5% decrease. This contraction represents the most substantial drop since the country’s shutdown in January 2020 during the initial Covid-19 outbreak. Simultaneously, exports also experienced a decline of 14.5%, surpassing the anticipated 12.5% decrease. This rapid decline in exports is the sharpest since the onset of the Covid-19 pandemic. The combination of reduced domestic consumption and weakened global demand for Chinese goods has created mounting pressure on the government to introduce new stimulus measures aimed at reviving demand.
The ramifications of this weakened demand have translated into sluggish growth for the world’s second-largest economy. Consequently, concerns have arisen that China might be embarking on an extended period of slow economic growth. The anticipated economic rebound following the country’s emergence from its Covid-19-induced shutdown has yet to materialize, leaving analysts apprehensive about the prospect of a lackluster Chinese economy failing to contribute to an upswing in global demand or bolster commodity prices.
Robotaxis moves among us
Alphabet’s (NASD: GOOGL) Waymo and General Motors’ (NYSE: GM) Cruise have received permission from California regulators to operate their robotaxis 24/7 in San Francisco. This is a historic milestone for the development of autonomous vehicles, and it will be interesting to see how these services are received by the public.
Both companies currently operate 300 or fewer robotaxis in San Francisco, but they are expected to deploy more vehicles in the coming months. It is also unclear how much these robotaxis will cost to ride, compared to traditional taxis. However, one thing is for sure: all eyes will be on San Francisco to see how robotaxis impact consumers and traffic safety.
Now that we have covered three economy and the rise of robotaxis, let’s see what happened this past week….
Weekly Market Review
Monday: A Fed official said she still believed higher interest rates are necessary to get US inflation back to their 2% target. Another Fed member said he felt interest rates could begin to fall in early 2024. Investors chose to focus on the later, sending the markets higher.
In Canada, the Canadian markets were closed for a Civic Holiday.
In the US, the Nasdaq Composite Index (Nasdaq) and the S&P 500 Index (S&P) snapped their four day losing streaks, joining and the Dow Jones Industrial Average (DJIA) in positive territory. In trading, all sectors ended higher, led by Industrials and Consumer Cyclicals with Utilities and Energy bringing up the rear.
Tuesday: The markets ended lower on concerns of weak economic data from China suggesting the country’s recovery is weaker than expected. In morning trading all four indexes dropped sharply but slowly recovered to pare losses by the end of the day.
In Canada, the news about China’s economy dragged the resource heavy Toronto Stock Exchange Composite Index (TSX) down sharply in the morning but the TSX was able to recover much of those losses by the end of the day. In the Canadian sectors, the Energy and Consumer Staples sectors were the only sectors to advance, while Technology and Consumer Cyclicals decreased the most.
In the US, ten small and mid size US regional banks had their credit ratings downgraded by Moody’s (one of the three global credit ratings agencies). Moody’s also warned it could lower credit ratings for a few of the biggest American banks, sparking a wave of concern about the American financial system. In the American sectors, Healthcare and Energy posted the biggest gains while Financials (where banks reside) and Technology had the biggest declines.
Wednesday: Mixed results today, with the TSX advancing and the American indexes stumbling. Investors are waiting for tomorrow’s US inflation report to get a sense of which way the markets will move and what it means for the Fed’s battle with inflation. Weighing on the markets was news China’s consumer sector fell into deflation in July, sparking concerns China’s economic struggles could have global repercussions. Oil prices jumped on news of a sharp drawdown in US oil reserves.
In Canada, higher oil prices lifted the energy sector which in turn lifted the resource heavy TSX. In trading, Telecommunications Services and Utilities were the big winners, while Consumer Cyclicals and Healthcare were the big losers on the day.
In the USA, concerns flared up over the US banking system after yesterday’s credit rating downgrades of ten mid size banks, weighing on the financial sector. At the consumer level, credit card borrowing hit a record high, possibly keeping inflation above the 2% target. In the American sectors, Energy and Telecommunications Services led all sectors, with Technology and Consumer Cyclicals suffering the biggest declines.
Thursday: All four indexes ended the day slightly higher following the latest US inflation report that showed inflation was up for July but less than feared. Investors are now concerned about the long-term prospects for the world’s largest economy in the US if interest rates stay elevated for an extended period.
In Canada, the TSX tracked the American indexes for most of the day until the end when it zigged up while the American indexes zagged down. In trading on Bay Street, Technology and Telecommunications Services had the biggest upwards moves, while Consumer Cyclicals and Basic Materials (miners and fertilizer manufacturers) had the biggest downwards moves.
In the US, after an impressive opening the indexes surrendered most of their early gains to end the day essentially flat. As analysts and investors took a deeper look at the latest inflation report, they saw core inflation remained high at 4.7%, more than twice the Fed’s target of 2%. in trading on Wall Street, Telecommunications Services and Consumer Cyclicals led the gainers, while Utilities and Basic Materials declined the most.
Friday: A mixed bag for the indexes with the value-oriented indexes, the TSX and DJIA, ending higher, while the growth-oriented Nasdaq and S&P both ended lower. All four indexes bounced around throughout the day.
In Canada, higher gold and oil prices drove the resource heavy TSX upward. As a result, the Basic Materials and Energy sectors advanced the most of the Canadian sectors. Not so lucky were the Consumer Cyclicals and Utilities sectors which suffered the biggest declines.
In the US, stronger than expected Producer Price Index (PPI) data raised concerns of creeping inflation and another rate hike. The fears of another rate hike tripped up the rate sensitive technology sector. Consequently, the Technology sector dropped the most, followed by the other interest rate sensitive sector, Consumer Cyclicals. Posting the biggest daily gains were Energy and Utilities.
Weekly Market and Portfolio Review
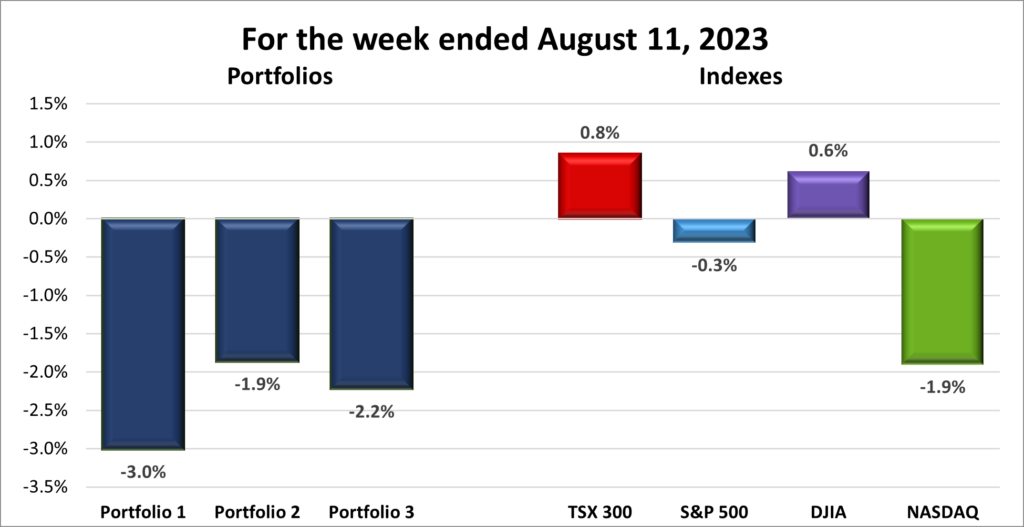
For the week, the TSX (SPTSX) advanced 0.8%, the S&P 500 (SPX) fell 0.3%, the DJIA (INDU) gained 0.6% and the Nasdaq (CCMP) sank 1.9%.
![]()
![]() It was a week of mixed outcomes for the indexes, with the value-oriented TSX and DJIA managing to end the week on a positive note, while the growth-focused S&P and Nasdaq declined. After a bullish run through June and July, the beginning of August has proven to be more challenging. The S&P and the Nasdaq recorded their second consecutive weekly losses, marking the first time in 2023 where the Nasdaq saw back-to-back weekly declines.
It was a week of mixed outcomes for the indexes, with the value-oriented TSX and DJIA managing to end the week on a positive note, while the growth-focused S&P and Nasdaq declined. After a bullish run through June and July, the beginning of August has proven to be more challenging. The S&P and the Nasdaq recorded their second consecutive weekly losses, marking the first time in 2023 where the Nasdaq saw back-to-back weekly declines.
Several factors contributed to the week’s performance. Concerns about China’s slower economic growth, credit rating downgrades for ten midsize American banks, statements from the Federal Reserve about the possibility of higher interest rates, and mixed inflation data all played roles in shaping the market’s direction. The combination of elevated interest rates and investors taking profits from a strong July collectively drove the S&P and Nasdaq down.
On a positive note, the TSX and DJIA managed to rise, propelled by the upward climb of gold and oil prices. Oil prices achieved their longest streak of weekly gains since early 2022. This was the result of record demand in June, coupled with production cutbacks by key suppliers Saudi Arabia and Russia. Moreover, the International Energy Agency’s (IEA) projection of sustained high demand and a tightening supply landscape in the upcoming months also bolstered oil prices.
![]() So far, I am not liking August. This is the second week in a row all three portfolios have lost more than 1% or more of their value. Its starting to feel like 2022 all over again. ☹ This week is worse than last week as Portfolios 1 and 3 fell more than the Nasdaq, the worst performer of the indexes. Portfolio 2 did not fair much better, dropping as much as the Nasdaq.
So far, I am not liking August. This is the second week in a row all three portfolios have lost more than 1% or more of their value. Its starting to feel like 2022 all over again. ☹ This week is worse than last week as Portfolios 1 and 3 fell more than the Nasdaq, the worst performer of the indexes. Portfolio 2 did not fair much better, dropping as much as the Nasdaq.
The mega cap technology companies that had lifted the portfolios for most of the year declined as investors took profits and concerns of higher interest rates weighed on the markets in general, and the interest rate sensitive technology companies in particular. Portfolio 1 was also stung by a bad week for semiconductor companies, two weeks after I added two chip companies to the portfolio. ☹ To paraphrase Marvin the Martian, not a good week, not a good week indeed!
Companies on the Radar
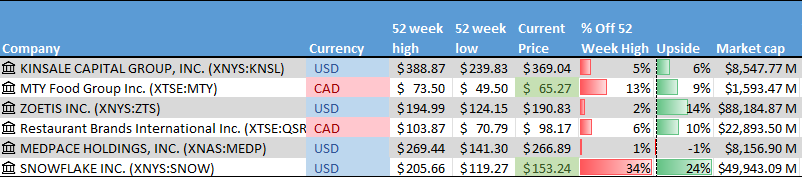
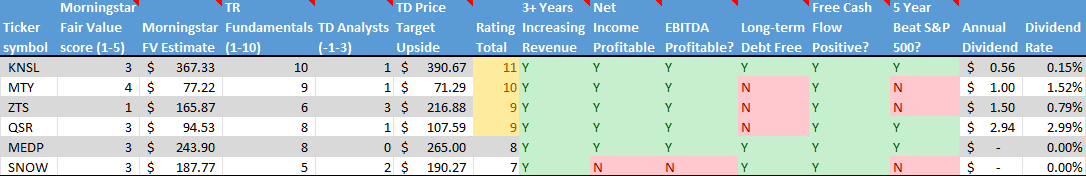
 After clearing off my radar list last week, six new companies appeared on it this past week. A variety of Canadian and American companies in several different sectors. All sound interesting and have done well in the past. All have been growing their business and their share prices. Once the second quarter earnings season ends, I should have some time to take a closer look at these companies listed below.
- Kinsale Capital Group, (NYSE: KNSL): A medium cap American financial services company. They provide specialty insurance in the US.
- MTY Food Group Inc. (TSE: MTY): A small cap Canadian consumer cyclical company that operates and franchises quick service and casual dining restaurants throughout North America and internationally.
- Zoetis Inc. (NYSE: ZTS): A large cap American healthcare company, focused on animal health medicines and devices.
- Restaurant Brands International Inc. (TSE: QSR): A large cap Canadian consumer cyclical company that operates in the North American quick serve restaurant industry. The company owns Tim Horton’s, Burger King, and Popeye’s Louisiana Kitchen among others.
- Medpace Holdings, Inc. (NASD: MEDP): A medium cap American healthcare company. The company provides clinical research-based drug and medical device development services to other healthcare companies in the development services.
- Snowflake, Inc. (NYSE: SNOW): A large cap American technology company that provides a data cloud environment that enables customers to consolidate all their databases into a single source to enable better insights.
The Radar Check was last updated August 11, 2023.
Portfolio Update
Portfolio 1
Portfolio 1 for the week ended August 11, 2023: DOWN ![]()
- Progyny (NASD: PGNY) said it will be expanding its managed reproductive health network to include providers of menopause care. The service will be available in all 50 states.
- PayPal (NASD: PYPL) became the first major financial technology to launch a US dollar stablecoin for payments and transfers. This could provide a major boost to the slow adoption of digital tokens for payments. It will be interesting how this is received by the Fed and Securities and Exchange Commission. Stablecoins are crypto tokens whose monetary value is pegged to a stable asset, such as the US dollar, to protect from wild volatility.
- Berkshire Hathaway (NYSE: BRK.B) posted its highest ever quarterly operating profit, with a nearly $36 billion overall profit. Not bad! 😊
- Nvidia (NASD: NVDA) announced the latest version of their Grace Hopper superchip. The chip is a combination of Nvidia’s powerful H100 graphics processing units (GPU) with an Nvidia designed central processor. This version is designed to provide a boost to generative artificial intelligence (AI) applications.
- Algonquin Power & Utilities Corp. (TSX: AQN) announced they will pursue a sale of their Renewable Energy Group, leaving Algonquin as a regulated utility with diversified assets in several regions.
- The National Highway Traffic Safety Administration (NHTSA) will take a closer look at a recent fatal accident involving a Tesla (NASD: TSLA) electric vehicle (EV). The Model Y is suspected of being driven by Tesla’s advanced driver assistance system when it struck the side of a tractor trailer as the semi trailer was turning onto the highway. The NHTSA has started more than three dozen investigations over the last few years into Tesla involved accidents where their driver assistance system has been involved.
- Amazon (NASD: AMZN) has decided to eliminate 27 of its 30 private clothing brands as it attempts to cut costs and avoid the crosshairs of the US Federal Trade Commission (FTC).
Activity
Liberty Media’s Formula 1 tracking (NASD: FWONK) spun out its Liberty Live Group unit. The new public company, Liberty Live, owns and operates a live entertainment company. The new company trades under the ticker (NASD: LLYVK).
Dividends
Dividends Received this week for the following companies:
Companies followed by DRIP (Dividend Re-Investment Plan) indicate additional shares were purchased with the dividend. Any cash leftover was added to the cash balance.
No dividends this past week.
Quarterly Reports
Berkshire Hathaway Inc.
All currency listed in millions of US dollars, except for per share data.
Selected highlights from their second quarter 2023 financial results on August 5, 2023
- Revenue of $92,503 for the three months ended June 30, compared to $76,201 for the same period in 2022. A decrease of over 21%.
- Net income of $36,199 for the three months ended June 30, compared to a net loss of $43,242 in the same period in 2022.
- Diluted earnings per ordinary share of $16.52 for the three months ended June 30, compared to a loss of $19.78 per share for the same period in 2022.
- Revenue of $177,896 for the six months ended June 30, compared to $147,044 for the same period in 2022. A decrease of almost 21%.
- Net earnings of $71,956 for the six months ended June 30, compared to a net loss of $37,537 in the same period in 2022.
- Diluted earnings per ordinary share of $32.77 for the six months ended June 30, compared to a loss of $17.22 per share for the same period in 2022.
Skyworks Solutions, Inc.
All currency listed in millions of US dollars, except for per share data.
Selected highlights from their third quarter 2023 financial results on August 7, 2023
- Revenue of $1,071.2 for the three months ended June 30, compared to $1,232.6 for the same period in 2022. A decrease of over 13%.
- Net income of $195.8 for the three months ended June 30, compared to net income of $267.3 in the same period in 2022.
- Diluted earnings per ordinary share of $1.22 for the three months ended June 30, compared to earnings of $1.66 per share for the same period in 2022.
- Revenue of $3,553.6 for the six months ended June 30, compared to $4,078.6 for the same period in 2022. A decrease of almost 13%.
- Net earnings of $738 for the six months ended June 30, compared to net earnings of $973 in the same period in 2022.
- Diluted earnings per ordinary share of $4.63 for the six months ended June 30, compared to earnings of $5.93 per share for the same period in 2022.
Marqueta, Inc.
All currency listed in thousands of US dollars, except for per share data.
Selected highlights from their second quarter 2023 financial results on August 8, 2023
- Revenue of $231,115 for the three months ended June 30, compared to $186,678 for the same period in 2022. An increase of almost 24%.
- Net loss of $59,797 for the three months ended June 30, compared to a net loss of $44,688 in the same period in 2022.
- Diluted loss per ordinary share of $0.11 for the three months ended June 30, compared to a loss of $0.08 per share for the same period in 2022.
- Revenue of $448,456 for the six months ended June 30, compared to $352,780 for the same period in 2022. An increase of over 27%.
- Net loss of $127,598 for the six months ended June 30, compared to a net loss of $105,286 in the same period in 2022.
- Diluted loss per ordinary share of $0.24 for the six months ended June 30, compared to a loss of $0.19 per share for the same period in 2022.
kneat.com, Inc.
All currency listed in Canadian dollars, except for per share data.
Selected highlights from their second quarter 2023 financial results on August 8, 2023
- Revenue of $8,039,239 for the three months ended June 30, compared to $5,548,002 for the same period in 2022. An increase of almost 45%.
- Net loss of $5,398,711 for the three months ended June 30, compared to net loss of $3,633,888 in the same period in 2022.
- Diluted loss per ordinary share of $0.07 for the three months ended June 30, compared to a loss of $0.05 per share for the same period in 2022.
- Revenue of $16,004,147 for the six months ended June 30, compared to $10,747,604 for the same period in 2022. An increase of almost 49%.
- Net loss of $7,873,068 for the six months ended June 30, compared to a net loss of $7,060,148 in the same period in 2022.
- Diluted loss per ordinary share of $0.10 for the six months ended June 30, compared to a loss of $0.09 per share for the same period in 2022.
Rivian Automotive, Inc.
All currency listed in millions of US dollars, except for per share data.
Selected highlights from their second quarter 2023 financial results on August 8, 2023
- Revenue of $1,533 for the three months ended June 30, compared to $364 for the same period in 2022. An increase of almost 308%.
- Net loss of $1,195 for the three months ended June 30, compared to a net loss of $1,712 in the same period in 2022.
- Diluted loss per ordinary share of $1.27 for the three months ended June 30, compared to a loss of $1.89 per share for the same period in 2022.
- Revenue of $1,782 for the six months ended June 30, compared to $459 for the same period in 2022. An increase of over 388%.
- Net loss of $2,544 for the six months ended June 30, compared to a net loss of $3,305 in the same period in 2022.
- Diluted loss per ordinary share of $2.72 for the six months ended June 30, compared to a loss of $3.66 per share for the same period in 2022.
GDI Integrated Facility Services Inc.
All currency listed in millions of Canadian dollars, except for per share data.
Selected highlights from their second quarter 2023 financial results on August 8, 2023
- Revenue of $609 for the three months ended June 30, compared to $526 for the same period in 2022. An increase of almost 16%.
- Net income of $1 for the three months ended June 30, compared to net income of $10 in the same period in 2022.
- Diluted earnings per ordinary share of $0.04 for the three months ended June 30, compared to earnings of $0.40 per share for the same period in 2022.
- Revenue of $1,200 for the six months ended June 30, compared to $1,021 for the same period in 2022. An increase of over 17%.
- Net earnings of $5 for the six months ended June 30, compared to net earnings of $17 in the same period in 2022.
- Diluted earnings per ordinary share of $0.19 for the six months ended June 30, compared to earnings of $0.69 per share for the same period in 2022.
Datadog, Inc.
All currency listed in thousands of US dollars, except for per share data.
Selected highlights from their second quarter 2023 financial results on August 8, 2023
- Revenue of $509,460 for the three months ended June 30, compared to $406,138 for the same period in 2022. An increase of over 25%.
- Net loss of $3,969 for the three months ended June 30, compared to a net loss of $4,879 in the same period in 2022.
- Diluted loss per ordinary share of $0.01 for the three months ended June 30, compared to a loss of $0.02 per share for the same period in 2022.
- Revenue of $991,174 for the six months ended June 30, compared to $769,168 for the same period in 2022. An increase of over 28%.
- Net loss of $28,055 for the six months ended June 30, compared to net earnings of $4,859 in the same period in 2022.
- Diluted loss per ordinary share of $0.09 for the six months ended June 30, compared to earnings of $0.01 per share for the same period in 2022.
Global-E Online Ltd.
All currency listed in thousands of US dollars, except for per share data.
Selected highlights from their second quarter 2023 financial results on August 8, 2023
- Revenue of $133,309 for the three months ended June 30, compared to $87,305 for the same period in 2022. An increase of almost 83%.
- Net loss of $35,533 for the three months ended June 30, compared to a net loss of $48,797 in the same period in 2022.
- Diluted loss per ordinary share of $0.22 for the three months ended June 30, compared to a loss of $0.31 per share for the same period in 2022.
- Revenue of $250,940 for the six months ended June 30, compared to $163,628 for the same period in 2022. An increase of over 53%.
- Net loss of $78,616 for the six months ended June 30, compared to a net loss of $102,383 in the same period in 2022.
- Diluted loss per ordinary share of $0.48 for the six months ended June 30, compared to a loss of $0.66 per share for the same period in 2022.
Celsius Holdings, Inc.
All currency listed in thousands of US dollars, except for per share data.
Selected highlights from their second quarter 2023 financial results on August 8, 2023
- Revenue of $325,883 for the three months ended June 30, compared to $154,020 for the same period in 2022. An increase of almost 212%.
- Net income of $51,509 for the three months ended June 30, compared to net income of $9,158 in the same period in 2022.
- Diluted earnings per ordinary share of $0.52 for the three months ended June 30, compared to earnings of $0.12 per share for the same period in 2022.
- Revenue of $585,822 for the six months ended June 30, compared to $287,408 for the same period in 2022. An increase of over 203%.
- Net earnings of $92,736 for the six months ended June 30, compared to net earnings of $15,838 in the same period in 2022.
- Diluted earnings per ordinary share of $0.92 for the six months ended June 30, compared to earnings of $0.20 per share for the same period in 2022.
Nuvei Corporation
All currency listed in thousands of US dollars, except for per share data.
Selected highlights from their second quarter 2023 financial results on August 9, 2023
- Revenue of $307,026 for the three months ended June 30, compared to $211,294 for the same period in 2022. An increase of over 45%.
- Net income of $11,617 for the three months ended June 30, compared to net income of $35,083 in the same period in 2022.
- Diluted earnings per ordinary share of $0.07 for the three months ended June 30, compared to earnings of $0.23 per share for the same period in 2022.
- Revenue of $563,524 for the six months ended June 30, compared to $425,838 for the same period in 2022. An increase of over 32%.
- Net earnings of $3,328 for the six months ended June 30, compared to net earnings of $39,597 in the same period in 2022.
- Diluted earnings per ordinary share of $0.00 for the six months ended June 30, compared to earnings of $0.25 per share for the same period in 2022.
TradeDesk, Inc.
All currency listed in thousands of US dollars, except for per share data.
Selected highlights from their second quarter 2023 financial results on August 9, 2023
- Revenue of $464,254 for the three months ended June 30, compared to $376,962 for the same period in 2022. An increase of over 23%.
- Net income of $32,939 for the three months ended June 30, compared to a net loss of $19,073 in the same period in 2022.
- Diluted earnings per ordinary share of $0.07 for the three months ended June 30, compared to a loss of $0.04 per share for the same period in 2022.
- Revenue of $847,057 for the six months ended June 30, compared to $692,285 for the same period in 2022. An increase of over 22%.
- Net earnings of $42,265 for the six months ended June 30, compared to a net loss of $33,671 in the same period in 2022.
- Diluted earnings per ordinary share of $0.08 for the six months ended June 30, compared to a loss of $0.07 per share for the same period in 2022.
Magnite, Inc.
All currency listed in thousands of US dollars, except for per share data.
Selected highlights from their second quarter 2023 financial results on August 9, 2023
- Revenue of $152,543 for the three months ended June 30, compared to $137,780 for the same period in 2022. An increase of almost 11%.
- Net loss of $73,889 for the three months ended June 30, compared to a net loss of $24,954 in the same period in 2022.
- Diluted loss per ordinary share of $0.54 for the three months ended June 30, compared to a loss of $0.19 per share for the same period in 2022.
- Revenue of $282,693 for the six months ended June 30, compared to $255,855 for the same period in 2022. An increase of over 10%.
- Net loss of $172,621 for the six months ended June 30, compared to a net loss of $69,547 in the same period in 2022.
- Diluted loss per ordinary share of $1.27 for the six months ended June 30, compared to a loss of $0.53 per share for the same period in 2022.
Crew Energy Inc.
All currency listed in thousands of Canadian dollars, except for per share data.
Selected highlights from their second quarter 2023 financial results on August 9, 2023
- Revenue of $69,744 for the three months ended June 30, compared to $182,984 for the same period in 2022. A decrease of almost 62%.
- Net income of $33,729 for the three months ended June 30, compared to net income of $88,695 in the same period in 2022.
- Diluted earnings per ordinary share of $0.21 for the three months ended June 30, compared to earnings of $0.55 per share for the same period in 2022.
- Revenue of $182,556 for the six months ended June 30, compared to $236,672 for the same period in 2022. A decrease of almost 23%.
- Net earnings of $75,083 for the six months ended June 30, compared to net earnings of $87,318 in the same period in 2022.
- Diluted earnings per ordinary share of $0.46 for the six months ended June 30, compared to earnings of $0.54 per share for the same period in 2022.
Docebo Inc.
All currency listed in thousands of US dollars, except for per share data.
Selected highlights from their second quarter 2023 financial results on August 10, 2023
- Revenue of $43,594 for the three months ended June 30, compared to $34,936 for the same period in 2022. An increase of almost 25%.
- Net loss of $5,674 for the three months ended June 30, compared to net income of $2,103 in the same period in 2022.
- Diluted loss per ordinary share of $0.17 for the three months ended June 30, compared to earnings of $0.06 per share for the same period in 2022.
- Revenue of $85,053 for the six months ended June 30, compared to $66,991 for the same period in 2022. An increase of almost 27%.
- Net loss of $4,429 for the six months ended June 30, compared to a net loss of $4,856 in the same period in 2022.
- Diluted loss per ordinary share of $0.13 for the six months ended June 30, compared to a loss of $0.15 per share for the same period in 2022.
WELL Health Technologies Corp.
All currency listed in thousands of Canadian dollars, except for per share data.
Selected highlights from their second quarter 2023 financial results on August 10, 2023
- Revenue of $170,922 for the three months ended June 30, compared to $140,326 for the same period in 2022. An increase of almost 22%.
- Net loss of $2,016 for the three months ended June 30, compared to a net loss of $1,244 in the same period in 2022.
- Diluted loss per ordinary share of $0.03 for the three months ended June 30, compared to a loss of $0.03 per share for the same period in 2022.
- Revenue of $340,347 for the six months ended June 30, compared to $266,834 for the same period in 2022. An increase of over 27%.
- Net loss of $12,643 for the six months ended June 30, compared to net earnings of $4,020 in the same period in 2022.
- Diluted loss per ordinary share of $0.09 for the six months ended June 30, compared to a loss of $0.07 per share for the same period in 2022.
indie semiconductor, Inc.
All currency listed in thousands of US dollars, except for per share data.
Selected highlights from their second quarter 2023 financial results on August 10, 2023
- Revenue of $52,108 for the three months ended June 30, compared to $25,755 for the same period in 2022. An increase of almost 202%.
- Net loss of $13,563 for the three months ended June 30, compared to a net loss of $5,304 in the same period in 2022.
- Diluted loss per ordinary share of $0.09 for the three months ended June 30, compared to a loss of $0.04 per share for the same period in 2022.
- Revenue of $92,560 for the six months ended June 30, compared to $47,754 for the same period in 2022. An increase of almost 94%.
- Net loss of $95,529 for the six months ended June 30, compared to net earnings of $8,402 in the same period in 2022.
- Diluted loss per ordinary share of $0.63 for the six months ended June 30, compared to earnings of $0.04 per share for the same period in 2022.
Algonquin Power & Utilities Corp.
All currency listed in millions of US dollars, except for per share data.
Selected highlights from their second quarter 2023 financial results on August 10, 2023
- Revenue of $627,871 for the three months ended June 30, compared to $619,385 for the same period in 2022. An increase of over 1%.
- Net loss of $262,321 for the three months ended June 30, compared to a net loss of $62,322 in the same period in 2022.
- Diluted loss per ordinary share of $0.37 for the three months ended June 30, compared to a loss of $0.05 per share for the same period in 2022.
- Revenue of $1,406,498 for the six months ended June 30, compared to $1,352,622 for the same period in 2022. An increase of almost 4%.
- Net loss of $12,711 for the six months ended June 30, compared to a net loss of $9,724 in the same period in 2022.
- Diluted earnings per ordinary share of $0.02 for the six months ended June 30, compared to earnings of $0.08 per share for the same period in 2022.
Trisura Group Ltd.
All currency listed in thousands of Canadian dollars, except for per share data.
Selected highlights from their second quarter 2023 financial results on August 10, 2023
- Revenue of $664,420 for the three months ended June 30, compared to $464,643 for the same period in 2022. An increase of almost 43%.
- Net income of $26,807 for the three months ended June 30, compared to net income of $20,943 in the same period in 2022.
- Diluted earnings per ordinary share of $0.57 for the three months ended June 30, compared to earnings of $0.50 per share for the same period in 2022.
- Revenue of $1,303,520 for the six months ended June 30, compared to $868,312 for the same period in 2022. An increase of over 50%.
- Net earnings of $40,783 for the six months ended June 30, compared to net earnings of $44,281 in the same period in 2022.
- Diluted earnings per ordinary share of $0.87 for the six months ended June 30, compared to earnings of $1.05 per share for the same period in 2022.
Portfolio 2
Portfolio 2 for the week ended August 11, 2023: DOWN ![]()
- It appears Microsoft (NASD: MSFT) will get Activision (NASD: ATVI) after all. The US FTC withdrew their case against the two companies, clearing the way for the acquisition to proceed.
Separately, the US Department of Homeland Security’s Cyber Safety Review Board will investigate a recent breach of Microsoft’s security software that resulted in the theft of emails from various US government agencies.
Activity
No significant activity to report this week.
Dividends
Dividends Received this week for the following companies:
Companies followed by DRIP (Dividend Re-Investment Plan) indicate additional shares were purchased with the dividend. Any cash leftover was added to the cash balance.
No dividends this past week.
Quarterly Reports
Kneat.com
See report under Portfolio 1.
Take-Two Interactive Software, Inc.
All currency listed in millions of US dollars, except for per share data.
Selected highlights from their first quarter 2024 financial results on August 8, 2023
- Revenue of $1,284.7 for the three months ended July 1, compared to $1,1019.2 for the same period in 2022. An increase of over 16%.
- Net loss of $206 for the three months ended July 1, compared to a net loss of $104 in the same period in 2022.
- Diluted loss per ordinary share of $1.22 for the three months ended July 1, compared to a loss of $0.76 per share for the same period in 2022.
Crew Energy Inc.
See report under Portfolio 1.
The Walt Disney Company
All currency listed in millions of US dollars, except for per share data.
Selected highlights from their third quarter 2023 financial results on August 9, 2023
- Revenue of $22,330 for the three months ended July 1, compared to $21,504 for the same period in 2022. An increase of almost 4%.
- Net loss of $153 for the three months ended July 1, compared to net income of $1,502 in the same period in 2022.
- Diluted loss per ordinary share of $0.25 for the three months ended July 1, compared to earnings of $0.77 per share for the same period in 2022.
- Revenue of $67,657 for the nine months ended July 1, compared to $65,572 for the same period in 2022. An increase of over 3%.
- Net earnings of $2,696 for the nine months ended July 1, compared to net earnings of $2,983 in the same period in 2022.
- Diluted earnings per ordinary share of $1.14 for the nine months ended July 1, compared to earnings of $1.63 per share for the same period in 2022.
Supremex Inc.
All currency listed in Canadian dollars.
Selected highlights from their second quarter 2023 financial results on August 10, 2023
- Revenue of $71,666,414 for the three months ended June 30, compared to $62,518,245 for the same period in 2022. An increase of almost 44%.
- Net income of $2,112,548 for the three months ended June 30, compared to net income of $7,363,953 in the same period in 2022.
- Diluted earnings per ordinary share of $0.08 for the three months ended June 30, compared to earnings of $0.28 per share for the same period in 2022.
- Revenue of $160,088,048 for the six months ended June 30, compared to $125,787,066 for the same period in 2022. An increase of over 27%.
- Net earnings of $11,609,041 for the six months ended June 30, compared to net earnings of $13,665,807 in the same period in 2022.
- Diluted earnings per ordinary share of $0.45 for the six months ended June 30, compared to earnings of $0.52 per share for the same period in 2022.
Portfolio 3
Portfolio 3 for the week ended August 11, 2023: DOWN ![]()
- Magnite (NASD: MGNI) has partnered with private company Attain to provide video ad buyers with measurement capabilities based on Attain’s live data.
- In 2020, Shopify (TSX: SHOP) pre purchased carbon removal credits from climate start-up Running Tide. This past week Shopify finally received those credits. To remove carbon, Running Tide took 1,000 metric tons of waste wood that was scheduled to be burned, coated it with limestone and placed it on the ocean floor, 306 kilometres south of Iceland. By coating the wood with limestone, it will minimize ocean acidification from the decomposing wood. The result was the removal of 275 metric tones of carbon dioxide. Thumbs up to all parties.
Activity
No significant activity to report this week.
Dividends
Dividends Received this week for the following companies:
Companies followed by DRIP (Dividend Re-Investment Plan) indicate additional shares were purchased with the dividend. Any cash leftover was added to the cash balance.
No dividends this past week.
Quarterly Reports
GDI Integrated Facility Services Inc.
See report under Portfolio 1.
SmartCentres Real Estate Investment Trust
All currency listed in thousands of Canadian dollars, except for per share data.
Selected highlights from their second quarter 2023 financial results on August 9, 2023
- Revenue of $206,950 for the three months ended June 30, compared to $198,585 for the same period in 2022. An increase of over 4%.
- Net income of $167,902 for the three months ended June 30, compared to net income of $161,997in the same period in 2022.
- Revenue of $417,544 for the six months ended June 30, compared to $401,413 for the same period in 2022. An increase of over 4%.
- Net earnings of $280,763 for the six months ended June 30, compared to net earnings of $532,107 in the same period in 2022.
Fortuna Silver Mines Inc.
All currency listed in thousands of US dollars, except for per share data.
Selected highlights from their second quarter 2023 financial results on August 9, 2023
- Revenue of $158,406 for the three months ended June 30, compared to $167,871 for the same period in 2022. A decrease of almost 6%.
- Net income of $3,472 for the three months ended June 30, compared to net income of $1,679 in the same period in 2022.
- Diluted earnings per ordinary share of $0.01 for the three months ended June 30, compared to earnings of $0.01 per share for the same period in 2022.
- Revenue of $334,059 for the six months ended June 30, compared to $350,200 for the same period in 2022. A decrease of almost 5%.
- Net earnings of $15,326 for the six months ended June 30, compared to net earnings of $28,654 in the same period in 2022.
- Diluted earnings per ordinary share of $0.05 for the six months ended June 30, compared to earnings of $0.10 per share for the same period in 2022.
goeasy Ltd.
All currency listed in thousands of Canadian dollars, except for per share data.
Selected highlights from their second quarter 2023 financial results on August 9, 2023
- Revenue of $302,928 for the three months ended June 30, compared to $251,652 for the same period in 2022. An increase of over 20%.
- Net income of $55,550 for the three months ended June 30, compared to net income of $38,300 in the same period in 2022.
- Diluted earnings per ordinary share of $3.26 for the three months ended June 30, compared to earnings of $2.32 per share for the same period in 2022.
- Revenue of $590,225 for the six months ended June 30, compared to $483,794 for the same period in 2022. An increase of almost 22%.
- Net earnings of $106,986 for the six months ended June 30, compared to net earnings of $64,396 in the same period in 2022.
- Diluted earnings per ordinary share of $6.27 for the six months ended June 30, compared to earnings of $3.86 per share for the same period in 2022.
Alvopetro Energy Ltd.
All currency listed in thousands of Canadian dollars, except for per share data.
Selected highlights from their second quarter 2023 financial results on August 9, 2023
- Revenue of $14,037 for the three months ended June 30, compared to $14,824 for the same period in 2022. A decrease of almost 0.05%.
- Net income of $9,852 for the three months ended June 30, compared to net income of $6,631 in the same period in 2022.
- Diluted earnings per ordinary share of $0.26 for the three months ended June 30, compared to earnings of $0.18 per share for the same period in 2022.
- Revenue of $32,042 for the six months ended June 30, compared to $27,958 for the same period in 2022. An increase of almost 15%.
- Net earnings of $22,054 for the six months ended June 30, compared to net earnings of $17,746 in the same period in 2022.
- Diluted earnings per ordinary share of $0.59 for the six months ended June 30, compared to earnings of $0.49 per share for the same period in 2022.
Magnite, Inc.
See report under Portfolio 1.
Brookfield Asset Management Ltd.
All currency listed in millions of US dollars, except for per share data.
Selected highlights from their second quarter 2023 financial results on August 9, 2023
- Revenue of $548 for the three months ended June 30, compared to $516 for the same period in 2022. An increase of over 6%.
- Net income of $455 for the three months ended June 30, compared to net income of $668 in the same period in 2022.
- Diluted earnings per ordinary share of $0.32 for the three months ended June 30, compared to earnings of $0.31 per share for the same period in 2022.
- Revenue of $2,194 for the six months ended June 30, compared to $1,975 for the same period in 2022. An increase of over 11%.
- Net earnings of $1,870 for the six months ended June 30, compared to net earnings of $2,026 in the same period in 2022.
- Diluted earnings per ordinary share of $1.33 for the six months ended June 30, compared to earnings of $1.22 per share for the same period in 2022.
Brookfield Corporation
All currency listed in millions of US dollars, except for per share data.
Selected highlights from their second quarter 2023 financial results on August 10, 2023
- Revenue of $114 for the three months ended June 30, compared to $23,256 for the same period in 2022. An increase of almost 44%.
- Net income of $109 for the three months ended June 30, compared to net income of $1,475 in the same period in 2022.
- Diluted earnings per ordinary share of $0.28 for the three months ended June 30, compared to earnings of $0.34 per share for the same period in 2022.
- Revenue of $46,965 for the six months ended June 30, compared to $45,138 for the same period in 2022. An increase of over 4%.
- Net earnings of $1,936 for the six months ended June 30, compared to net earnings of $4,435 in the same period in 2022.
- Diluted earnings per ordinary share of $0.08 for the six months ended June 30, compared to earnings of $1.16 per share for the same period in 2022.