
The Bull Turns Four
The current bull market turned four this past week, with the S&P 500 trading near record highs after more than doubling from its October 2022 low. Much of the rally has been fuelled by the artificial intelligence (AI) boom, as massive investment in chips, data centres and related technology has boosted corporate earnings and raised expectations for future growth. A resilient US economy has provided further support, helping stocks climb despite the March 2023 banking turmoil caused by the collapse of Silicon Valley Bank, geopolitical tensions (Russian invasion of Ukraine, the Middle East conflict) and tariff uncertainty. But after four years of impressive gains, can the forces driving this rally continue to deliver?
A bull market is generally defined as a period when stock prices rise at least 20% from a recent low. By that measure, the current bull market officially began on October 12, 2022, when the S&P 500 closed at 3,577. The outlook was far from rosy at the time. Inflation was running high, the Federal Reserve was aggressively raising interest rates, and recession fears were widespread. Yet the economy proved more resilient than many expected, corporate earnings continued to grow, and the launch of ChatGPT in late 2022 sparked a wave of enthusiasm for AI. Nvidia (NASDAQ: NVDA) and other major technology companies became leading drivers of the rally as investors anticipated the enormous potential of the technology.
It hasn’t been a smooth ride. The market has endured several periods of uncertainty, including a sharp sell-off in 2025 that brought the S&P 500 close to bear-market territory. Each time, investors found reasons to return to stocks, encouraged by economic resilience, earnings growth and the potential for AI to transform businesses and improve productivity.
For the bull market to continue, however, companies need to turn the money being poured into AI into sustainable revenue and profits. Spending on chips and data centres can only justify so much optimism if the expected returns don’t materialise. The broader economy also needs to remain reasonably healthy, while inflation and government bond yields must avoid rising enough to put renewed pressure on borrowing costs and stock prices. Another encouraging sign would be broader participation in the rally. The S&P 500’s strength has increasingly depended on a relatively small group of large technology and AI-related companies, while many other stocks have struggled to keep pace.
So how does this bull market compare with previous ones? It’s the 11th bull market since the 1950s, and only the seventh to last at least four years. Its gain of roughly 119% puts it around the middle of the pack, well behind the 401% advance during the 2009–2020 bull market and the 582% gain from 1987 to 2000. These comparisons show that bull markets can last much longer and deliver much larger gains. But they also reinforce an important point: the age of a bull market tells us very little about how much longer it will last.
After four years of impressive gains, it’s understandable that investors might wonder how much further the market can climb. Many strategists believe stocks still have room to run, but concerns about an AI bubble, elevated US Treasury yields and geopolitical uncertainty present hurdles. I don’t pretend to know how much longer this bull market will last. Strong gains and an ageing bull market aren’t, on their own, reasons to assume the end is near. For me, the more important question is whether corporate earnings and the broader economy can continue to support the prices investors are paying for stocks and help me continue building wealth through investing. 😊
While it’s interesting to look at how far the market has come, I’m more interested in what today’s conditions mean for the road ahead. Let’s look at what drove the markets this past week and how it affected my three portfolios.
Items that may only interest or educate me ….
Canadian Economic news, US Economic news, ….
Canadian Economic news
This past week’s key economic data that the Bank of Canada (BoC) considers when deciding whether to raise or lower the interest rate.
Canadian Market Volatility
Canada’s version of the market’s “fear gauge,” the S&P/TSX 60 VIX Index (VIXC), measures expected volatility in Canadian stocks over the next 30 days. Higher readings suggest greater uncertainty, while lower readings point to calmer market conditions.
The VIXC opened the week at 11.91, up from the previous week’s close of 11.19, before climbing above 14 midweek as hotter-than-expected US inflation raised the prospect of further interest rate hikes. It then eased below 13 as Canadian and US government bond yields declined but turned higher again as rising oil prices renewed rate concerns. The index finished the week at 13.56.
Despite the midweek spike, the VIXC remained relatively low, suggesting expectations for near-term volatility in Canadian stocks was still limited. However, its rise from the previous week’s close showed that investor uncertainty had increased.
Note: The VIXC typically trades at lower levels than the VIX, partly because of the different makeup of the Canadian and US markets. The S&P 500 has a much larger weighting in technology, while the TSX has greater exposure to financials, energy, and materials. Because these sectors respond differently to economic conditions and commodity prices, the two indexes can have different levels of expected volatility.
US Economic news
This past week’s key data points that the Federal Reserve (Fed) considers when deciding whether to raise or lower the interest rate.
Consumer Price Index (CPI)
The Labor Department’s Bureau of Labor Statistics (BLS) reported that US inflation accelerated more than expected in September, complicating the Fed’s efforts to bring it under control. Headline CPI rose 0.6% month over month, up from 0.4% in August, pushing the annual rate to 3.7% from 3.4%.
Surging gas and energy prices remained a major source of pressure. Fuel oil (heating oil) prices jumped 15.3% in September and 74.2% over the past year, reflecting higher global oil prices. In contrast, medical care commodities prices fell 0.7% on the month and 1.5% year over year.
Core CPI, which excludes food and energy, rose 0.3% in September. The annual rate climbed to 2.6% from 2.4%, with both figures exceeding analysts’ expectations of 0.2% monthly growth and a 2.5% annual rate.
Shelter costs, which include rent, mortgage-related costs and other housing expenses, are the largest component of CPI and a persistent source of inflation. They rose 0.4% in September, following a 0.3% increase in August, while the annual rate accelerated to 3.2% from 3.0%.
The ongoing conflict involving the US, Israel and Iran has disrupted energy supplies and pushed fuel prices higher. While this can temporarily lift headline inflation, the increase in core inflation makes it harder to dismiss the report as a one-off energy shock.
Overall, this was a disappointing report. With both headline and core inflation accelerating, the Fed has less room to consider cutting interest rates. If higher energy costs spread to other goods and services, inflation could prove more persistent, keeping rates higher for longer and putting further pressure on stock valuations. The key question is whether September was a temporary setback or the start of another sustained rise in inflation.
Retail Sales
The Commerce Department’s Census Bureau reported that US retail sales remained resilient in September, rising 0.8% from August and beating analysts’ expectations of 0.3% growth. Sales were up 6.3% from a year earlier, accelerating from 6.0% in August. However, much of the monthly gain came from higher gasoline prices rather than a broad-based increase in consumer spending.
Gasoline stations led the monthly gains, with sales jumping 6.4%, while miscellaneous store retailers recorded the largest decline, falling 3.0%. Over the past year, gasoline station sales climbed 28.1%, largely reflecting higher fuel prices. Health and personal care stores were the only category to report a monthly decline in sales, down 1.2%.
Core retail sales, which exclude motor vehicles and parts and gasoline stations, offer a clearer view of underlying consumer spending. They rose just 0.2% in September, down from 1.2% in August. Annual growth also slowed to 5.0% from 5.6%.
At first glance, the report suggests consumers are still spending, supporting economic growth. But with higher gasoline prices accounting for much of the monthly gain and core sales growth slowing, the underlying picture is less robust. For the Fed, that creates a difficult balance: resilient consumer spending supports the economy, while the latest inflation report shows that prices are still rising faster than the Fed would like. Together, the two reports give the Fed less reason to consider cutting interest rates.
American Market Volatility
The VIX, often called the market’s “fear gauge,” measures expected volatility in the S&P 500 over the next 30 days. Higher readings signal greater uncertainty, while levels above 20 are typically associated with elevated market volatility.
The VIX opened the week at 15.39, up from the previous Friday’s close of 14.84, and hovered near 15.25 early in the week. Higher-than-expected US inflation raised concerns about further Fed rate hikes, pushing the index above 18. It briefly pulled back as US Treasury yields eased, but surged to an intraday high of 22.31, its highest level in more than four months, as oil prices jumped. The VIX then retreated to close the week at 19.99.
The late-week surge showed how quickly inflation and oil price concerns can unsettle markets. Although the VIX pulled back from its high, it finished well above the previous week’s close and right on the threshold typically associated with elevated volatility, signalling increased investor nervousness heading into the new week.
Weekly Market and Portfolio Review
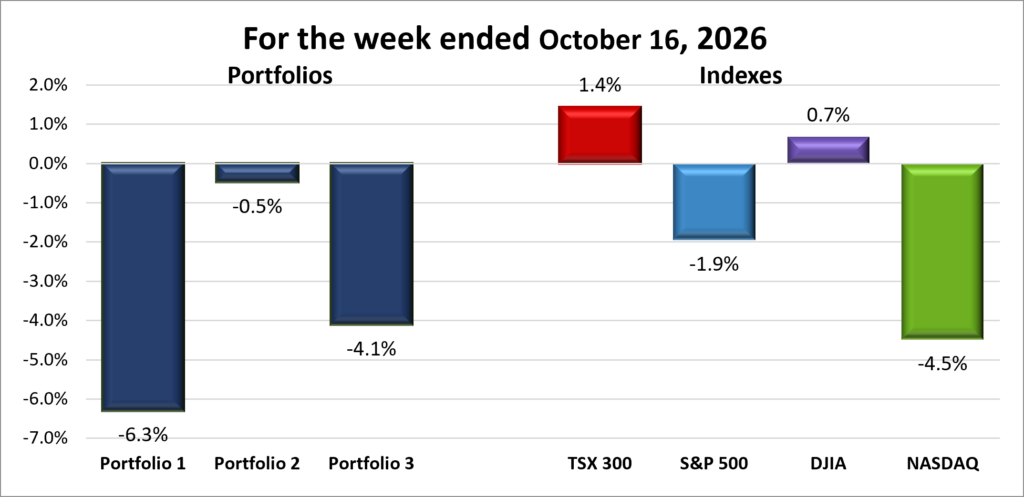
For the week, the TSX (SPTSX) advanced 1.4%, the S&P 500 (SPX) lost 1.9%, the DJIA (INDU) gained 0.7% and the Nasdaq (CCMP) fell sharply 4.5%.
| Index | Weekly Streak |
| TSX: | 2 – week winning streak |
| S&P: | 1 – week losing streak |
| DJIA: | 2 – week winning streak |
| Nasdaq: | 1 – week losing streak |

 A late-week recovery raised hopes that the four major indexes could finish the week higher, but it wasn’t enough to secure a broad rebound. The Toronto Stock Exchange Composite Index (TSX), S&P 500 Index (S&P), Dow Jones Industrial Average (DJIA) and Nasdaq Composite Index (Nasdaq) finished with mixed results. The DJIA was the only index to extend its weekly winning streak, as investors shifted away from growth stocks such as technology and towards more defensive sectors like healthcare. The S&P also ended a streak of 52 consecutive trading sessions without a daily decline of 1% or more, matching a streak that ended in July 2024. Meanwhile, the Nasdaq snapped a month-long weekly winning streak with its worst week since early June. Friday’s decline wiped out the Nasdaq’s gains for October.
US stocks faced pressure from accelerating inflation, rising bond yields and renewed doubts about the returns on massive AI investments. Although yields retreated later in the week, investors favoured defensive areas such as healthcare rather than returning to the technology and AI stocks that have led the market higher. The shift suggested that lower yields alone weren’t enough to restore confidence in growth stocks amid concerns about high share prices and the cost of AI investment.
September’s US inflation accelerated from August and came in hotter than expected, raising fears that the Fed might keep interest rates higher for longer or even consider another rate hike. The 10-year Treasury yield briefly jumped above 5.32%, from less than 5.17% just before the report, before giving back much of its gain. Higher yields make bonds more competitive with stocks and put pressure on share prices, particularly when investors are paying a premium for future growth.
AI-related companies remained a major source of weakness as investors questioned whether revenue from AI services would justify enormous spending on chips, data centres and other infrastructure. Concerns grew that heavily indebted companies building AI infrastructure may struggle to generate enough cash to service their debt before those investments pay off. Reports that some investors were considering a lower valuation for Anthropic, the developer of the Claude AI platform, ahead of its planned IPO added to the scrutiny. After a powerful rally fuelled by expectations of rapid growth, investors are demanding clearer evidence that AI spending will translate into profits.
Third-quarter earnings season also got underway, with results from major US banks providing an early test of corporate health. Disappointing reports and weakness in bank shares added to market pressure. Investors are looking for evidence that companies can sustain profit growth despite higher borrowing costs and energy prices. Expectations are particularly high for technology companies, leaving little room for disappointment.
Geopolitical tensions added to inflation concerns, with oil prices jumping more than 3% at the end of the week amid fears of disruptions to Middle East supplies. Brent crude closed the week above US$109 a barrel, heightening concerns that expensive energy could squeeze consumers and complicate the Fed’s efforts to contain inflation.
In Canada, the TSX was pulled in different directions by commodity prices and interest-rate concerns. Gold and other precious-metal miners were sensitive to shifting yields and currency movements, while energy stocks responded to oil-price swings amid Middle East tensions. Canadian technology stocks also felt the global pullback in AI-related shares, but falling bond yields later in the week helped support a broader recovery. The swings highlighted the TSX’s sensitivity to commodities and interest rates.
This week’s volatility highlights the challenges facing stocks trading near record levels. Investors are weighing earnings expectations against higher interest rates, expensive energy and questions about whether massive AI investments will deliver the profits markets anticipate. The key test in the weeks ahead is whether companies can deliver results that justify current share prices, particularly among the large technology companies that have driven much of the market’s advance.
| Portfolio | Weekly Streak |
| Portfolio 1: | 1 – week losing streak |
| Portfolio 2: | 1 – week losing streak |
| Portfolio 3: | 1 – week losing streak |
It was a rough week for my three portfolios, as the sell-off in AI-related and technology stocks dragged all three into the red. Portfolios 1 and 3 took the biggest hits, while the more balanced Portfolio 2 proved considerably more resilient. Still, a loss is a loss.
Portfolio 1 took the biggest hit, falling 6.3%. Given its heavy technology exposure, I was surprised that 45% of its holdings still managed to post weekly gains. That was small consolation, though, as several stocks suffered double-digit losses. Celestica (TSX: CLS) and Navitas Semiconductor (NASDAQ: NVTS) both plunged 18%. Cloudflare (NYSE: NET), CrowdStrike (NASDAQ: CRWD) and Arista Networks (NYSE: ANET) each fell 17%, while Lattice Semiconductor (NASDAQ: LSCC) lost 15%. Hammond Power Solutions (TSX: HPS.A) and Kraken Robotics (TSX: PNG) weren’t far behind, both dropping 14%.
There were few bright spots to offset the damage. Visa (NYSE: V) reached an all-time high, while Datadog (NASDAQ: DDOG) briefly closed at a record high before ending the week down 17%. That was quite a reversal.
Portfolio 2 was the best of a bad week, falling just 0.5%, despite 65% of its holdings finishing higher. Microsoft (NASDAQ: MSFT) briefly pushed its market value back above US$4 trillion after announcing plans for a major deployment of its own AI chips. The positive news couldn’t sustain its share price, however, as Microsoft ended the week lower amid the broader technology sell-off. Losses in Hammond Power Solutions, down 14%, and MongoDB (NASDAQ: MDB), down 12%, also weighed on the portfolio.
Portfolio 3 also took a beating, falling 4.1% and snapping a string of four consecutive weekly gains. Double-digit losses were widespread here, too. Rocket Lab (NASDAQ: RKLB) led the declines, plunging 24%. Cloudflare fell 17%, Corning (NYSE: GLW) lost 14%, Vertiv Holdings (NYSE: VRT) dropped 13%, and 5N Plus (TSX: VNP) declined 11%.
The contrast between the two growth-oriented portfolios was striking. While 45% of Portfolio 1’s holdings finished higher, compared with just 32% in Portfolio 3, Portfolio 1 still suffered the larger weekly decline. It’s another reminder that the number of winning stocks doesn’t tell the whole story; the size of individual gains and losses also matters.
With all three portfolios finishing the week in the red, it wasn’t the best way to celebrate the bull market’s fourth birthday. With earnings season picking up steam next week, let’s hope companies deliver strong third-quarter results, lift investor spirits and get those bulls running again!
Companies on the Radar
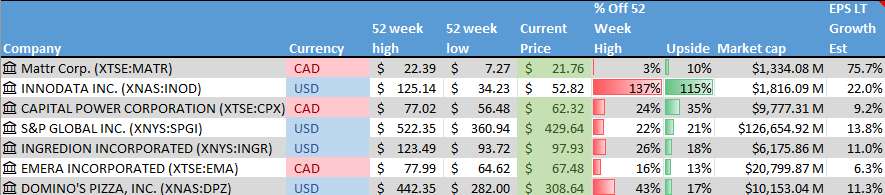
 This past week, a friend asked me about Innodata Inc. (NASDAQ: INOD). I’d never heard of the company, so we ran it through the Radar Test to learn more about what it does and whether it was worth a closer look.
It turns out that two minutes running it through my Radar Test was time well spent. Innodata is a small-cap American company that could benefit from the continued growth of AI. It provides the data and expertise that help AI systems learn, improve, and produce more reliable results. AI models need more than computing power to become smarter. They also need high-quality training data, expert feedback, and testing to identify weaknesses. Innodata helps supply these services to major technology companies and AI developers, making money by providing the specialised work and technology platforms needed to develop and improve AI models.
All five metrics on the Radar Test were promising (see the ‘Stocks on the Radar List. 2 of 2.’ graphic below), and Innodata could benefit as companies continue to invest in AI. But there are no guarantees. AI spending could slow, and there’s also the risk that AI itself could eventually take over some of the work Innodata does. It’s got potential, but I want to take a closer look before deciding whether it deserves a place in the portfolio.
With that addition, my radar list now stands at seven companies.
- Capital Power Corporation (TSX: CPX): A mid cap Canadian power producer that generates electricity from a mix of natural gas, wind, solar and battery storage across North America. With electricity demand rising rapidly from AI data centres, industrial growth and electrification, Capital Power is expanding its natural-gas generation while adding renewable and storage capacity. Its recent agreement to supply 250 MW of power to a new Meta (NASDAQ: META) data centre in Alberta for more than 10 years highlights how the AI boom is creating opportunities beyond the technology companies building the data centres themselves.
- Mattr Corp. (TSE: MATR): A small cap Canadian industrial technology company that designs and manufactures specialized infrastructure products using advanced materials. The company may not be familiar to most investors, but its products support industries such as energy, electrification, communications, transportation, and water management. From composite pipes and underground storage tanks to specialized wire and cable solutions, Mattr creates products designed to be lighter, more durable, and resistant to harsh environments. Think of it as a behind-the-scenes supplier helping modern infrastructure operate more safely and efficiently, generating revenue by selling specialized products to industrial customers around the world.
- S&P Global (NYSE: SPGI): A large cap American company and one of the world’s most important financial information companies. Most investors know it for the S&P 500 Index, but the business also provides credit ratings, market data, analytics, and research used by banks, corporations, governments, and investors worldwide. Think of it as one of the key information providers that helps global financial markets function, generating revenue through subscriptions, licensing fees, and rating services.
- Ingredion (NYSE: INGR): A mid-cap American ingredient manufacturer that turns plant-based raw materials into starches, sweeteners, fibres, and specialty ingredients used in thousands of everyday products. Its customers span food and beverage, animal nutrition, brewing, and industrial markets. With 10 consecutive years of dividend growth, Ingredion could provide an interesting counterbalance to the more growth-oriented companies in my portfolios.
- Emera Incorporated (TSX: EMA): A large cap Canadian energy company that owns regulated electric and natural gas utilities serving about 2.6 million customers across Canada, the US, and the Caribbean. Its utilities provide a relatively stable source of revenue while Emera invests billions in expanding and modernizing its power networks. With electricity demand expected to grow as AI data centres, industrial activity and electrification increase, Emera could benefit from the long-term need for more reliable power.
- Domino’s Pizza (NASDAQ: DPZ): One of the world’s largest pizza chains, with more than 22,000 locations across over 90 markets. Most are independently owned franchises, generating recurring royalties and fees, while Domino’s also sells food and supplies to franchisees. Its strong brand, digital ordering and efficient delivery model support growth. With more than 13 consecutive years of dividend increases, a high double-digit dividend growth rate and a payout ratio below 50%, Domino’s could offer a relatively stable, cash-generating business to balance the higher-growth companies already in the portfolios.
As always, these are not buy recommendations. Make sure to do your own research and choose investments that fit your personal financial goals.
The Radar Check was last updated October 16, 2026.

Portfolio Update
Portfolio 1
Sold: Home Depot (NYSE: HD) I added Home Depot to my portfolio in March 2021 to diversify with a solid consumer cyclical company. Coming out of the COVID-19 lockdowns, DIY renovations were popular, and Home Depot was a go-to destination for homeowners. With a decent dividend and growth potential, it seemed like the kind of “growth with dividend” company I like to own. It performed so well in the first few months that I bought a few more shares.
Home Depot has certainly lived up to its cyclical label. Since I bought it, shares have surged above US$400, fallen to around US$265, recovered above US$400 and dropped below US$280 again. Its fortunes are closely tied to housing activity, renovation spending and consumer confidence.
High borrowing costs and weak consumer confidence can discourage home purchases and major renovations, making growth difficult. Home Depot’s fiscal 2026 outlook reflects that challenge, with comparable sales growth of just 0% to 2% and EPS growth of about 0% to 4% expected.
Despite its solid dividend, my total return over five years was just 2.17%, or roughly 0.5% annually, including dividends but before currency effects. That fell well short of the growth I expected, and limited earnings growth gives me little reason to expect a significant improvement in the near term.
Home Depot isn’t a bad company, and its fortunes could improve as housing activity recovers. However, with limited earnings growth and better opportunities elsewhere, I decided to sell my shares and take a modest profit. The sale also helps me continue to streamline Portfolio 1 by reducing the number of companies I hold. I’m looking for investments that offer a better combination of earnings growth, dividend income, business quality and valuation.
That’s a wrap for this week, thanks for reading – may your portfolio stay green and your dividends steady. See you next time!