
US Midterm Elections: Does Political Control Matter to Investors?
Extract: The Democrats’ sweeping midterm victory reshaped the balance of power in Washington, creating new uncertainty for the Trump administration and potentially changing the tone of Canada-US trade relations. Let’s take a look at what the results could mean for markets, the economy and investors.
The US midterm elections took place this past week, giving voters an opportunity to reshape the balance of power in Washington. Republicans went into the elections controlling both the House of Representatives and the Senate, but Democrats pulled off a sweeping victory, taking control of both chambers. The result is a major setback for President Trump, coming amid broader dissatisfaction with his administration’s handling of the economy, trade and foreign policy. Several traditionally Republican strongholds changed hands, making the scale of the Democratic gains particularly striking. While the result changes the political landscape in Washington, it doesn’t necessarily mean a dramatic shift in US economic policy. What it does mean is Trump now faces a much less cooperative Congress during his final two years in office.
The initial market reaction was cautious, but stocks quickly found their footing. All three major US indexes finished higher the following day as investors welcomed the prospect of a divided government and greater checks on the administration. With Democrats controlling Congress and Trump retaining the presidency, sweeping legislative changes are likely to become more difficult, potentially limiting further tax cuts, government spending and borrowing. That prospect helped ease concerns about the US fiscal outlook and provided some reassurance to investors.
The Democratic victory creates a significant shift in Washington, with Congress likely to increase scrutiny of the administration and push for greater oversight of corporate practices, artificial intelligence (AI) and other industries. Democrats will also have greater influence over legislation and government spending. However, Trump retains presidential veto power and considerable authority over executive policies, limiting how far Democrats can go in reversing his administration’s agenda. The resulting political gridlock could make major policy changes less likely, providing some predictability for investors. At the same time, ongoing political disputes could create uncertainty around government funding and other issues.
For Canada, the election could create an opportunity for a less confrontational trade relationship with its largest trading partner. Democratic gains in several states affected by the trade dispute with Canada could increase pressure on Trump’s tariff policies and give Canada more political support in Washington as trade negotiations continue. However, expectations of an immediate improvement should be tempered. Many of Trump’s tariffs were imposed through executive authority, meaning he can maintain them without congressional approval. The election also doesn’t remove the uncertainty surrounding future trade negotiations or the review of the Canada-US-Mexico Agreement.
Canadian markets also responded positively to the change, moving higher alongside US markets. Investors appeared encouraged by the possibility that greater congressional opposition could put some limits on Trump’s trade policies, potentially easing tensions between the two countries. A less confrontational trade relationship could benefit Canadian businesses and improve investor confidence, although much will depend on whether Trump is willing to reconsider his tariff policies. The Canadian dollar also strengthened against its US counterpart as the US dollar weakened following the election results.
For investors, the election is a reminder not to make investment decisions based on which party wins. Inflation, interest rates, economic growth and corporate earnings will continue to play a much bigger role in determining the direction of the stock market.
While the political implications will take time to unfold, markets also had to contend with the latest economic data. Let’s take a look at this week’s labour data and other market developments to see what else drove the markets and how my portfolios fared.
Items that may only interest or educate me ….
Canadian Economic news, US Economic news, ….
Canadian Economic news
This past week’s key economic data that the Bank of Canada (BoC) considers when deciding whether to raise or lower the interest rate.
Labour Force Survey (LFS)
Canada’s October Labour Force Survey was a disappointment. Employment fell by 4,700, following a decline of 68,300 in September, while analysts had expected a gain of 13,600. Canada has now lost roughly 115,000 jobs since August, pointing to a labour market that is weakening rather than recovering. The picture was even less encouraging in the private sector, where a loss of 53,000 jobs was largely offset by a 50,000 increase in public-sector employment.
The unemployment rate climbed to 6.7%, up from 6.5% in September and marking its second consecutive monthly increase. It is still below the recent peak of 6.9% recorded in April 2026, but the upward trend is becoming harder to ignore.
Average hourly wages rose 2.2% year over year, easing from 2.3% in September and suggesting wage pressures are gradually cooling.
Overall, the latest figures point to a labour market losing momentum. This wasn’t simply a small miss against expectations: employment has declined for three consecutive months, while unemployment continues to rise. The weaker employment picture could strengthen the case for the BoC to hold interest rates at its upcoming December meeting.
Canadian Market Volatility
Canada’s version of the market’s “fear gauge,” the S&P/TSX 60 VIX Index (VIXC), measures expected volatility in Canadian stocks over the next 30 days. Higher readings signal greater uncertainty, while lower readings suggest calmer market conditions.
The VIXC opened the week at 15.60, down from the previous Friday’s close of 16.03. It hovered around 16.5 ahead of the US midterm elections before dropping to 15 following the Democrats’ sweeping victory. However, that calm didn’t last. The index climbed above 17 as the AI sell-off resumed and intensified, amid concerns that increased Democratic oversight could slow AI development and investment. The VIXC eased slightly toward the end of the week, closing Friday at 17.56, above its opening level and the previous week’s close, signalling a rise in investor anxiety over the week.
Note: The VIXC typically trades at lower levels than the VIX, partly because of the different makeup of the Canadian and US markets. The S&P 500 has a much larger weighting in technology, while the TSX has greater exposure to financials, energy, and materials. Because these sectors respond differently to economic conditions and commodity prices, the two indexes can have different levels of expected volatility.
US Economic news
This past week’s key data points that the Federal Reserve (Fed) considers when deciding whether to raise or lower the interest rate.
Labour data
This week’s labour data comes from three key reports: the Job Openings and Labor Turnover Survey (JOLTS), the ADP Employment Report, and the Employment Situation Summary (ESS). Each examines a different part of the US labour market. JOLTS measures job openings, hiring and worker turnover; ADP provides a snapshot of private-sector employment; and the ESS offers the broadest picture, including job creation, unemployment and wage growth. Together, they provide a more complete view of labour market conditions. One important distinction is timing: JOLTS covers September, while ADP and the ESS cover October.
Labor Department’s Job Openings and Labor Turnover Survey
The JOLTS report for September showed job openings increased to 7.523 million, compared with an upwardly revised 7.190 million in August and 7.169 million in September 2025. The figure exceeded economists’ expectations of 7.1 million, although the Bureau of Labor Statistics characterized the monthly change as little changed.
Hiring and total separations also changed relatively little, continuing the ‘low hire, low fire’ trend of recent months. Employers appear willing to replace departing workers but remain cautious about expanding their workforces.
ADP Employment Report
The ADP Employment Report showed US private-sector employers added 86,000 jobs in October, matching September’s downwardly revised gain but exceeding economists’ expectations of 69,000. Service-providing industries accounted for nearly all the growth, while professional and business services continued to struggle, shedding jobs for the third consecutive month.
Annual base-pay growth remained steady at 3.2%, although workers changing jobs continued to receive larger pay increases than those staying with their employers. Overall, the report points to some stabilization in private-sector hiring, but job creation remains relatively subdued.
The Bureau of Labor Statistics’ Employment Situation Summary
The ESS showed US employers added 165,000 jobs in October, blowing past expectations of 65,000 and the average monthly gain of 48,000 over the previous 12 months. The unemployment rate edged down to 4.1% from September’s 4.2%. However, the number of people working part-time for economic reasons increased by 339,000 to 4.8 million, suggesting some workers are still struggling to find full-time employment.
Average hourly earnings increased by 0.4% month over month, accelerating from September’s 0.1% gain. Annual wage growth edged up to 3.1% from 3.0%, remaining relatively moderate.
Labour Market Summary
Taken together, the reports suggest the American labour market is proving more resilient than expected, but isn’t necessarily regaining its earlier momentum. JOLTS and ADP point to relatively subdued hiring, while the ESS delivered a much stronger picture, with solid job creation and upward revisions adding 84,000 jobs to August and September’s figures.
There are still signs of weakness beneath the headline numbers, including uneven job growth and an increase in involuntary part-time employment. Nevertheless, the latest figures don’t suggest a labour market deteriorating rapidly. Instead, employers appear to be adding workers cautiously while avoiding significant layoffs.
For the Fed, the stronger employment figures increases the chances of another rate hike if inflation remains persistent. The labour market isn’t showing enough weakness to give policymakers much reason to ease monetary policy.
Consumer Sentiment Index (CSI)
The University of Michigan’s preliminary November CSI came in better than expected at 51.0, up from 48.0 at the end of October and matching its year-earlier reading. While this offers some encouragement, consumer confidence is still historically weak.
The Current Economic Conditions Index, which measures consumers’ views of their finances and buying conditions, rose to 51.0 from 46.7. The Expectations Index, which gauges their outlook for personal finances and the economy, also improved, climbing to 50.9 from 48.8. Both remain slightly below year-earlier levels, but the gains suggest a broad-based improvement in sentiment.
High prices are still consumers’ biggest concern, with affordability continuing to weigh on household confidence. They also expressed growing concern that rapid AI investment could be creating a bubble.
Consumer sentiment has hovered near historical lows for much of the year, hitting a record low of 44.8 in May in data dating back to the 1950s. November’s improvement is encouraging, but the overall reading remains weak, reflecting ongoing concerns about the economy and cost of living.
One important detail: the survey was conducted before the US midterm election results, so the improvement shouldn’t be attributed to the Democrats’ victory or the prospect of congressional gridlock.
American Market Volatility
The VIX, often called the market’s “fear gauge,” measures expected volatility in the S&P 500 over the next 30 days. Higher readings signal greater uncertainty, while levels above 20 are typically associated with heightened market volatility.
The VIX opened the week at 19.05, slightly below the previous Friday’s close of 19.76, but quickly climbed above 20 as the midterm elections approached. Following the Democrats’ victory in both the House of Representatives and the Senate, the index dropped below 16 as investors anticipated legislative gridlock and fewer major policy changes. That optimism quickly faded, however, as the AI rally came to a screeching halt. Concerns that increased Democratic oversight could slow AI development and the rapid expansion of data centres added to the selling pressure, sending the VIX soaring above 28 as stock prices fell sharply, especially the AI market leaders. The index eventually eased back slightly, closing Friday at 25.64.
The sharp reversal tells the story of a volatile week for investors. The VIX ended well above the previous week’s close, signalling a substantial increase in expected market volatility and renewed anxiety. The initial relief following the election results was quickly overshadowed by concerns about the AI sector, showing just how quickly market sentiment can change.
Weekly Market and Portfolio Review
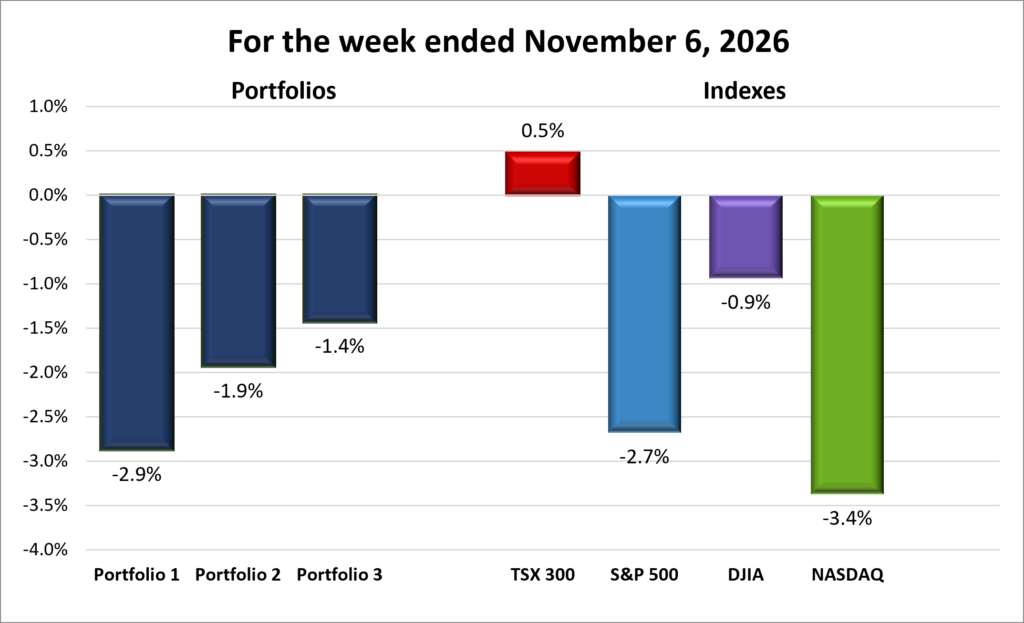
For the week, the TSX (SPTSX) gained 0.5%, the S&P 500 (SPX) lost 2.7%, the DJIA (INDU) shed 0.9% and the Nasdaq (CCMP) plunged 3.4%.
| Index | Weekly Streak |
| TSX: | 1 – week winning streak |
| S&P: | 4 – week losing streak |
| DJIA: | 2 – week losing streak |
| Nasdaq: | 4 – week losing streak |

 Markets got off to an uncertain start as investors awaited the US midterm election results. Once Democrats secured control of both chambers of Congress, markets soared. Then they came crashing down.
The Dow Jones Industrial Average (DJIA) had its best day since April 2025, the S&P 500 Index (S&P) approached its record high, and the Nasdaq Composite Index (Nasdaq) continued recovering from its recent pullback. The Toronto Stock Exchange Composite Index (TSX) recorded its strongest session in seven months. The following day, all four indexes reversed course. The DJIA suffered its worst second trading session following a midterm election in records dating back to 1896. The S&P and Nasdaq posted their steepest one-day declines since President Trump’s April 2025 Liberation Day tariff sell-off. The Nasdaq closed more than 10% below its October 6 record high, entering correction territory, while the TSX recorded its steepest daily decline in five months.
AI remained the main source of market anxiety. Investors questioned whether the billions being poured into data centres, chips and related infrastructure would generate sufficient returns. Strong earnings were no longer enough; investors wanted clearer evidence that the spending would pay off.
Concerns also grew that Democratic control of Congress could bring greater scrutiny of AI projects and tighter restrictions on data centre construction. Local ballot measures opposing new developments passed, raising the prospect of regulatory hurdles and delays. With AI investment increasingly important to US economic growth, a pullback could have consequences well beyond technology.
Adding to the unease, retail investors became net sellers of US stocks at the fastest pace since March 2020, abandoning their usual ‘buy the dip’ approach.
The election initially brought optimism. Investors welcomed greater checks and balances on President Trump’s policies and the political gridlock that could make major legislative changes more difficult. Hopes that Democrats would press Trump to pursue diplomacy over the war with Iran helped send oil prices plunging more than 8% on Wednesday. However, renewed tanker attacks and uncertainty over shipping through the Strait of Hormuz sent crude prices sharply higher the following day, reversing much of the decline.
The latest US jobs report added another complication for the Fed. Employment gains far exceeded expectations, suggesting the economy was still running hot and increasing the likelihood of another interest-rate hike at its next meeting.
In Canada, oil and precious metals helped shape the TSX’s performance. Oil was on track for its worst weekly showing since April 2020 before Thursday’s rebound offered some support for energy producers. Gold also recovered from a recent low, lifting gold-mining shares and recouping some of October’s losses.
Manufacturing slipped into contraction in October for the first time this year as tariffs, weaker orders and geopolitical uncertainty weighed on activity. Statistics Canada’s September report showed the merchandise trade surplus widened to $5.35 billion, its highest level since May 2022. Stronger gold and energy shipments, particularly to the US, drove much of the improvement. However, exports excluding those categories fell, as did overall export volumes. With more than 70% of Canadian exports destined for the US, the report underscored Canada’s exposure to trade disruptions and tariffs.
The late-week US technology sell-off spread north of the border, pressuring Canadian technology shares and erasing much of the TSX’s earlier gains. Canada’s greater exposure to energy, gold and financials offered little protection from concerns over AI spending and the economic outlook.
The labour market offered little encouragement either. October employment fell while unemployment rose, adding to signs that the economy was losing momentum. The weaker results made a Bank of Canada rate hike less likely, with the central bank more likely to hold rates steady.
It was a bruising week for AI stocks. The post-election rally gave way to a broader technology sell-off, leaving the S&P and Nasdaq with their worst weekly performances since June. The TSX also surrendered much of its earlier gains as optimism gave way to concerns about AI spending, geopolitics and the economic outlook.
| Portfolio | Weekly Streak |
| Portfolio 1: | 4 – week losing streak |
| Portfolio 2: | 1 – week losing streak |
| Portfolio 3: | 4 – week losing streak |
All three portfolios were looking good at midweek, with each on track for a weekly gain. But, much like the indexes, the mood changed on Thursday. Gains turned into losses, leaving all three portfolios deep in the red by week’s end.
The semiconductor sell-off, led by AI darling Nvidia (NASDAQ: NVDA), dealt a heavy blow to Portfolios 1 and 3, where it is still the largest holding. Nvidia fell more than 9% on Thursday alone and finished the week down 10%, adding to the pressure on both technology-heavy portfolios.
Portfolio 1 was the worst performer, losing 2.9%. Despite that, it had the highest proportion of weekly winners, with 52% of its holdings finishing higher. Magnite (NASDAQ: MGNI) jumped 25%, Grab Holdings (NASDAQ: GRAB) gained 23%, Liberty Media Corporation (Formula 1) (NASDAQ: FWONK) climbed 15%, and the iShares S&P/TSX Global Gold Index ETF (TSX: XGD) advanced 13%. Apple (NASDAQ: AAPL) and Berkshire Hathaway (NYSE: BRK.B) also reached all-time highs.
AI and related stocks accounted for several of the steepest declines. Datadog (NASDAQ: DDOG) fell 23%, Celestica (TSX: CLS) dropped 21%, Hammond Power Solutions (TSX: HPS.A) lost 19%, and CrowdStrike (NASDAQ: CRWD) declined 13%. The biggest hit came from Trisura (TSX: TSU), which plunged 29.9% after quarterly results missed estimates. It recovered some ground late in the week but still finished down 27%.
Portfolio 2 lost 1.9%, making it the second-best performer. Its smaller exposure to AI helped, although losses in energy and financials weighed on results. Winners and losers were evenly split, but larger losses and position sizes more than offset the gains. Microsoft (NASDAQ: MSFT) reached an all-time high before pulling back, yet still finished up 1%. Airbnb (NASDAQ: ABNB) gained 13%, while Take-Two Interactive (NASDAQ: TTWO) advanced 12%.
Energy stocks were a major drag as falling oil prices weighed on every holding. Whitecap Resources (TSX: WCP) fell 12%, while Canadian Natural Resources (TSX: CNQ) dropped 10%. Hammond Power Solutions, down 19%, and cancer-detection company Guardant Health (NASDAQ: GH), which lost 15%, added to the pressure. The portfolio’s largest holding, Bank of Nova Scotia (TSX: BNS), also slipped 1.5%. That may seem modest, but with BNS accounting for more than 35% of the portfolio, even a small decline had a meaningful impact.
Portfolio 3 held up best, losing 1.4%. Despite the smaller decline, the AI sell-off still took a toll, with only 46% of its holdings finishing higher. 5N Plus (TSX: VNP) jumped 24.7% after reporting quarterly revenue above estimates and finished the week up 27%. Magnite advanced 25%, while Brookfield Asset Management (TSX: BAM) gained 10%. Those gains couldn’t offset losses among AI-related holdings. Vertiv Holdings (NYSE: VRT) fell 22%, Corning (NYSE: GLW) lost 14%, and chipmakers Broadcom (NASDAQ: AVGO) and Nvidia each finished down 10%.
The shift in Washington has added another layer of uncertainty to an already unsettled AI trade. Combined with growing concerns over AI spending, it became a major headwind for all three portfolios. Hopefully, the pullback proves temporary rather than the start of something more prolonged. For now, I’m inclined to view the weakness as a buying opportunity rather than a reason to panic. 😊
Companies on the Radar
 Nothing new caught my eye this week, so I’ll be focusing on these six companies on my radar for now.
- Mattr Corp. (TSE: MATR): A small cap Canadian industrial technology company that designs and manufactures specialized infrastructure products using advanced materials. The company may not be familiar to most investors, but its products support industries such as energy, electrification, communications, transportation, and water management. From composite pipes and underground storage tanks to specialized wire and cable solutions, Mattr creates products designed to be lighter, more durable, and resistant to harsh environments. Think of it as a behind-the-scenes supplier helping modern infrastructure operate more safely and efficiently, generating revenue by selling specialized products to industrial customers around the world.
- BioSyent (TSXV: RX): A small Canadian healthcare company that acquires or licenses established pharmaceutical and healthcare products for marketing and distribution, avoiding the high costs and risks of developing new drugs. Its business model has delivered 64 consecutive profitable quarters through Q2 2026, with revenue growing 23% in 2025. Management has a meaningful ownership stake, and the company has repurchased shares and paid a quarterly dividend since late 2022. Its expansion into oral health provides another avenue for growth beyond its established pharmaceutical business.
- Ingredion (NYSE: INGR): A mid-cap American ingredient manufacturer that turns plant-based raw materials into starches, sweeteners, fibres, and specialty ingredients used in thousands of everyday products. Its customers span food and beverage, animal nutrition, brewing, and industrial markets. With 10 consecutive years of dividend growth, Ingredion could provide an interesting counterbalance to the more growth-oriented companies in my portfolios.
- S&P Global (NYSE: SPGI): A large cap American company and one of the world’s most important financial information companies. Most investors know it for the S&P 500 Index, but the business also provides credit ratings, market data, analytics, and research used by banks, corporations, governments, and investors worldwide. Think of it as one of the key information providers that helps global financial markets function, generating revenue through subscriptions, licensing fees, and rating services.
- Capital Power Corporation (TSX: CPX): A mid cap Canadian power producer that generates electricity from a mix of natural gas, wind, solar and battery storage across North America. With electricity demand rising rapidly from AI data centres, industrial growth and electrification, Capital Power is expanding its natural-gas generation while adding renewable and storage capacity. Its recent agreement to supply 250 MW of power to a new data centre in Alberta for more than 10 years highlights how the AI boom is creating opportunities beyond the technology companies building the data centres themselves.
- Domino’s Pizza (NASDAQ: DPZ): One of the world’s largest pizza chains, with more than 22,000 locations across over 90 markets. Most are independently owned franchises, generating recurring royalties and fees, while Domino’s also sells food and supplies to franchisees. Its strong brand, digital ordering and efficient delivery model support growth. With more than 13 consecutive years of dividend increases, a high double-digit dividend growth rate and a payout ratio below 50%, Domino’s could offer a relatively stable, cash-generating business to balance the higher-growth companies already in the portfolios.
As always, these are not buy recommendations. Make sure to do your own research and choose investments that fit your personal financial goals.
The Radar Check was last updated November 6, 2026.


That’s a wrap for this week, thanks for reading – may your portfolio stay green and your dividends steady. See you next time!