
Good Earnings Don’t Always Mean A Rising Stock Price
With third-quarter earnings season under way, I thought it would be a good time to discuss why companies can report higher profits and beat analysts’ forecasts, yet still see their share prices fall.
Netflix (NASDAQ: NFLX) provided a recent example. The streaming company reported third-quarter earnings above expectations on October 20, but its shares fell after it issued a weaker-than-expected forecast for the next quarter and lowered its advertising revenue outlook for the year. Despite solid results, investors were more concerned about what lay ahead.
It might seem counterintuitive, but the market isn’t just asking, “What have you done for me lately?” It’s asking, “What will you do for me in the future?”
A company’s share price reflects what investors expect its future earnings to be worth today. By the time quarterly results are released, much of the good news may already be reflected in the stock price.
Imagine a company whose shares have climbed 30% in anticipation of strong earnings. When results arrive, profits are up 25% and beat analysts’ forecasts. That sounds impressive, but investors may have expected even more. If the results or outlook fall short of those elevated expectations, some investors may sell, sending the share price lower.
The reverse can happen, too. A company struggling with weak expectations might report results that are less disappointing than feared, prompting its shares to rise. The reaction isn’t necessarily a verdict on whether a company is good or bad. It’s about how the results compare with what investors had already priced in.
Nvidia (NASDAQ: NVDA) offers a striking example of how expectations can change. In May 2023, its shares surged after the company delivered a much stronger-than-expected revenue forecast, fuelled by growing demand for its artificial intelligence (AI) chips. The announcement helped ignite the AI stock rally as investors began to appreciate the opportunity.
Since then, Nvidia has become one of the biggest beneficiaries of AI spending. But as expectations have risen, the bar for impressing investors has also become much higher. Strong earnings and growing demand may not be enough to lift the shares if investors expect even stronger growth, worry about how long spending can continue at its current pace, or question whether customers will earn enough from their AI investments to justify the cost.
This doesn’t mean Nvidia’s business has weakened whenever its share price falls. Investors are continually reassessing what future growth is worth paying for. A share price can decline even while a company continues to grow, just as it can rebound when expectations improve.
Rather than focusing only on whether a company beats or misses estimates, look at three things: how results compare with expectations, what management says about future growth, and whether the share price already reflects an optimistic outlook.
A strong quarter doesn’t guarantee a rising share price. Equally, a disappointing reaction doesn’t automatically mean the business is deteriorating. The important question is whether new information changes the company’s long-term prospects or what you’re willing to pay for it.
As a long-term investor, I try to look beyond the immediate market reaction and focus on the underlying business. One quarterly report provides useful information, but a pattern across several quarters often tells a more complete story. If results, guidance and the company’s competitive position keep changing, that’s worth attention. If the business remains on track, a short-term share-price decline may matter less.
Ultimately, a good company, a good earnings report and a good investment aren’t necessarily the same thing. A company can be successful and keep growing, yet still deliver disappointing returns if investors pay too much for the future growth they expect.
As earnings season unfolds, I’ll be watching not just the results companies report, but what those results reveal about future growth. With that in mind, let’s look at how the markets performed this week and how my three portfolios fared.
Items that may only interest or educate me ….
Canadian Economic news, US Economic news, ….
Canadian Economic news
This past week’s key economic data that the Bank of Canada (BoC) considers when deciding whether to raise or lower the interest rate.
Consumer Price Index (CPI)
Canada’s inflation rate edged higher in September, with annual CPI rising to 3.1% from 3.0% in August. The increase was smaller than expected, as analysts had forecast 3.2%. Monthly inflation rose 0.1% after falling 0.1% in August, in line with expectations. Gasoline prices led the monthly increases, jumping 6.1%, while food prices moved in the opposite direction, falling 0.3%, the largest monthly decline. Over the past year, gasoline prices surged 27.8%, while household operations, furnishings and equipment recorded the smallest increase, at just 0.4%.
Shelter costs continued to climb, rising 0.3% during the month and 1.8% year over year, up from 1.5% in August. Food inflation, meanwhile, slowed to 2.2% from 2.8% in August, offering some relief after years of rising grocery bills. However, lower inflation doesn’t mean lower prices; food prices are still substantially higher than they were before the recent surge in living costs.
Core CPI, which excludes the more volatile food and energy categories, fell 0.1% in September and rose 2.1% year over year. This suggests underlying inflation is still relatively contained, with higher energy prices doing much of the work behind the increase in headline inflation. However, annual CPI has moved above the Bank of Canada’s 1%–3% target range, leaving policymakers to weigh easing underlying price pressures against the risk that higher energy costs spread to other goods and services.
Retail Sales
Statistics Canada reported that retail sales rose 1.2% in August, reversing July’s 0.7% decline. Sales were 5.4% higher than a year earlier, accelerating from July’s 5.1% annual increase. The monthly gain fell slightly short of analysts’ 1.3% forecast, but the rebound was encouraging.
Sales increased across all nine retail subsectors. Furniture, home furnishings, electronics and appliance retailers led the monthly gains, with sales rising 2.3%, while sporting goods, hobby, musical instrument, book and miscellaneous retailers recorded the smallest increase, at 0.3%. Over the past year, gasoline stations and fuel vendors posted the strongest growth, with sales up 22.6%, primarily due to higher prices. Furniture, home furnishings, electronics and appliance retailers were the only subsector to record an annual decline, with sales down 2.1% from August 2025.
Core retail sales, which exclude motor vehicle and parts dealers as well as gasoline stations and fuel vendors, rose 1.1% in August after falling 0.7% in July. On an annual basis, core sales increased 4.2%, up from July’s 3.9% growth.
The latest figures offer some reassurance that consumer spending has not stalled. Both headline and core sales rebounded, and the 1.2% increase in sales volume suggests Canadians bought more goods rather than simply spending more because of higher prices.
Although the monthly gain fell slightly short of expectations, the broad-based rebound was a positive sign for economic activity. Stronger consumer spending supports company revenues and economic growth, but it could also add to concerns that demand remains resilient while inflation is elevated. With the BoC’s rate decision coming next week, the rebound adds to the case for a rate increase, although signs of a slowing economy could give policymakers reason to hold off.
Canadian Market Volatility
Canada’s version of the market’s “fear gauge,” the S&P/TSX 60 VIX Index (VIXC), measures expected volatility in Canadian stocks over the next 30 days. Higher readings signal greater uncertainty, while lower readings suggest calmer market conditions.
The VIXC opened the week at 13.94, little changed from the previous week’s close of 13.56. September inflation edged above the Bank of Canada’s target range, nudging the gauge higher. However, with core inflation still near 2%, the VIXC remained relatively contained between 14 and 14.5 early in the week. Renewed attacks on ships in the Strait of Hormuz sent oil prices higher, reviving concerns that rising energy costs could fuel inflation and prompt another interest-rate hike. The gauge climbed above 15.30 before those concerns eased, allowing it to fall to 14.85 by Friday’s close.
Note: The VIXC typically trades at lower levels than the VIX, partly because of the different makeup of the Canadian and US markets. The S&P 500 has a much larger weighting in technology, while the TSX has greater exposure to financials, energy, and materials. Because these sectors respond differently to economic conditions and commodity prices, the two indexes can have different levels of expected volatility.
US Economic news
This past week’s key data points that the Federal Reserve (Fed) considers when deciding whether to raise or lower the interest rate.
Consumer Sentiment Index (CSI)
The University of Michigan’s final October CSI reading edged down to 48.0 from 48.1 in September, its second-lowest reading on record and 10.4% below a year ago. Although sentiment remained near historic lows, the final reading was better than both the preliminary estimate of 46.3 and economists’ expectations. The all-time low of 44.8 was set in May, following the start of the Iran war.
The Current Economic Conditions Index, which measures consumers’ views of their finances and buying conditions, fell sharply to 46.7 from 50.9 in September. It is now down 20.3% year over year, reflecting growing concerns about household finances and the affordability of major purchases. In contrast, the Expectations Index, which measures the outlook for the next six months, rose to 48.8 from 46.3, although it remains 3.0% below its year-earlier level.
Inflation expectations also moved higher. Consumers expect prices to rise 4.7% over the next year, up from 4.6% in September, while their five-year outlook increased to 3.5% from 3.4%. Both measures have risen for a second consecutive month, complicating the Fed’s efforts to bring inflation back to its 2% target.
Overall, the report highlights the continued strain on household purchasing power. Higher prices linked to the Middle East conflict have added to affordability concerns, while rising inflation expectations suggest consumers see little near-term relief. Although the improvement in future expectations offers a modest bright spot, it has yet to translate into greater confidence in current economic conditions.
American Market Volatility
The VIX, often called the market’s “fear gauge,” measures expected volatility in the S&P 500 over the next 30 days. Higher readings signal greater uncertainty, while levels above 20 are typically associated with heightened market volatility.
The VIX opened the week at 18.37, down from the previous Friday’s close of 19.99, as concerns about AI spending eased. It drifted lower, reaching 16.73 before renewed Iranian attacks on ships transiting the Strait of Hormuz sent oil prices higher and unsettled markets. The VIX then climbed above 20 as rising oil prices revived inflation concerns combined with a technology selloff that spread to the broader market. It ended the week at 19.45, erasing most of its earlier decline.
The reversal showed how quickly calmer markets can give way to renewed anxiety. Although the VIX retreated from its late-week high, it still finished above the previous week’s close, reflecting increased investor nervousness heading into the new week.
Weekly Market and Portfolio Review
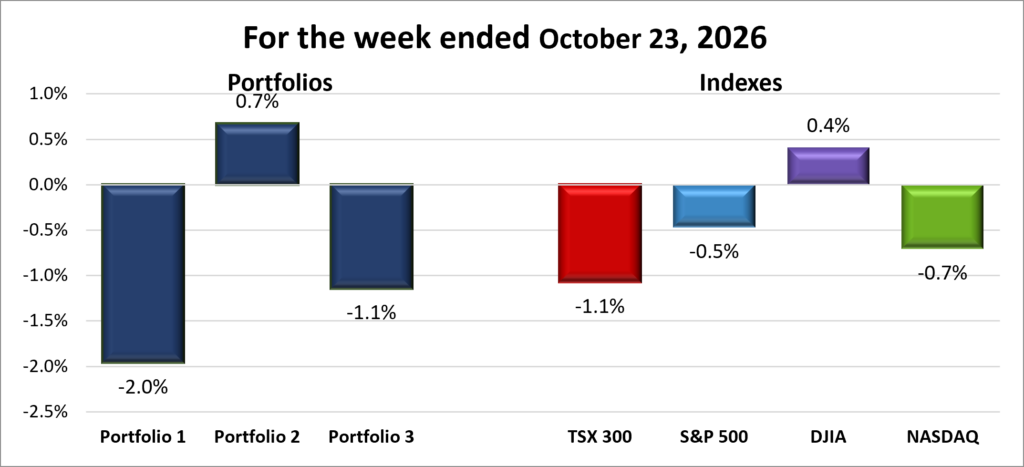
For the week, the TSX (SPTSX) shed 1.1%, the S&P 500 (SPX) dropped 0.5%, the DJIA (INDU) rose 0.4% and the Nasdaq (CCMP) fell 0.7%.
| Index | Weekly Streak |
| TSX: | 1 – week losing streak |
| S&P: | 2 – week losing streak |
| DJIA: | 3 – week winning streak |
| Nasdaq: | 2 – week losing streak |

 After the Nasdaq’s worst weekly sell-off since June the previous week, stocks initially found their footing and began to recover. All four major North American indexes appeared on track to finish the week higher, but a late-week surge in oil prices and renewed selling in technology stocks wiped out those gains. The Toronto Stock Exchange Composite Index (TSX), the S&P 500 Index (S&P) and the Nasdaq Composite Index (Nasdaq) all finished lower, while the Dow Jones Industrial Average (DJIA) bucked the trend to extend its weekly winning streak.
In the US, two concerns dominated the week: whether companies can earn sufficient returns on their enormous AI investments, and whether stubborn inflation and rising oil prices will keep interest rates higher for longer. Corporate earnings added to the uncertainty, showing that even strong results may not satisfy investors when the cost of future growth comes under scrutiny.
The debate over AI spending intensified as investors questioned whether the enormous sums being invested in AI infrastructure will generate sufficient returns. Meta (NASDAQ: META) illustrated the dilemma when its third-quarter earnings beat expectations, yet its shares plunged as heavy AI spending pushed free cash flow into negative territory for the first time in more than a decade. Semiconductor stocks also suffered steep declines as investors questioned whether current levels of AI-related data centre spending are sustainable and whether the eventual returns will justify the investment. By the end of the week, the sell-off had spread well beyond technology, reaching nearly every sector except energy.
Inflation and geopolitical tensions added to the pressure. Persistent inflation reinforced concerns that the Fed might keep interest rates higher for longer, while escalating tensions and renewed attacks in the Middle East drove oil prices sharply higher. Brent crude, the global benchmark, settled above US$116 a barrel, its highest closing price in nearly six months, while West Texas Intermediate (WTI), the US benchmark, topped US$103. Higher energy prices could add to inflationary pressures, increasing costs for consumers and businesses while making it harder for the Fed to cut interest rates.
In Canada, the TSX had a rough week, snapping its two-week winning streak. The index initially found support from a federal support package for industries affected by US tariffs, but the rebound proved short-lived as falling metal prices, weakness in technology stocks, and pressure on financials and consumer-related stocks dragged the market lower.
Basic materials stocks, particularly mining companies, were among the biggest drags as gold and copper prices fell sharply amid renewed inflation concerns and expectations of a rate hike. Canadian technology stocks also weakened as investors reassessed the potential returns from AI-related spending.
Energy was the exception. Rising oil prices, driven by escalating tensions in the Middle East and concerns about potential supply disruptions, helped Canadian energy stocks finish the week higher. However, those gains weren’t enough to offset losses elsewhere, as financials and consumer-related stocks weakened towards the end of the week.
The week’s reversal highlighted how quickly sentiment can shift when concerns about growth, spending and inflation collide. Despite the DJIA extending its winning streak, most major indexes finished lower as investors grew more cautious ahead of next week’s BoC and Fed rate decisions, and another round of corporate earnings announcements.
| Portfolio | Weekly Streak |
| Portfolio 1: | 2 – week losing streak |
| Portfolio 2: | 1 – week winning streak |
| Portfolio 3: | 2 – week losing streak |
It was a volatile week in the markets, and my portfolios followed a similar pattern, starting strong before reversing course as the AI rally gave way to a sell-off. My two technology-heavy portfolios both finished lower, with Portfolio 1 taking the biggest hit, while the more balanced Portfolio 2 bucked the trend with a gain. Interestingly, Portfolio 3 held up better than I expected despite its significant exposure to AI and technology stocks.
Portfolio 1 began the week higher as AI stocks rallied, but reversed course as the rally faded and selling intensified, ending down 2.0% for the week, the biggest loss of the three portfolios. Given the size of the decline, I was surprised to see 52% of its holdings finish higher. CrowdStrike (NASDAQ: CRWD) led the way with a 10% gain, while Berkshire Hathaway (NYSE: BRK.B) and Visa (NYSE: V) both reached all-time highs before pulling back slightly, yet still finished the week higher. On the downside, Sea Limited (NYSE: SE) fell 18%, Celestica (TSX: CLS) dropped 17%, and Hammond Power Solutions (TSX: HPS.A) lost 11%.
Portfolio 2 was the week’s top performer, gaining 0.7%. Its smaller technology allocation and greater exposure to energy helped it weather the market turbulence. Even more encouraging, 69% of its holdings finished higher, including Mitek Systems (NASDAQ: MITK), which climbed 14%. In a week when many technology-heavy stocks struggled, Portfolio 2’s more balanced mix proved to be an advantage.
Portfolio 3 also finished lower, falling 1.1%, which was in line with my expectations given its AI and technology exposure. Interestingly, despite having only 42% of its holdings finish higher and its heavier exposure to AI and technology, it still outperformed Portfolio 1. There weren’t any standout winners to celebrate, but thankfully, no major losers to single out either. Sometimes, the best you can say about a tough week is that it could have been worse. ☹
All things considered, Portfolio 2’s gain helped cushion the losses in my two technology-heavy portfolios. Next week, I’m hoping both central banks hold rates steady, corporate earnings deliver a few positive surprises, and, most importantly, the AI bulls regain their footing and charge ahead again. 😊
Companies on the Radar
 No new companies crossed my investing radar this past week, but I did manage to shorten the list by removing two names. Leaving my radar are Innodata Inc. (NASDAQ: INOD), an American company that provides training data, expert feedback, and testing services to help develop and evaluate AI models, and Emera Incorporated (TSX: EMA), a Canadian energy company that owns regulated electricity and natural gas utilities across Canada, the US, and the Caribbean.
Neither company is a bad business, but I’m being selective about where I put my money. I already have significant AI exposure, and Innodata doesn’t stand out enough from the companies I currently own to justify adding another position. As for Emera, I simply prefer Capital Power (TSX: CPX). All three portfolios already have energy holdings that are performing well, so I’m not looking to add another company just for the sake of it. If I were to add an energy stock, Capital Power would be my preferred choice of the two.
With that bit of housekeeping done, my radar list now stands at these five companies.
- Mattr Corp. (TSE: MATR): A small cap Canadian industrial technology company that designs and manufactures specialized infrastructure products using advanced materials. The company may not be familiar to most investors, but its products support industries such as energy, electrification, communications, transportation, and water management. From composite pipes and underground storage tanks to specialized wire and cable solutions, Mattr creates products designed to be lighter, more durable, and resistant to harsh environments. Think of it as a behind-the-scenes supplier helping modern infrastructure operate more safely and efficiently, generating revenue by selling specialized products to industrial customers around the world.
- Capital Power Corporation: A mid cap Canadian power producer that generates electricity from a mix of natural gas, wind, solar and battery storage across North America. With electricity demand rising rapidly from AI data centres, industrial growth and electrification, Capital Power is expanding its natural-gas generation while adding renewable and storage capacity. Its recent agreement to supply 250 MW of power to a new Meta Platforms data centre in Alberta for more than 10 years highlights how the AI boom is creating opportunities beyond the technology companies building the data centres themselves.
- S&P Global (NYSE: SPGI): A large cap American company and one of the world’s most important financial information companies. Most investors know it for the S&P 500 Index, but the business also provides credit ratings, market data, analytics, and research used by banks, corporations, governments, and investors worldwide. Think of it as one of the key information providers that helps global financial markets function, generating revenue through subscriptions, licensing fees, and rating services.
- Ingredion (NYSE: INGR): A mid-cap American ingredient manufacturer that turns plant-based raw materials into starches, sweeteners, fibres, and specialty ingredients used in thousands of everyday products. Its customers span food and beverage, animal nutrition, brewing, and industrial markets. With 10 consecutive years of dividend growth, Ingredion could provide an interesting counterbalance to the more growth-oriented companies in my portfolios.
- Domino’s Pizza (NASDAQ: DPZ): One of the world’s largest pizza chains, with more than 22,000 locations across over 90 markets. Most are independently owned franchises, generating recurring royalties and fees, while Domino’s also sells food and supplies to franchisees. Its strong brand, digital ordering and efficient delivery model support growth. With more than 13 consecutive years of dividend increases, a high double-digit dividend growth rate and a payout ratio below 50%, Domino’s could offer a relatively stable, cash-generating business to balance the higher-growth companies already in the portfolios.
As always, these are not buy recommendations. Make sure to do your own research and choose investments that fit your personal financial goals.
The Radar Check was last updated October 23, 2026.


That’s a wrap for this week, thanks for reading – may your portfolio stay green and your dividends steady. See you next time!