As the saying goes, fool me once….
Is the rise of the market this week a genuine rise or a bear market rally (a brief rise in stock prices when the overall market has been falling)?

I find myself feeling like Charlie Brown trying to decide if Lucy will pull the ball away at the last second when he attempts to kick it. Charlie Brown knows Lucy will remove the football at the last moment but for some reason he hopes this time it will be different. I find myself in a similar predicament – has the market bottomed or is this a bear rally?
On Tuesday, after three consecutive days of upward movement by all four major North American indexes, I was very tempted to get back in the game and purchase a few shares. Microsoft (NASD:MSFT), Apple (NASD:AAPL) and now Alphabet (NASD:GOOGL or NASD:GOOG) had reported strong quarterly reports. All four indexes were rising, indicating a broad rally. The coast looked clear…. I was ready to try and kick the football.
Late Wednesday afternoon I was thinking about placing an order for Thursday when Meta (NASD:FB), formerly Facebook, had their quarterly earnings report. It disappointed analysts. It got crushed, dropping nearly 27%, wiping out more than USD$ 230 billion in market value.
Not content with wiping out a third of its own market value, Meta triggered a steep drop in other social media stalwarts Twitter (NYSE:TWIT), Pinterest (NYSE:PINS) and Snapchat (NYSE:SNAP) in after hours trading on Wednesday. I felt this sharp decline by some of the big names in the technology/high growth sector did not bode well for Thursday. So instead of trying to kick the football …. I decided to do nothing.
Sure enough, all four Indexes fell during Thursday’s trading session. For once, an investing hunch paid off. To conclude with the Charlie Brown metaphor, by sticking with my plan to see four days of broad upward movement in the market, I was able to avoid taking a run at the proverbial football, only to have it pulled away at the last second. This time. I’m sure the market will fool me again.😊
And now the four-day count of upward movement starts again. One down 3 to go.
Let’s see how the Indexes and portfolios did this past week…
Weekly Market Review
Monday: Looks like the January effect finally showed up. Better late than never. All four major North American Indexes were each up over 1% for the day.
In Canada, the Toronto Stock Exchange Composite Index (TSX) had its best day in almost 6 weeks, led by Technology shares which were up over 5% for the day, with Shopify (TSX:SHOP) up over 10%.
In the US, the Nasdaq Composite Index (Nasdaq) had its worst start of a year since 2008 and barely avoided its worst ever January. Thanks to a strong session today it finished the month down nearly 9%. The S&P 500 Index (S&P) had its worst January since 2009. Both the S&P and Dow Jones Industrial Average (DJIA) had their worst month since March 2020, when the pandemic started. Of the 11 major S&P sectors, all but the energy sector was down for January. So … a two-day rally to end the month. Let’s hope this continues going forward although I expect it to be a bumpy ride.
Tuesday: Although not as strong as Monday’s gains, once again all four Indexes ended the day in positive territory, for a third straight day. The TSX ended up the most at just over 1% which was enough to lift the TSX into the black for 2022. The energy sector was the big winner on both sides of the border as the price of oil is holding near seven-year highs. The energy sector component of the S&P Index is by far the best performing sector in the S&P, up 23% so far this year, compared to the rest of the S&P which is down approximately 5%.
Wednesday: And the beat goes on. For a fourth consecutive trading day, all four Indexes closed in positive territory. On the TSX, the financial and energy sectors more than offset a drop in the technology sector. In the US, the Dow Jones Industrial Average (DJIA), the S&P and the Nasdaq all rose nearly 1%, indicating a broad rally. The Indexes were lifted by a strong quarterly report from Alphabet. However, in an ominous sign, a few of the big social media companies released disappointing results after the market close. Traders will get their first chance to tell these companies what they think about those results on Thursday morning. If its anything like what happened to PayPal (NASD:PYPL), which fell nearly 25%, it won’t be a good day for those companies or the technology heavy Nasdaq, and to a lesser extent, the S&P.
Thursday: A sharp downdraft in the major social media companies spilled over to the technology sector in general, ending the four-day winning streak of all four of the Indexes. On the TSX, Shopify ended the day down over 8% and the technology sector was down almost 5%. South of the border, Meta, formerly Facebook, set a record for the biggest single day fall in value by an American company, falling more than 25% and losing over USD$ 200 billion of its market value. On its way down, Meta took other social media companies in the Communication Services sector with it. Even big technology companies Alphabet, Amazon, and Microsoft that had previously reported strong earnings got caught in the downdraft.
In a possible bit of foreshadowing for both the Bank of Canada and the US Federal Reserve, the Bank of England raised interest rates to .5% from .25%.
Friday: The TSX, the S&P and Nasdaq ended the day in the black while the DJIA ended slightly in the red. However, for the week, all four Indexes ended in positive territory.
In Canada, a rally by the Canadian technology sector, along with the energy and financial sectors, helped the TSX to its largest one week gain in 11 months.
In the US, a great earnings report by Amazon, causing its share price to soar and set the record for largest single day increase, jump started the day. Pinterest and Snap followed up with strong reports, indicating Meta’s slowing numbers were a Meta problem rather than a social media industry problem. As a result, technology companies rebounded from Thursday’s downdraft. Also on the move were energy companies which were buoyed by crude oil prices that hit a seven-year high.
Weekly Portfolio Review
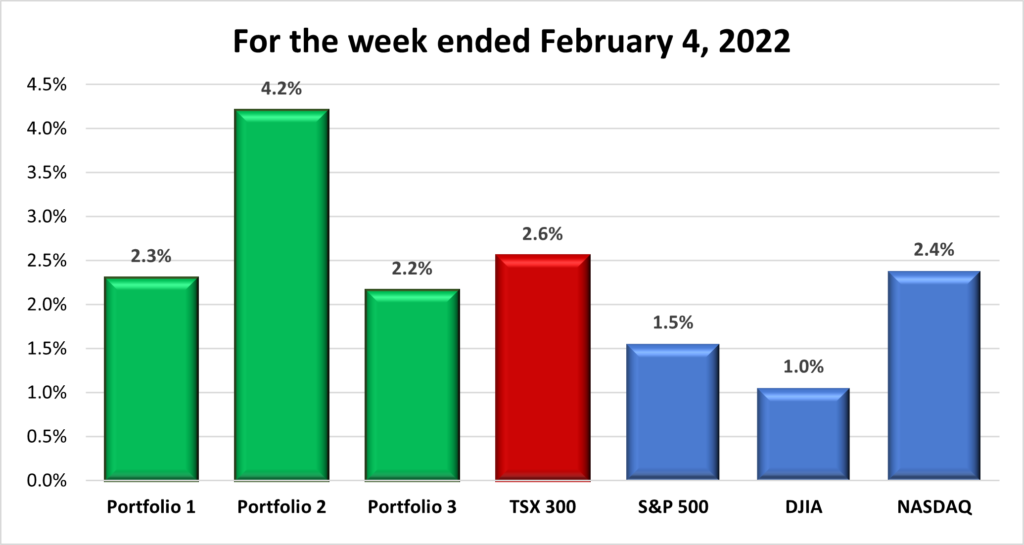
Last week I said I would be happy if one of the portfolios had a positive week. Well, ask and you shall receive. Lo and behold, not only do I get one portfolio in positive territory for the week, but all three finished in positive territory. Even better, all three beat the S&P and DJIA, with Portfolio 2 beating all four Indexes. If I’d known all I had to do was ask, I would have done it along time ago. OK, I wish it were that easy. 😊
Since all three portfolios are technology heavy, its no coincidence that when the technology heavy Nasdaq Index does well (it was the best performing Index of the four), the Portfolios do well. While being technology heavy has negatively impacted the Portfolios for the last two months, this past week it paid off. More weeks like last week, please. 😊
Companies on the Radar
Another quiet week on the hunt for great companies at a fair price. The decline in share prices since late 2021 has made several of the bigger companies more attractive for me. Since they are the same companies as they were a few months ago, but with a cheaper share price, they are a better value. And with Alphabet’s upcoming 20 for 1 stock split, its share price seems more reasonable. I know that 20 shares for $150 costs the same as 1 share for $3,000 but mentally it feels like I’m getting more when I get 20 shares for the same amount as 1 share. Ahhh, the psychology of investing. 😊
Otherwise, the same companies as in previous weeks remain on the radar with Alphabet replacing Visa (NYSE:V). Currently, I like the combination of stability, growth potential, and tailwinds each of these big names brings to the table. It doesn’t hurt that these four all have a dividend, even if it is less than 1% for the technology companies and less than 2% for Home Depot.
Portfolio Update
Portfolio 1
Portfolio 1 for the week ended February 4, 2022: UP ![]()
A strong earnings report from Alphabet, one of the mega technology companies, boosted Portfolio 1 this past week. Alphabet generated record revenues thanks to growth in search advertising, Google cloud, sales of their Pixel phones, and the continued monetizing of its YouTube business. Alphabet also announced a 20:1 stock split. The split will make Alphabet shares much easier for retail investors like me to buy shares. Alphabet is so dominate in multiple areas, that I consider it a Core holding of Portfolio 2 as well as across all three portfolios.
Other highlights were solid earnings report from Pinterest and Unity Software (NYSE:U). Pinterest revenues increased over 50% for the fiscal year while Unity’s revenue grew by 43% for their fiscal year. The only caution was both companies are still losing money but that is typical for high growth tech stocks.
The one disappointing earnings report was PayPal. They had a decent first quarter with revenue up 6% but missed its earnings per share target by $.01. Analysts don’t like misses, even if its by a penny. Payment volumes and net new active users were also down, and they anticipate lower numbers going forward. Analysts don’t like this type of news, so PayPal was punished, and its share price fell nearly 25% on Wednesday.
Lightspeed Commerce (TSX:LSPD) had a decent quarter, but the big news was founder Dax Dasilva resigned as CEO but will remain as Executive Chairman. Lightspeed president JP Chauvet was appointed CEO, assuming the role immediately. Chauvet joined Lightspeed in 2012 and was named President in 2016 so it should be a smooth transition.
As for the other companies in Portfolio 1 that reported last week, all had solid earnings reports. Nothing spectacular, the companies just keep putting up solid numbers.
Activity
No significant activity to report this week.
Dividends
Dividends Received this week for the following companies:
Companies followed by DRIP (Dividend Re-Investment Plan) indicate additional shares were purchased with the dividend. Any cash leftover was added to the cash balance.
Canadian $
Toronto-Dominion Bank (TSX:TD)
US $
No US$ dividends this past week.
Quarterly Reports
General Motors Co.
All currency listed in US dollars
Selected highlights from their fourth quarter 2021 financial results on February 1, 2022
Fourth quarter 2021 highlights
- Net revenue of $33.6 billion compared to $37.5 billion in fourth quarter 2020
- Net income of $1.7 billion compared to $2.8 billion in fourth quarter 2020
- Net income margin of 5.2% compared to 7.6% in fourth quarter 2020
- Diluted Earnings Per Share of $1.16 compared to $1.93 in fourth quarter 2020
2021 highlights
- Net revenue of $127 billion compared to $122.5 billion in 2020
- Net income attribute to shareholders of $10 billion compared to $6.4 in 2020
- Net income margin increased to 7.9% from 5.2% in 2020
- Diluted Earnings Per Share of $6.70 compared to $4.33 in 2020
- Return on Invested Capital of 21.3% compared to 15.0% in 2020
- Record 2021 EBIT-adjusted and EBIT-adjusted margin in a challenging semiconductor and supply chain environment
PayPal Holdings Inc
All currency listed in US dollars
Selected highlights from their fourth quarter 2021 financial results on February 1, 2022
Fourth quarter 2021 highlights
- Revenue up 13% year-over-year to $6.92 billion
- GAAP operating margin of 15.2%, declining .57%
- GAAP EPS of $0.68, down 49%
2021 highlights
- Revenue up 17% year-over-year to $25.4 billion
- GAAP operating margin of 16.8%, up 1.47%
- GAAP EPS of $3.52 down 1%
- 48.9 million Net New Accounts added, bringing total active accounts to 426 million accounts, up 13%
- 19.3 billion payment transactions, up 25%
- Repurchased approximately 15.4 million shares of common stock, returning $3.4 billion to stockholders
Alphabet Inc.
All currency listed in US dollars
Selected highlights from their fourth quarter 2021 financial results on February 1, 2022
Fourth quarter 2021 (unaudited)
- Fourth quarter revenues of $75 billion, up 32% year over year
- Net income of $20.6 billion, up almost 35% year over year
- Earnings per share of $30.69, up almost 38% year over year
2021 highlights (unaudited)
- Revenues of $257 billion, up 41% year over year
- Net income of $76 billion, up almost 89% year over year
- Monthly Average Revenue Per User (ARPU) grew to approximately $290 compared to approximately $180 in the same quarter last year
Lightspeed Commerce Inc
All currency listed in USD dollars
Selected highlights from their Third quarter 2022 financial results on February 2, 2022
- Third quarter revenue grew 165% YoY to $152.7M
- Subscription and transaction-based revenue grew 175% year-over-year to $144.4 million
- ARPU up to $ 290 million compared to $ 180 million in third quarter 2021
- Net loss of ($65.5) million as compared to a net loss of ($42.7) million
BCE Inc.
All currency listed in CAD dollars
Selected highlights from their Fourth quarter 2021 financial results on February 3, 2022
- Fourth quarter 2021 revenue of $6.2 billion, up 1.8% from Fourth quarter 2020’s $6.1 billion
- Net earnings in Q4 declined 29.4% to $658 million
- Cash flows from operating activities in fourth quarter 2021 were $1,743 million, up 6.9% from Q4 2020
- Increase annual common share dividend 5.1%, or $0.18 per share, to $3.68 annually
Skyworks Solutions Inc
All currency listed in US dollars
Selected highlights from their First quarter 2022 financial results on February 3, 2022
- Record Revenue of $1.510 Billion, up 15% Sequentially
- Posts Earnings Per Share of $2.40
- Declared a cash dividend of $0.56 per share of the Company’s common stock
Unity Software Inc
All currency listed in US dollars
Selected highlights from their Fourth quarter 2021 financial results on February 3, 2022
Fourth quarter 2021 highlights
- Revenue was $315.9 million, up from $220.3 million in fourth quarter 2020
- Loss from operations was $144.8 million, or 46% of revenue, compared to loss from operations of $80.8 million, or 37% of revenue, in the fourth quarter of 2020. These results were impacted by an increase in stock-based compensation expenses.
- Basic and diluted net loss per share was $0.56, compared to basic and diluted net loss per share of $0.31 in the fourth quarter of 2020
- More than 1,000 customers spending more than $100,000 each last quarter
2021 highlights
- Revenue was $1.1 billion, an increase of 44% from 2020
- Loss from operations was $531.7 million, or 48% of revenue, compared to loss from operations of $274.8 million, or 36% of revenue, in 2020. Results were impacted by an increase in stock-based compensation expense, as well as a charge of $49.8 million related to the termination of a lease agreement.
- Basic and diluted net loss per share was $1.89, compared to basic and diluted net loss per share of $1.66 in 2020.
- 140% net retention rate
Pinterest Inc.
All currency listed in US dollars
Selected highlights from their Fourth quarter 2021 financial results on February 3, 2022
Fourth quarter 2021 highlights
- Q4 revenue grew 20% year over year to $847 million.
- GAAP net income was $175 million for Q4, including a $49 million one-time share-based compensation charge related to our co-founder’s transition and a $25 million non-cash charitable contribution.
- Revenue was up 16% compared to the same period last year
- Net Income was down 16% compared to the same period last year
2021 highlights
- Revenue grew 52% year over year to $2,578 million
- GAAP net income was $316 million for 2021.
Portfolio 2
Portfolio 2 for the week ended February 4, 2022: UP ![]()
Portfolio 2 has been the most robust portfolio since I started this blog, so I’m not surprised it was the best performer of the portfolios this past week. Almost 75% of the stocks in the portfolio had a good week. The only surprise was Microsoft’s share price finished just below where it started the week. I thought Microsoft would have had a good week, following on the upward momentum from the previous week, but the Meta downdraft put an end to that momentum. Fortunately, Microsoft is back on the rise again, along with the rest of the companies in Portfolio 2.
Activity
No significant activity to report this week.
Dividends
Dividends Received this week for the following companies:
Companies followed by DRIP (Dividend Re-Investment Plan) indicate additional shares were purchased with the dividend. Any cash leftover was added to the cash balance.
Canadian $
TC Energy Corp (TSX:TRP)
US $
No US$ dividends this past week.
Quarterly Reports
Brookfield Energy Partners
All currency listed in CAD dollars
Selected highlights from their Fourth quarter 2022 financial results on February 4, 2022
Fourth 2021 quarter highlights
- Revenues of $1,091 million, compared to $ 952 million for the same period in the previous year
- Net income of $33 million, compared to a net loss of $5 million in the same period in the previous year
2021 highlights
- Funds From Operations of $934 million or $1.45 per Unit, a 10% increase from the prior year
- Declared a quarterly dividend increase of 5%, to $0.32 per share
- Revenues of $4,096 million, compared to $ 3,810 million in the previous year
- Net loss of $66 million, compared to a net loss of $45 million in the previous year
- Diversified the business with the first investment in offshore wind, and expanded the hydroelectric and battery storage portfolios
- Ended the year with over $4 billion of available liquidity and access to significant sovereign and institutional capital providing enhanced flexibility for future growth
Portfolio 3
Portfolio 3 for the week ended February 4, 2022: UP ![]()
The way the week started I thought technology sector heavy Portfolio 3 would get its first winning week of the year. Then the Meta earning report came out and the portfolio fell nearly 10% when Shopify got caught in the technology sector beatdown caused by PayPal’s and Meta’s respective earning reports. Fortunately, the market rallied on Friday to end the week with the first positive week of 2022.
Activity
No significant activity to report this week.
Dividends
Dividends Received this week for the following companies:
Companies followed by DRIP (Dividend Re-Investment Plan) indicate additional shares were purchased with the dividend. Any cash leftover was added to the cash balance.
Canadian $
Toronto-Dominion Bank (TSX:TD)
US $
No US$ dividends this past week.
Quarterly Reports
Unity Software Inc
All currency listed in US dollars
Selected highlights from their Fourth quarter 2022 financial results on February 3, 2022
Fourth 2021 quarter highlights
- Revenue was $315.9 million, up from $220.3 million in fourth quarter 2020
- Loss from operations was $144.8 million, or 46% of revenue, compared to loss from operations of $80.8 million, or 37% of revenue, in the fourth quarter of 2020. These results were impacted by an increase in stock-based compensation expenses.
- Basic and diluted net loss per share was $0.56, compared to basic and diluted net loss per share of $0.31 in the fourth quarter of 2020
- More than 1,000 customers spending more than $100,000 each last quarter
2021 highlights
- Revenue was $1.1 billion, an increase of 44% from 2020
- Loss from operations was $531.7 million, or 48% of revenue, compared to loss from operations of $274.8 million, or 36% of revenue, in 2020. Results were impacted by an increase in stock-based compensation expense, as well as a charge of $49.8 million related to the termination of a lease agreement.
- Basic and diluted net loss per share was $1.89, compared to basic and diluted net loss per share of $1.66 in 2020.
- 140% net retention rate
Brookfield Energy Partners
All currency listed in CAD dollars
Selected highlights from their Fourth quarter 2022 financial results on February 4, 2022
Fourth 2021 quarter highlights
- Revenues of $1,091 million, compared to $ 952 million for the same period in the previous year
- Net income of $33 million, compared to a net loss of $5 million in the same period in the previous year
2021 highlights
- Funds From Operations of $934 million or $1.45 per Unit, a 10% increase from the prior year
- Declared a quarterly dividend increase of 5%, to $0.32 per share
- Revenues of $4,096 million, compared to $ 3,810 million in the previous year
- Net loss of $66 million, compared to a net loss of $45 million in the previous year
- Diversified the business with the first investment in offshore wind, and expanded the hydroelectric and battery storage portfolios
- Ended the year with over $4 billion of available liquidity and access to significant sovereign and institutional capital providing enhanced flexibility for future growth