
When Markets Stop Shrugging It Off
The US/Israel-Iran conflict, which began on February 28, is now about to enter its fifth week as you read this. Despite reports of back-channel peace talks, there are still no clear signs of an end in sight. In my March 6, 2026, Weekly Update, I focused on how a short conflict – what was initially expected – could affect markets. This week, the bigger question is what happens if it lasts longer.
Markets can usually shrug off short-lived geopolitical events fairly quickly. But once something stretches beyond a few weeks, the ripple effects start to become more meaningful.
It all starts with oil. The Middle East is a critical hub for global energy, and even the threat of supply disruptions – especially around key routes like the Strait of Hormuz – can push prices higher. We’ve already seen oil spike above US$100 at times as markets price in that risk. If the conflict drags on, those elevated prices are more likely to stick – and that’s where the real impact begins.
Higher oil prices feed directly into inflation. Gas becomes more expensive, transportation costs rise, and that eventually flows through to everyday items like groceries and travel. While this is often described as “transitory” at first, sustained increases in energy prices can make inflation more persistent and harder to bring back down.
At the same time, higher energy costs act like a tax on consumers, leaving less money for other spending and gradually slowing economic growth.
Put those two forces together – higher inflation and slower growth – and you get a tougher backdrop for markets. This type of environment is often referred to as stagflation, and it puts central banks like the Bank of Canada and the Federal Reserve in a difficult position: support growth by lowering rates or keep them higher to control inflation. That uncertainty is one of the main reasons markets tend to become more volatile during extended conflicts.
For Canada, the picture is mixed. As an energy producer, higher oil prices can support parts of the economy and the TSX. But globally, the story leans more negative, with higher inflation, slower growth, and more cautious investors weighing on broader markets.
If the conflict continues, the impact won’t be evenly spread. In Canada, energy companies like Canadian Natural Resources (TSE: CNQ) could benefit, while consumer-focused businesses – such as Aritzia (TSE: ATZ) and Air Canada (TSE: AC) – may feel the squeeze as higher fuel costs reduce discretionary spending. Industrials and transportation companies like Canadian National Railway (TSE: CNR) could also face rising input costs over time.
In the US, energy producers like ExxonMobil (NYSE: XOM) would likely see a similar boost, but the broader market may face more pressure. Higher inflation could keep interest rates elevated, creating a tougher backdrop for rate-sensitive sectors like technology, including companies such as Microsoft (NASD: MSFT) and Nvidia (NASD: NVDA). Meanwhile, airlines and other fuel-heavy industries like Rocket Lab (NASD: RKLB) tend to be among the hardest hit.
The key is that duration matters. If the conflict resolves quickly, the impact on markets could fade just as fast. But if it lingers, it could shift the environment from short-term volatility to a more sustained period of higher inflation and slower growth – something markets don’t tend to handle particularly well.
For now, investors are still trying to gauge how this conflict will unfold, and as always, expectations can shift quickly. While headlines may continue to drive short-term volatility, staying focused on the bigger, long-term picture is key when making investment decisions. With that in mind, let’s take a look at how the ongoing conflict in the Middle East impacted the markets and my portfolios this week.
Items that may only interest or educate me ….
Canadian Economic news, US Economic news, ….
Canadian Economic news
This past week’s key economic data that the Bank of Canada (BoC) considers when deciding whether to raise or lower the interest rate.
Canadian Market Volatility
Canada’s version of the market “fear gauge” is the S&P/TSX Volatility Index (VIXC), often shown on trading platforms as VIXI.TO. Like the CBOE Volatility Index (VIX) in the US, it measures how much volatility investors expect in the Canadian stock market over the next 30 days.
The index opened the week at 19.31 and briefly spiked above 21 before easing back toward the 20 level, where it hovered for a few days. That relative calm didn’t last. As optimism around a potential ceasefire faded, volatility picked up again, pushing the index back above 21. By the end of the week, it had climbed past 22.5 before settling at 22.11, reflecting growing concerns that a prolonged conflict could push energy prices higher and keep inflation pressures elevated. In turn, that could reduce the chances of a near-term rate cut.
With the index spending much of the week above 20, it points to a more cautious tone in the market, as readings at that level typically signal rising investor unease. Canadian volatility also tends to run lower than in the US, largely because the TSX is more heavily weighted toward financials, energy, and materials – sectors that generally see steadier price movements than the high-growth technology stocks that dominate US markets.
US Economic news
This past week’s key data points that the Federal Reserve (Fed) considers when deciding whether to raise or lower the interest rate.
Consumer Sentiment Index (CSI)
The University of Michigan’s final Consumer Sentiment Index (CSI) reading for March came in at 53.3, down from 55.5 in February and slightly below expectations of 54. Compared to a year ago, sentiment is now 6.5% lower. For context, readings in the 50s are typically associated with low confidence, suggesting consumers are growing increasingly uneasy about the economic backdrop.
Drilling down, the details didn’t offer much reassurance. The Current Economic Conditions Index – which reflects how people feel about their finances and job security today – fell to 55.8, down 1.4% month over month and 12.5% lower than a year ago. Meanwhile, the Expectations Index, which looks six months ahead, dropped more sharply, falling 8.7% to 51.7, though it is still just 1.7% below March 2025 levels. That decline points to growing concern about where the economy may be headed.
At its core, this report is a pulse check on the consumer – and right now, that pulse is weakening. Rising gas prices, market volatility, and ongoing geopolitical tensions are weighing on confidence, both in the present and looking ahead.
For us investors, this matters more than it might seem at first glance. When confidence drops, people tend to spend less – and since consumer spending drives a large part of the economy, that can slow growth. At the same time, rising inflation expectations make it less likely that central banks will cut interest rates anytime soon. It’s a tough combination: slowing growth paired with higher-for-longer rates, which helps explain why markets have been feeling more volatile lately.
American Market Volatility
The CBOE Volatility Index – often called the market’s “fear gauge” – tracks how much volatility investors expect over the next 30 days. Think of it as the market’s pulse: while readings above 20 signal rising uncertainty, levels above 30 – where the VIX both started and ended the week – point to elevated fear and heightened market stress.
The index started the week elevated at 30.1, as concerns around escalating tensions between the US and Iran raised fears that higher oil prices could lead to broader inflation. As the week unfolded, the VIX moved within a range of roughly 25 to 27.5, reflecting the back-and-forth nature of headlines as tensions eased and then flared up again. By the end of the week, volatility picked up once more, with the VIX climbing back above 31 before closing at 31.05 slightly higher than where it began, and a sign that investor anxiety continued to build.
Weekly Market and Portfolio Review
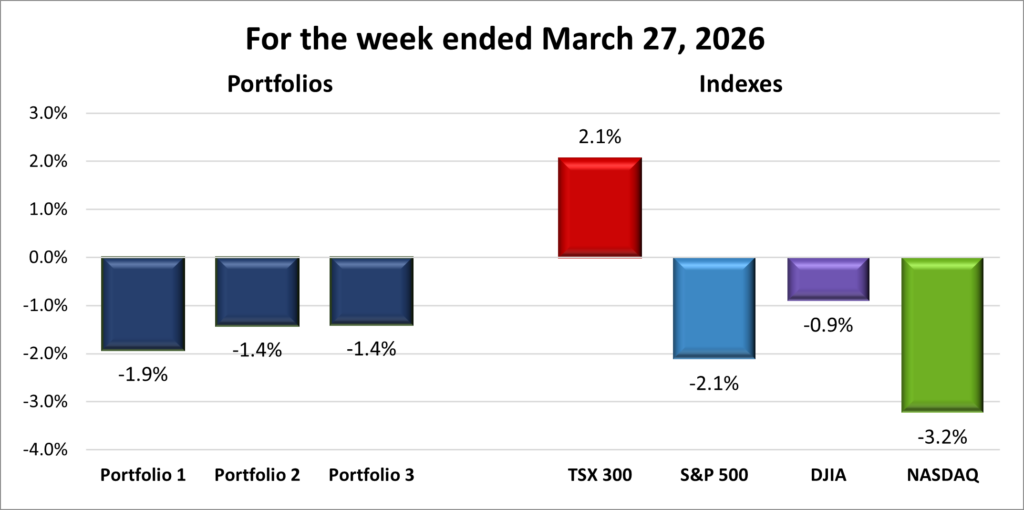
For the week, the TSX (SPTSX) gained 2.1%, the S&P 500 (SPX) fell 2.1%, the DJIA (INDU) slipped 0.9% and the Nasdaq (CCMP) dropped 3.2%.
| Index | Weekly Streak |
| TSX: | 1 – week winning streak |
| S&P: | 5 – week losing streak |
| DJIA: | 5 – week losing streak |
| Nasdaq: | 5 – week losing streak |

 Fresh off last week’s losses, markets started strong, but the US–Israel conflict’s fourth week quickly turned things into a rollercoaster. By the end, indexes finished mixed. Canada’s resource-heavy Toronto Stock Exchange Composite Index (TSX) was the only one in the green, while American indexes – the S&P 500 (S&P), Dow Jones Industrial Average (DJIA), and Nasdaq Composite Index (Nasdaq) – struggled as fading expectations for 2026 rate cuts weighed on sentiment.
The TSX kicked off the week with its best day in five weeks, extending its winning streak to three sessions by midweek. US markets also surged early, posting their biggest single-day gains since February, but momentum quickly faded. Volatility picked up, with the S&P and Nasdaq posting their largest single-day drops since the conflict began. By Friday, all three US indexes hit their lowest levels since September 2025. The Nasdaq and DJIA slipped into correction territory, down more than 10% from their October 29, 2025, and February 10, 2026, highs, respectively. Meanwhile, the S&P posted its longest weekly losing streak since 2022, finishing down for a fifth straight week.
It was a headline-driven week, with every twist in the conflict moving markets. Oil prices swung sharply – falling on hopes for peace talks, then surging as tensions escalated. Brent crude closed just above $110 per barrel, as geopolitical tensions kept prices elevated – adding to concerns that higher energy costs could feed into inflation. Fertilizer prices became another casualty, spiking as higher energy costs and shipping disruptions made production and delivery more expensive and difficult. Rising energy costs stoked fears that inflation could broaden and remain elevated, reducing the likelihood of near-term rate cuts and keeping investors focused on inflation risks. Even if the conflict ends soon, lingering effects – higher energy costs, slower economic growth, and uncertain interest rate paths – could keep markets choppy.
Fading rate cut expectations also hit the technology sector hard, especially the Magnificent 7 [link to mag 7] mega-cap companies, which lost over $330 billion on Friday alone, bringing their total weekly drop to roughly $870 billion. That is a lot of money!
In Canada, the TSX faced similar pressures but held up better early in the week thanks to its energy-heavy makeup. Rising oil prices lifted energy stocks, but the downside was gold had its worst week since 2011 before a late rebound. The price of gold dropped because as oil surged and concerns about persistent inflation grew, expectations for interest rate cuts moved further out. Higher rates make bonds and other income-generating assets more attractive, and since gold doesn’t pay interest, investors often rotate out of it when yields rise. With investors now pricing in multiple BoC rate hikes before the end of 2026, gold is likely to face continued headwinds.
Once again, it was a challenging week. In the US, recession fears are rising, while in Canada, the bigger concern is stagflation – a mix of slowing growth and rising inflation. That uncertainty limited gains and kept markets choppy. Until there are clearer signs of how and when the conflict will resolve, volatility is likely to continue – but for us long-term investors, it can also create opportunities. 😊
| Portfolio | Weekly Streak |
| Portfolio 1: | 2 – week losing streak |
| Portfolio 2: | 5 – week losing streak |
| Portfolio 3: | 3 – week losing streak |
These portfolio losing streaks are starting to feel frustrating. With no clear end to the conflict – and with that uncertainty pushing out expectations for lower interest rates – there’s a good chance these losing streaks will continue before things turn around. 😊
Once again, it was a tough week across all three portfolios, although there was a brief moment of optimism. By the end of Thursday, Portfolios 1 and 3 were actually in the green. Unfortunately, that didn’t last. Markets slid again on Friday, with the semiconductor sector leading the decline. Nvidia, the largest holding in Portfolios 1 and 2, fell more than 4% on the week, which all but guaranteed both portfolios would finish in the red. ☹
Portfolio 1 had the weakest showing, falling 1.9%. The pullback in the Magnificent 7 weighed heavily and more than offset gains from energy holdings. Losses were widespread, with only 17% of holdings finishing the week higher. Among the biggest decliners were The Trade Desk (NASD: TTD), down 12%, and Celsius Holdings (NASD: CELH), which dropped 19%.
Portfolio 2 had a tough week, slipping 1.4%. It had the highest percentage of winners at 34%, with all energy positions posting gains and helping cushion the downside. Still, the volume of losses proved too much to overcome, including a 12% drop in MongoDB (NASD: MDB).
Portfolio 3 completed the trifecta, also declining 1.4% after entering Friday in positive territory. With its two largest holdings – Nvidia and Shopify (TSE: SHOP), which together make up roughly half the portfolio – both posting losses, the odds were already stacked against it. Only 33% of holdings finished higher, although there were some bright spots, including a 16% gain from Alvopetro Energy (TSE.V: ALV). Vertiv Holdings (NYSE: VRT) briefly looked like it might provide a lift after hitting a record high midweek, but it gave back those gains, falling more than 10% over the final two sessions.
That pretty much sums up the week. All three portfolios started strong, buoyed by optimism around a potential ceasefire, but optimism turned to skepticism as doubts of a quick end to the conflict crept in. Rising concerns around inflation and “higher-for-longer” interest rates hit the more interest-sensitive sectors – especially technology and consumer discretionary – hard. With all three portfolios leaning heavily toward technology companies, it wasn’t a great combination. ☹
I’m not expecting a turnaround next week—but I’ll still be crossing my fingers for one. 😊
Companies on the Radar
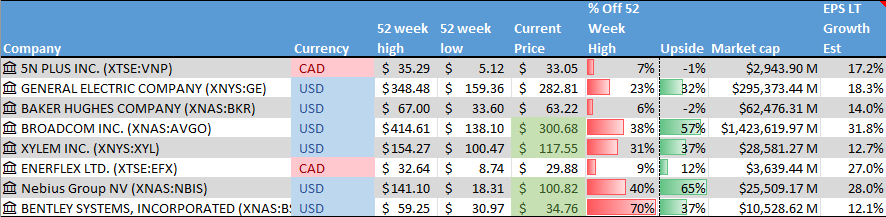
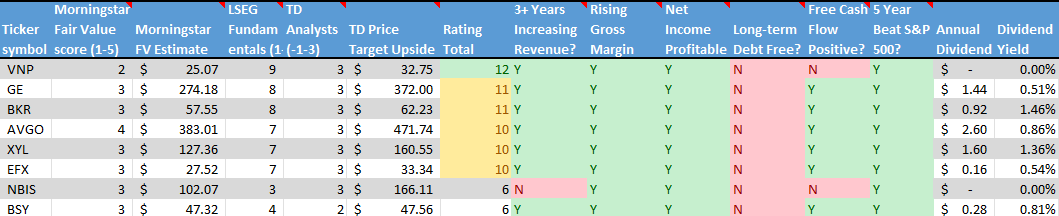
 This week, three very different companies made their way onto my radar: Bentley Systems, Incorporated (NASD: BSY), Baker Hughes Company (NASD: BKR), and Nebius Group N.V. (NASD: NBIS).
Bentley Systems caught my attention as a classic “behind-the-scenes” business. Its software helps engineers design and manage essential infrastructure like bridges, railways, and power systems. It may not grab headlines, but it plays a crucial role in the real world – and once companies build their workflows around it, they rarely switch.
Baker Hughes brings a completely different angle. It provides the equipment and technology that help produce and manage energy across the globe, from traditional oil and gas to newer areas like carbon capture and hydrogen. It’s an interesting way to gain exposure to energy today while also keeping an eye on where the industry could be heading.
Nebius Group adds a more growth-oriented flavour to the mix. The company is building infrastructure for artificial intelligence (AI), including cloud platforms and high-powered computing systems. In many ways, it’s supplying the “picks and shovels” for the AI boom – though, like most emerging opportunities, it comes with a bit more uncertainty.
With these additions, my radar list now sits at eight companies. I’m looking forward to narrowing that down to a more focused group of five next week – getting one step closer to identifying the best businesses and one that I’d be proud to own. 😊
- 5N Plus Inc. (TSX: VNP): a small-cap Canadian company that produces high-purity specialty metals and semiconductor materials used in space solar power, renewable energy, medical imaging, and electronics. Many of its products are mission-critical, requiring consistent quality and long-term supply. With exposure to space programs, clean energy, and strategic materials, 5N Plus operates in several niche but expanding markets where technical expertise creates competitive advantages.
- GE Aerospace (NYSE: GE): This is the large American aviation and defence business that remained after General Electric split into three separate companies in 2024. It has been on a strong run thanks to high demand for commercial jet engines as global air travel continues to recover. The company focuses on aircraft propulsion systems and services for both commercial and military customers, and it’s also moving into drones. As a global leader in jet engines and aircraft systems, GE Aerospace offers exposure to long-term trends in travel, defence spending, and emerging aviation technology.
- Broadcom (NASD: AVGO): A large cap American company that sells semiconductors and software globally. It designs critical chips used in data centres, networking equipment, and broadband infrastructure, playing a behind-the-scenes role in cloud computing and AI. Broadcom also owns a growing enterprise software business following its acquisition of VMware, giving it exposure to both hardware and software spending tied to AI and cloud growth.
- Xylem Inc. (NYSE: XYL): This is a large American company that develops water technology focused on moving, treating, and managing water. Its products and services are used by utilities, industrial customers, and municipalities for everything from clean drinking water and wastewater treatment to flood control and leak detection. With aging water infrastructure and more frequent climate challenges like droughts and flooding, demand for Xylem’s solutions is still strong. The business offers exposure to long-term, essential infrastructure spending tied to water scarcity, sustainability, and smarter cities.
- Enerflex Ltd. (TSE: EFX): a Calgary-based industrial company that provides engineered energy infrastructure and transition solutions for the global natural gas and power markets. Enerflex designs, manufactures, installs and services equipment and modular facilities – including gas compression, processing systems, power generation and treated water solutions – that are critical to natural gas midstream and industrial operations. With a global footprint and expertise spanning engineering, fabrication and after-market support, Enerflex operates in markets where reliable energy handling and infrastructure are essential, and where long-term contracts and technical integration create competitive advantages.
As always, these are not buy recommendations. Make sure to do your own research and choose investments that fit your personal financial goals.
The Radar Check was last updated March 27, 2026.
That’s a wrap for this week, thanks for reading – may your portfolio stay green and your dividends steady. See you next time!