AI Turns From Tailwind to Disruptive Headwind
This past week, markets came under pressure as investor sentiment around software companies shifted sharply. While higher interest rates and stretched valuations had already been weighing on the sector, what really rattled investors was a growing belief that parts of the software and professional services industry may be facing real disruption, not just a temporary slowdown.
There’s a certain irony to this shift. Many of these companies were initially seen as some of the biggest beneficiaries of artificial intelligence (AI) – well-positioned to use automation to boost productivity, lock in customers, and expand margins. Instead, investors are now grappling with the idea that the same technology expected to strengthen these businesses could eventually challenge the very products they sell. AI firm Anthropic, the maker of the Claude chatbot, recently introduced a legal plugin for its Claude Cowork product. The tool is designed to automate many routine legal tasks that have traditionally been billed by the hour. What once took hours – tasks such as reviewing contracts, triaging non-disclosure agreements, managing compliance workflows, preparing legal briefs, and generating templated responses – can now be done in minutes, fuelling investor concerns that AI could eventually pressure the billable-hour business model used by many law firms.
Software stocks – particularly legal software and publishing firms – are often valued on the assumption of long-term growth, steady demand, and recurring subscription revenue. These businesses have long been viewed as “safe growth,” especially in professional services where customers rely on specialised tools and switching costs are high. That perception allowed valuations to climb well above the broader market.
New AI tools such as Cowork highlighted how quickly AI is moving into areas once thought to be relatively insulated from automation, including legal research, contract analysis, compliance work, and document drafting. These are core tasks that underpin many high-margin software and data products. Even if AI doesn’t replace these tools outright, the concern is that it could change how value is created and captured. If fewer hours are spent researching or drafting, or if AI-powered alternatives become cheaper and more flexible, traditional subscription models could face pricing pressure over time. For companies built around selling access to information and workflows, that’s a meaningful shift.
Because many of these stocks were already trading at premium valuations, there was little margin for uncertainty. Once investors began questioning whether growth might be structurally challenged rather than temporarily slowed, markets moved quickly to reprice those risks.
That said, disruption doesn’t automatically mean destruction. Many of the companies caught up in this sell-off are already investing heavily in AI themselves. They bring advantages that newer entrants often lack – deep domain expertise, trusted customer relationships, proprietary data, and products that are deeply embedded in day-to-day workflows.
In legal software and professional services especially, accuracy, accountability, and trust still matter. Large organisations need tools that integrate seamlessly with existing systems, meet strict compliance standards, and offer reliable support. In many cases, AI is more likely to be embedded into these platforms rather than replace them outright, becoming a feature that enhances productivity rather than a standalone competitor. In other words, AI didn’t suddenly undermine these businesses – but it did introduce enough uncertainty for investors to treat it as a short-term headwind almost overnight.
For us investors, a company’s ability to evolve matters more than short-term price swings. The challenge is separating companies that can adapt from those that may struggle, or perish, as the industry changes. The recent sell-off reflects uncertainty, not final outcomes. Markets often reprice expectations long before the real-world impact of new technology becomes clear.
The AI-driven shake-up in software and professional services this week is a reminder that markets move on expectations as much as fundamentals. While AI is creating uncertainty in some sectors, let’s take a look at what else moved the major indexes and how portfolios performed over the past week.
Items that may only interest or educate me ….
US Government Takes a Time Out, Canadian Economic News, US Economic News
US Government Takes a Time Out
This past week, the US federal government experienced another shutdown – this time only a partial one that lasted a few days, unlike the full six-week shutdown in October and November 2025. The partial shutdown began at 12:01 a.m. EST on January 31, 2026, because Congress hadn’t passed all the annual funding bills needed to keep federal agencies running. While the Senate had approved most of the funding package, the House of Representatives hadn’t, and both chambers needed to agree on the full set of bills – particularly funding for the Department of Homeland Security (DHS) – before the deadline. Under US law, agencies can’t legally spend money without approved funding, so operations for the affected departments had to pause.
The main roadblock was DHS funding and related policy disagreements, including disputes over immigration enforcement and proposed reforms. When Democrats withdrew support for DHS funding without those changes, and the House didn’t approve a revised deal in time, a lapse in funding triggered the partial shutdown. Because only some appropriations had been passed, this was a partial shutdown rather than a full one, meaning agencies with approved funding continued operating while others paused.
The shutdown ended quickly after Congress passed a new funding bill, signed into law on February 3, 2026. The legislation funds most federal agencies through the end of the fiscal year (September 30, 2026) and provides a short-term extension for DHS while longer-term funding is negotiated.
For us non- US investors, the biggest impact was the delay in key economic reports, like this week’s US labour data.
Canadian Economic News
This past week’s key economic data that the Bank of Canada (BoC) considers when deciding whether to raise or lower the interest rate.
Labour Force Survey (LFS)
Statistics Canada’s January employment report showed that the labour market weakened, with a loss of 24,800 jobs after adding 8,200 positions in December. Economists had been expecting about 7,000 new jobs. Despite the decline in employment, the unemployment rate fell to 6.5% from 6.8% in December, marking the lowest level since September 2024. That apparent contradiction reflects fewer Canadians actively looking for work – a common reason the jobless rate can fall even when employment declines.
Looking beneath the headline numbers, most of the job losses came from part-time positions, which were partly offset by gains in full-time employment. Manufacturing saw notable job losses during the month, while employment increased in information, culture, and recreation industries. On a year-over-year basis, manufacturing employment remains lower, while health care and social assistance continued to lead job growth. Wage growth remained moderate, with average hourly earnings rising about 3.3% year over year, continuing the gradual cooling trend seen in recent months.
Overall, the mixed picture – slower job growth, a lower unemployment rate, and steady wage gains – reinforces the view that Canada’s labour market is cooling but still relatively resilient. From an interest-rate perspective, this report gives the BoC little reason to move rates in either direction for now.
Canadian Market Volatility
Canada’s “fear gauge,” the VIXC (tracked by the VIXI), showed early signs of cooling at the start of the week, opening Monday at 18.50 after ending the prior week near 19.34. Volatility continued to ease through much of the week. Despite lingering concerns around AI-driven disruption and a pullback in gold, silver, and other precious metals, the VIXI mostly traded in the 17–18 range before dropping further to close Friday at 16.42 after the TSX rebounded at the end of the week.
Readings near 20, such as at the start of the week, suggest anxiety is starting to creep in – investors become more defensive, risk appetite fades, and markets grow more sensitive to negative headlines. However, the steady drift lower in the VIXI suggests nerves have been settling rather than intensifying.
US Economic news
This past week’s key data points that the Federal Reserve (Fed) considers when deciding whether to raise or lower the interest rate.
Labour data
The first week of a new month is usually when investors get their first look at fresh US labour data. This time, that rhythm was disrupted after the Bureau of Labor Statistics (BLS) was affected by the partial federal government shutdown that began at midnight on Saturday, January 31. While the shutdown was resolved by February 3, the disruption delayed several key reports. The Job Openings and Labor Turnover Survey (JOLTS) arrived a few days later than usual, and the January Jobs Report – officially known as the Employment Situation Summary (ESS) – is now scheduled for release on February 11.
ADP National Employment Report (ADP)
January’s ADP report showed private-sector hiring came in much weaker than expected, with just 22,000 jobs added. That fell well short of the roughly 45,000 positions analysts had forecast and marked a slowdown from December’s downwardly revised gain of 37,000. The report also pointed to a broader cooling trend in private hiring, with total job gains in 2025 running well below 2024’s pace, even as wages for workers who stayed in their roles rose about 4.5% year over year. Hiring was concentrated in education and health services, while professional and business services and manufacturing saw job losses, highlighting how uneven conditions remain across industries. Because ADP tracks only private employers, it provides a useful – though incomplete – snapshot of the labour market.
Job Openings and Labor Turnover Survey (JOLTS)
The latest JOLTS report reinforced the idea that the US labour market is cooling rather than overheating. Job openings fell to 6.5 million in December, below expectations of 7.2 million and down from 6.9 million in November, marking the lowest level since September 2020. With fewer unfilled positions, modest hiring, and quit rates holding steady, the data suggests that workers have less leverage than they did during the post-pandemic boom.
Summary
The JOLTS report, together with the ADP Employment data, are two key indicators of labour market strength. These softer readings reinforce signs that the jobs market is cooling, even as unemployment stays relatively low. That’s why markets pay close attention to reports like these – a cooler labour market can ease inflationary pressure and eventually open the door to interest rate cuts. With the official government jobs data due next week, investors should get a clearer picture of the overall labour market.
Consumer Sentiment Index (CSI)
The University of Michigan’s preliminary CSI report for February came in better than expected, rising to 57.3 from January’s final reading of 56.4, above economists’ expectations for a reading closer to 55. The modest improvement was largely driven by consumers with larger stock portfolios, who reported slightly better views on their finances and buying conditions. While this marks a 1.6% month-over-month gain and the third straight monthly increase, sentiment is still subdued, sitting 11.4% below year-ago levels and well below historical norms. Even so, it’s the strongest reading since August 2025, suggesting confidence may be slowly returning.
Looking under the hood, the Current Economic Conditions Index – which reflects how consumers feel about their jobs, income, and day-to-day finances – rose 5.2% to 58.3 from 55.4 in January. That improvement is encouraging, but the index is still down 11.3% from a year ago. Meanwhile, the Expectations Index, which looks ahead to the next six months, edged slightly lower to 56.6 from 57.0 and remains about 11.6% below last year’s level, highlighting ongoing uncertainty about the future.
Overall, the report suggests consumers are feeling a bit better than they were a few months ago, but concerns around costs, job security, and the broader economic outlook continue to weigh on confidence.
American Market Volatility
The CBOE Volatility Index (VIX), often called the market’s “fear gauge,” opened the week at 18.06 and climbed as investor unease grew around AI-driven disruption in software and publishing stocks. Volatility built through the week, peaking near 22 by Thursday’s close – a clear sign that caution had intensified. A strong rebound rally on Friday, however, helped calm nerves, pulling the VIX back down to 17.76 by week’s end.
Think of the VIX as the market’s pulse. Readings above 20 signal heightened anxiety, with investors becoming more defensive and markets more sensitive to negative headlines. The pullback below 18 by Friday suggests that while concerns around AI and interest rates haven’t disappeared, fear eased as investors stepped back from worst-case scenarios. In other words, uncertainty remains, but panic didn’t take hold.
Weekly Market and Portfolio Review
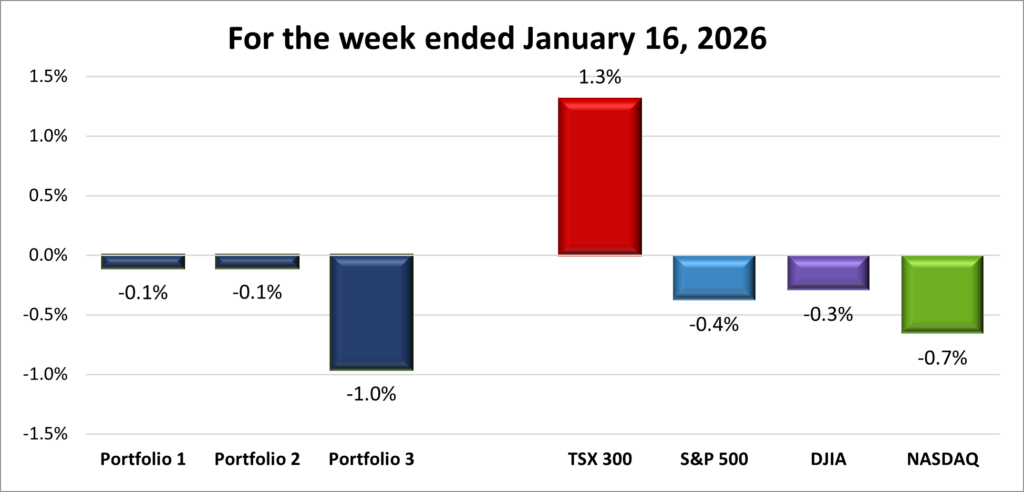
For the week, the TSX (SPTSX) gained 1.7%, the S&P 500 (SPX) slipped 0.1%%, the DJIA (INDU) jumped 2.5% and the Nasdaq (CCMP) declined 1.8%.
| Index | Weekly Streak |
| TSX: | 1 – week winning streak |
| S&P: | 1 – week losing streak |
| DJIA: | 1 – week winning streak |
| Nasdaq: | 4 – week losing streak |
![]()
![]() After a volatile start, markets finished the week in mixed fashion – and it could have been a lot worse. What began as a cautious pullback tied to AI spending concerns quickly turned into a broader test of investor confidence before a late-week rebound steadied the ship. In the US, all three major indexes – the S&P 500 (S&P), Dow Jones Industrial Average (DJIA), and Nasdaq Composite Index (Nasdaq) – came under pressure early as AI worries intensified. A strong Friday rally helped the DJIA close above the 50,000 mark for the first time ever, while limiting weekly losses in the S&P and Nasdaq as both snapped three-day losing streaks. The S&P also posted its best single-session gain since May 2025.
After a volatile start, markets finished the week in mixed fashion – and it could have been a lot worse. What began as a cautious pullback tied to AI spending concerns quickly turned into a broader test of investor confidence before a late-week rebound steadied the ship. In the US, all three major indexes – the S&P 500 (S&P), Dow Jones Industrial Average (DJIA), and Nasdaq Composite Index (Nasdaq) – came under pressure early as AI worries intensified. A strong Friday rally helped the DJIA close above the 50,000 mark for the first time ever, while limiting weekly losses in the S&P and Nasdaq as both snapped three-day losing streaks. The S&P also posted its best single-session gain since May 2025.
Uncertainty had already been building earlier in the week. Investors speculated about which version of Kevin Warsh they might get if he became the next Fed Chair – the more hawkish version similar to his time as a Fed Governor, or a more dovish voice aligned with President Trump’s push for faster rate cuts. At the same time, lingering questions around the scale and sustainability of massive AI infrastructure spending continued to weigh on sentiment.
The real shock came when AI disruption hit closer to home. A broad selloff followed after AI startup Anthropic unveiled new tools capable of automating legal work and conducting financial research – tasks traditionally billed by the hour and often taking days to complete. The announcement highlighted how quickly AI is moving into white-collar work once thought relatively insulated from automation, forcing investors to rethink who ultimately benefits from the AI boom.
That shift hit technology stocks hardest, particularly software and data-driven businesses. The S&P and Nasdaq slid as long-term growth assumptions were reassessed, with the Nasdaq falling to its lowest level since November. Adding to the pressure, Microsoft (NASD: MSFT), Amazon (NASD: AMZN), Alphabet (NASD: GOOGL), and other mega-cap names signalled higher-than-expected AI spending in their earnings presentations, reviving concerns over whether those investments will generate durable returns. As the selloff broadened, investors rotated toward non-technology, blue-chip names. Strong earnings alone are no longer enough – investors want proof that AI is a lasting tailwind, not a disruptive headwind.
Meanwhile, the American economy continues to grow, but the labour market is showing signs of strain. January recorded the highest number of job cuts for that month since the depths of the Great Recession in 2009, according to Challenger, Gray & Christmas, a US-based executive outplacement and business consulting firm. That raises a difficult question: will hiring rebound to match growth, will growth slow to reflect a weaker labour market, or could AI and automation allow expansion without meaningful job creation?
In Canada, the TSX opened February with three straight gains, led by strength in energy and precious metals as commodity prices rebounded. That momentum faded as gold and silver pulled back, while global volatility and a more cautious investor mindset weighed on the resource-heavy index. Still, the TSX rebounded from Thursday’s selloff to post its best single-day performance since October 14, 2025, finishing the week in positive territory despite the turbulence.
In the end, the week was less about deteriorating fundamentals and more about shifting sentiment – driven by the disruptive force of AI. Markets don’t like sudden uncertainty, so it’s no surprise volatility picked up as labour markets cooled and expectations shifted. On the bright side, that volatility created a few attractive buying opportunities. 😊
| Portfolio | Weekly Streak |
| Portfolio 1: | 4 – week losing streak |
| Portfolio 2: | 1 – week winning streak |
| Portfolio 3: | 4 – week losing streak |
![]()
![]() After Thursday’s AI-driven selloff in the software sector, I was bracing for a rough week across all three portfolios. The Friday rally helped claw back some losses, but it was still a tough week, with heavyweight technology companies taking the biggest toll.
After Thursday’s AI-driven selloff in the software sector, I was bracing for a rough week across all three portfolios. The Friday rally helped claw back some losses, but it was still a tough week, with heavyweight technology companies taking the biggest toll.
Nvidia (NASD: NVDA), the largest holding in two of the three portfolios, fell over 8% after reports that OpenAI was disappointed with its latest AI chips – a blow amplified by the broader AI disruption fears. The Friday rebound trimmed those losses to just 1% for the week, but when your biggest holding loses ground, it can easily turn a winning week into a loss, as it did for Portfolios 1 and 3.
Portfolio 1 fell 2.5% despite 51% of its companies’ recording gains. Big technology companies weighed heavily: Nvidia’s 1% loss, Amazon down 12%, Datadog (NASD: DDOG) down 13%, Shopify (TSE: SHOP) down 15%, and Magnite (NASD: MGNI) down 21% pulled the portfolio down. Bright spots included Hammond Power Solutions’ (TSE: HPS.A) gain of 11%, Alphabet hitting a new all-time high, and Walmart (NASD: WMT) setting a record high as it reached US$1 trillion in market cap becoming the first brick-and-mortar retailer to do so and just the eleventh company overall.
Portfolio 2 was the only portfolio to record a weekly gain, gaining 1.0% as 78% of its holdings posted weekly gains. Hammond Power Solutions 11% gain and Mitek Systems (NASD: MITK) 17% increase stood out, but larger losses in the bigger positions offset smaller gains elsewhere. ☹
Portfolio 3 had the roughest ride, doubling Portfolio 1’s loss, plunging 5.1%. Weekly winners and losers were split 50:50, but Shopify’s 15% decline and Nvidia’s decrease – together representing half the portfolio’s value – ensured the portfolio finished lower. Magnite’s 21% plunge only added salt to the wound. On a brighter note, Brookfield Infrastructure Corporation (TSE: BIPC) set a new all-time high. 😊
This wasn’t the outcome I was hoping for, but it looked far worse before Friday’s rebound. AI-driven volatility rattled markets, yet the late-week rally reinforced a familiar pattern: when fear pushes prices lower, investors don’t stay on the sidelines for long – especially when it comes to high-quality technology leaders. Now, let’s hope Friday’s momentum can carry into the week ahead and all three portfolios will end in the green. 😊

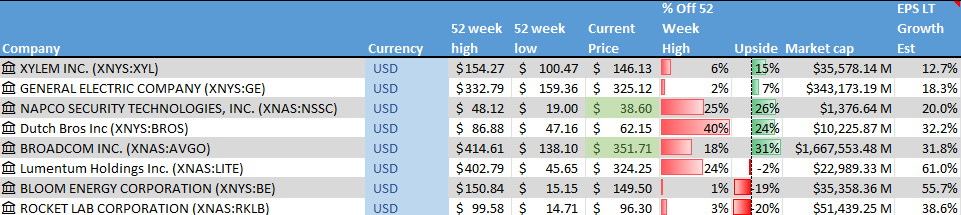
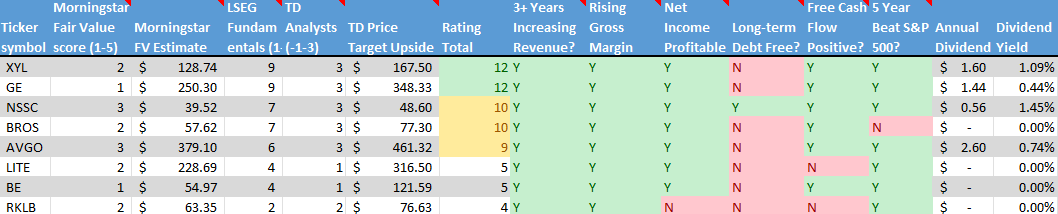
Companies on the Radar
 Another relatively quiet week on my investing radar. No new companies crossed my radar, and I was considering removing Lumentum Holdings (NASD: LITE) from my list. I was all set to drop it when I came across a news article reporting that the stock spiked 10% after the company posted a 65% revenue increase in its second-quarter report. I had thought Lumentum was a key player in the growing AI industry, but both the company and share price had seemed stuck in neutral. Feeling I might have been a bit hasty in my decision to drop Lumentum, I decided to keep it on my Radar List for now.
- GE Aerospace (NYSE: GE): This is the large American aviation and defence business that remained after General Electric split into three separate companies in 2024. It has been on a strong run thanks to high demand for commercial jet engines as global air travel continues to recover. The company focuses on aircraft propulsion systems and services for both commercial and military customers, and it’s also moving into drones. As a global leader in jet engines and aircraft systems, GE Aerospace offers exposure to long-term trends in travel, defence spending, and emerging aviation technology.
- Xylem Inc. (NYSE: XYL): This is a large American company that develops water technology focused on moving, treating, and managing water. Its products and services are used by utilities, industrial customers, and municipalities for everything from clean drinking water and wastewater treatment to flood control and leak detection. With aging water infrastructure and more frequent climate challenges like droughts and flooding, demand for Xylem’s solutions remains strong. The business offers exposure to long-term, essential infrastructure spending tied to water scarcity, sustainability, and smarter cities.
- Dutch Bros Inc. (NYSE: BROS): A rapidly expanding drive-thru coffee chain in the US, known for its energetic customer service and customizable drinks. The company is aiming to open at least 160 new locations by the end of 2025 and has long-term goals of surpassing 2,000 stores. Strong brand loyalty, especially in the Western US, makes this an interesting high-growth story – though still in an aggressive build-out phase.
- Napco Security Technologies, Inc. (NASD: NSSC): A small US company that provides security hardware and systems like smart locks, intrusion alarms, fire alarms, and access control solutions. It sells through a network of distributors and installers, and has been increasing its recurring service revenue – something investors usually like to see. As demand for security and smart home products grows, Napco has multiple avenues for expansion.
- Broadcom (NASD: AVGO): A large cap American company that sells semiconductors and software globally. It designs critical chips used in data centres, networking equipment, and broadband infrastructure, playing a behind-the-scenes role in cloud computing and AI. Broadcom also owns a growing enterprise software business following its acquisition of VMware, giving it exposure to both hardware and software spending tied to AI and cloud growth.
- Lumentum Holdings: A large cap US-based optical technology company that makes key components used to move data at extremely high speeds across cloud and data-centre networks. Products like electro-absorption modulated lasers (EMLs) are seeing rising demand as AI workloads require faster and more efficient connections between servers. As large cloud providers continue ramping up AI infrastructure spending, Lumentum has emerged as a key beneficiary of this next wave of data and connectivity growth.
As always, these are not buy recommendations. Make sure to do your own research and choose investments that fit your personal financial goals.
The Radar Check was last updated February 6, 2026.


That’s a wrap for this week, thanks for reading – may your portfolio stay green and your dividends steady. See you next time!

 Today, the TSXV is still one of the most active junior markets in the world. Companies like Kraken Robotics (
 The NYSE built its reputation around large, established companies with long operating histories. That focus on scale, stability, and global reach cemented its status as the world’s most recognizable stock exchange – a place where blue-chip giants like Visa (
 Launched in 1971 as the world’s first fully electronic stock market, it replaced the trading floor with computers from day one. Its original name – the National Association of Securities Dealers Automated Quotations – made its mission clear. Over time, it was simply shortened to “Nasdaq.”
 When we hear that the BoC or the Fed “sets interest rates,” what they’re really setting is a target overnight rate. It’s called the overnight rate – sometimes referred to as the benchmark rate – because it applies to very short-term loans, literally overnight, between major financial institutions. Think large banks lending to one another to make sure they have enough cash on hand at the end of each business day, such as TD Bank (