If the Conflict Stays Short, These Sectors Could Move Most
Last week I looked at the recent US and Israeli strikes on Iran from an investor’s perspective. The situation is still evolving, but one of the key questions for markets is how long the conflict might last. If the fighting remains relatively short – perhaps four to five weeks – history suggests the economic impact would likely be uneven rather than universally negative.
Geopolitical shocks tend to push markets into a brief “risk-off” phase where investors shift away from more cyclical or economically sensitive sectors and toward industries that benefit directly from higher energy prices or global uncertainty. The result is often a temporary reshuffling of winners and losers across sectors rather than a lasting change to the overall economic outlook. This week, I’ll discuss how a four-to-five week conflict could impact three of the key sectors that move the markets in Canada, as well as three that drive the US market.
Canada’s market is unusually resource- and bank-heavy compared with most global markets. Energy (~18–22%), Basic Materials (~10–12%), and Financials (~30–35%) together account for well over half of the Toronto Stock Exchange Composite Index (TSX).
In Canada, the Energy sector would likely be the most immediate beneficiary. Oil prices have already surged as tensions around the Persian Gulf raise fears about supply disruptions and the safety of shipping routes like the Strait of Hormuz. Because Canada is one of the world’s major oil exporters, higher global crude prices typically translate into stronger revenues and cash flows for Canadian energy producers. Even a short conflict could therefore provide a temporary boost to earnings expectations across the sector.
The Basic Materials sector could also see a lift, though for slightly different reasons. Gold and other precious metals often attract investor interest during geopolitical tensions as traditional “safe haven” assets. At the same time, industrial metals such as copper and aluminum can become more volatile as markets reassess global growth expectations and supply chain risks.
Canadian Financials, however, would likely face more mixed conditions. Banks tend to perform best in stable economic environments, and geopolitical uncertainty can dampen investor sentiment and reduce deal-making activity. A short conflict probably wouldn’t materially damage bank fundamentals, but it could create short-term volatility as markets price in the possibility of slower global growth or delayed interest rate cuts.
The US market is structured quite differently, with Technology dominating the S&P 500 (S&P) (~30%), while Consumer Cyclicals (~10–11%) and Industrials (~8–9%) also play major roles in driving economic growth and market sentiment.
Market leadership in the United States could look quite different during the same conflict. Technology stocks, which have led the market over the past several years, can be sensitive to rising energy prices and inflation expectations. Higher oil prices can make future earnings from high-growth companies less valuable in today’s dollars, which can weigh on valuations of technology companies. At the same time, supply chains tied to semiconductor manufacturing could face disruptions if energy markets or logistics routes are affected.
Consumer Cyclicals companies could also be vulnerable in the short term. These businesses depend heavily on discretionary spending, and higher fuel and energy costs effectively act as a tax on consumers by leaving less money available for travel, retail purchases, and other non-essential spending. Historically, these sectors tend to weaken during geopolitical crises as investors shift toward more defensive areas of the market.
Finally, Industrials could experience a split outcome. Companies tied to global shipping, transportation, or manufacturing may face higher input costs and logistical disruptions. On the other hand, aerospace and defence companies sometimes benefit from increased military spending and heightened geopolitical tensions.
For investors, the key takeaway is that a short conflict would likely produce a temporary reshuffling of sectors rather than a broad economic shock. Energy and defensive assets often lead during the early stages of geopolitical crises, while more growth-oriented or consumer-sensitive sectors temporarily lag behind.
Markets tend to adjust quickly once the trajectory of a conflict becomes clearer. Currently, tensions show no sign of easing, but if they begin to cool within a few weeks, the sectors that initially struggled are often the same ones that recover the fastest as investors shift back toward growth and risk-taking.
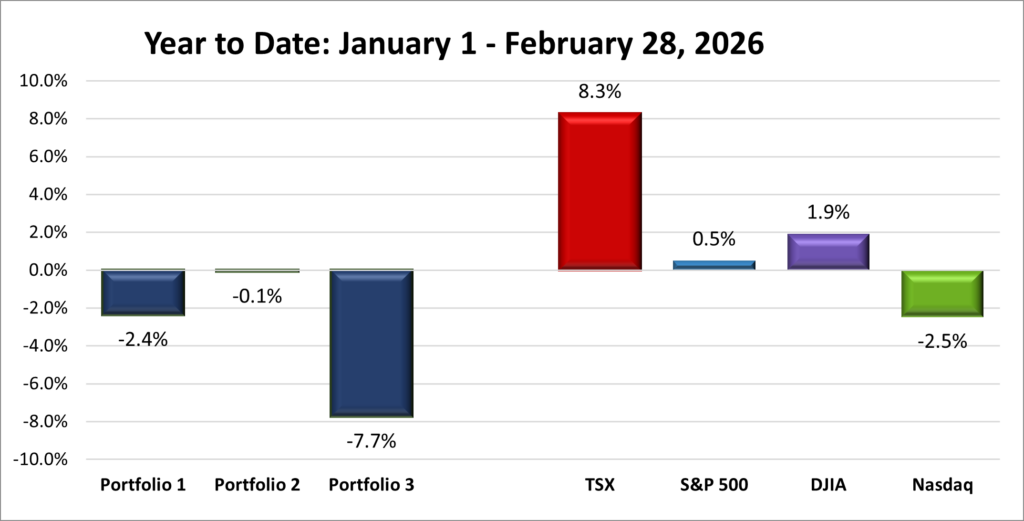
With investors still digesting the latest geopolitical developments, let’s take a look at how the conflict – along with the latest economic data – affected the markets and my three portfolios.
Items that may only interest or educate me ….
Canadian Economic news, US Economic news,
Canadian Economic news
This past week’s key economic data that the Bank of Canada (BoC) considers when deciding whether to raise or lower the interest rate.
Labour Force Survey (LFS)
Statistics Canada’s February employment report showed the labour market losing momentum, with the economy shedding 84,000 jobs. The sharp decline surprised analysts, who had expected a modest gain of about 10,000 positions. The drop follows a loss of 24,800 jobs in January, suggesting hiring may be starting to slow.
The unemployment rate rose to 6.7%, up from 6.5% in January and slightly above expectations. Full-time employment took the biggest hit, falling by more than 100,000 jobs. The youth unemployment rate jumped to 14.1%, highlighting how younger workers are often the first to feel the effects when hiring weakens.
Despite the job losses, wage growth remained relatively firm, with average hourly wages rising about 3.9% compared with a year earlier. Taken together, the report points to a labour market that is beginning to soften, adding another layer of uncertainty to an economy already dealing with geopolitical tensions and volatile energy prices. Along with last week’s weaker US labour report, the data suggests the North American labour market may be starting to cool.
Canadian Market Volatility
Canada’s version of the market “fear gauge” is the S&P/TSX Volatility Index (VIXC), often tracked on trading platforms under the ticker VIXI.TO. Like the American VIX, it measures how much volatility investors expect in the Canadian stock market over the next month.
The index opened the week at 20.67 after rising tensions between the United States and Iran pushed oil prices close to US$120 per barrel. Volatility eased slightly midweek, with the index drifting down toward 19, before climbing back above 20 as surging oil prices and rising inflation concerns unsettled investors. It ultimately finished the week at 21.39.
Readings in the high-teens typically signal caution, while levels above 20 suggest investors are becoming more uneasy about market risks. Canadian volatility also tends to run lower than in the US because the TSX is heavily weighted toward banks, energy, and materials – sectors that generally experience steadier price movements than the high-growth technology stocks that dominate American markets.
US Economic news
This past week’s key data points that the Federal Reserve (Fed) considers when deciding whether to raise or lower the interest rate.
Consumer Price Index (CPI)
The latest US inflation report showed that prices are still creeping up, but not out of control. The Bureau of Labor Statistics (BLS) said that monthly inflation rose 0.3% in February, right in line with expectations, following a 0.2% increase in January. Over the past year, headline inflation – which measures all items – came in at 2.4%, unchanged from January.
Looking closer, energy prices were a mixed bag. Fuel oil for home heating jumped 11.1% in February, while electricity actually fell 0.7%. On a yearly basis, gasoline prices were down 5.6%, but natural gas delivered to homes climbed 10.9% over the past year.
Shelter costs, which include rent and homeowner-related expenses and make up the largest portion of the CPI, rose 0.2% in February. Over the year, shelter inflation held steady at 3.0%, the same pace as January.
Core inflation, which strips out food and energy to show underlying price trends, increased 0.2% in February, following a 0.3% rise in January. On an annual basis, core CPI remained at 2.5%, slightly above the Fed’s 2% target.
This latest inflation data shows inflation isn’t running out of control, but it’s not falling quickly either. That means the Fed is unlikely to change interest rates immediately. However, this data reflects prices before the recent jump in energy costs from the ongoing US–Israel–Iran conflict, so March inflation could look noticeably higher.
In short, the Fed has room to stay cautious but won’t likely cut rates soon, especially if energy prices keep climbing. For us investors, this means markets may stay sensitive to geopolitical events and energy price swings in the near term.
Personal Consumption Expenditures (PCE)
The Commerce Department’s Bureau of Economic Analysis (BEA) reported that the PCE price index – the inflation measure the Fed watches most closely – rose 0.3% in January, slowing slightly from a 0.4% increase in December. On a year-over-year basis, inflation came in at 2.8%, a small step down from 2.9% in December and roughly in line with economists’ expectations.
Meanwhile, core PCE, which excludes food and energy prices to give a clearer picture of underlying inflation trends, rose 0.4% for the month, matching December’s increase. On an annual basis, core inflation cooled to 2.8% from 3.0%, suggesting that while inflation is gradually easing, progress toward the Fed’s 2% target is still slow.
Taken together, the report shows inflation is cooling modestly but still running above the Fed’s comfort zone. In simple terms, prices aren’t rising faster, but they’re not falling quickly enough either. That likely gives the Fed another reason to remain cautious about cutting interest rates too soon.
It’s also worth noting that this report reflects price data before the recent surge in oil prices, up more than 40% since the Iran conflict began. If energy prices stay elevated, the impact may show up in the next few inflation reports, potentially pushing readings higher in the months ahead.
Gross Domestic Product (GDP)
The Commerce Department’s second estimate of fourth-quarter GDP showed the US economy grew at an annualized pace of 0.7%, sharply below the 1.4% reported initially and down from 4.4% in the third quarter, signaling that economic momentum slowed significantly at the end of 2025. Softer consumer spending, weaker exports, reduced business investment, and a prolonged government shutdown all contributed to the downward revision.
Taken together with weaker job growth and persistent inflation, the revised GDP numbers suggest the economy is slowing while costs remain elevated, leaving the Fed in a tricky spot as it balances growth and price stability. Slower growth combined with rising energy prices from geopolitical tensions adds another layer of uncertainty for investors as they assess how the economy may unfold in the months ahead.
Labour data
Normally, the BLS’s Job Openings and Labor Turnover Survey (JOLTS) report comes out in the first week of the month. However, the brief government shutdown at the end of January caused the report to be delayed.
Labor Department’s Job Openings and Labor Turnover Survey
The January 2026 JOLTS report showed job openings unexpectedly climbed to about 6.95 million, up from roughly 6.55 million in December and above economists’ forecasts. The job openings rate rose to around 4.2%, signaling that demand for labour is still fairly strong even as broader job growth shows signs of slowing. For context, the annual average of job openings in 2025 was 7.1 million, down 571,000 from 2024.
Overall, the report paints a picture of a stable but cautious labour market. Employers still have plenty of positions posted, but many aren’t acting quickly to fill them, and workers appear less willing to switch jobs. Combined with previous labour data showing softer employment momentum, it suggests the US labour market is cooling – not collapsing.
Consumer Sentiment Index (CSI)
The University of Michigan’s preliminary March reading of the Consumer Sentiment Index (CSI) fell to 55.5, down from February’s final 56.6 but slightly above expectations of 55. This marked the lowest reading for 2026, driven largely by rising gasoline prices and uncertainty around the ongoing US–Israel–Iran conflict, which has pushed energy costs higher and weighed on how people view their finances and the broader economy.
Breaking it down, the Current Economic Conditions Index, which reflects how people feel about their finances and job security today, rose 2.1% to 57.8 but remains nearly 10% below last year. In contrast, the Expectations Index, which gauges sentiment over the next six months, slipped to 54.1 from 56.6 in February and is down 2.9% year over year. While current conditions held up modestly, Americans are growing more cautious about the months ahead, as reflected in the weaker Expectations Index. Because consumer confidence often drives household spending – a major engine of economic growth – this softening suggests the US economy may be losing some momentum.
American Market Volatility
The CBOE Volatility Index (VIX) – often called the market’s “fear gauge” – measures how much volatility investors expect in the stock market. Think of it as the market’s pulse: readings above 20 typically signal rising caution among investors.
The index opened the week at 35.12, its highest level since the market selloff triggered by President Trump’s major US tariff announcements. The spike came after Iran named a new hardline president, escalating tensions with the United States and pushing oil prices higher. Volatility eased midweek, with the VIX briefly falling to 22.5, before climbing back above 27 after Iran attacked two tankers attempting to transit the Strait of Hormuz and vowed to keep the critical shipping route closed. Concerns about rising oil prices and the potential for higher inflation kept volatility elevated, with the index finishing the week at 27.19.
Weekly Market and Portfolio Review
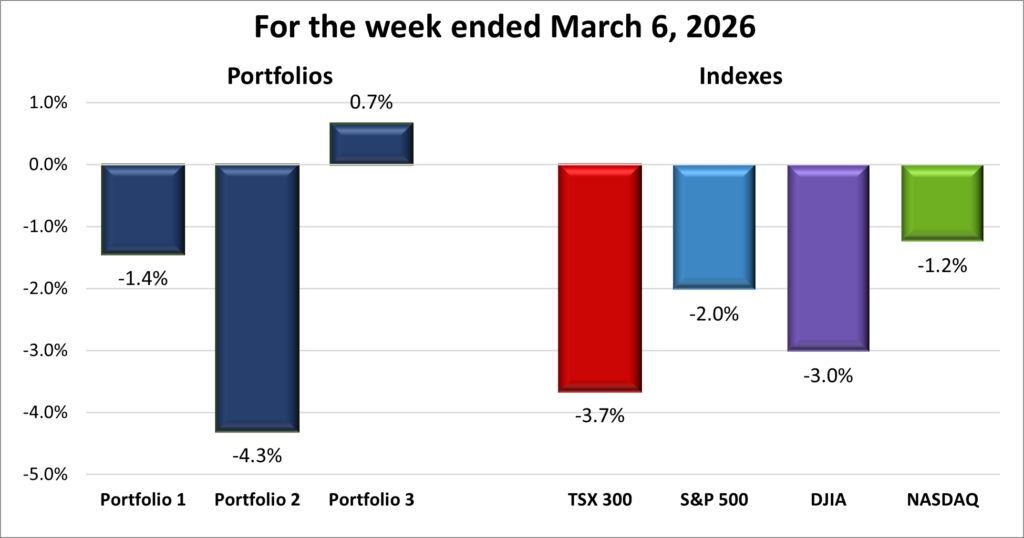
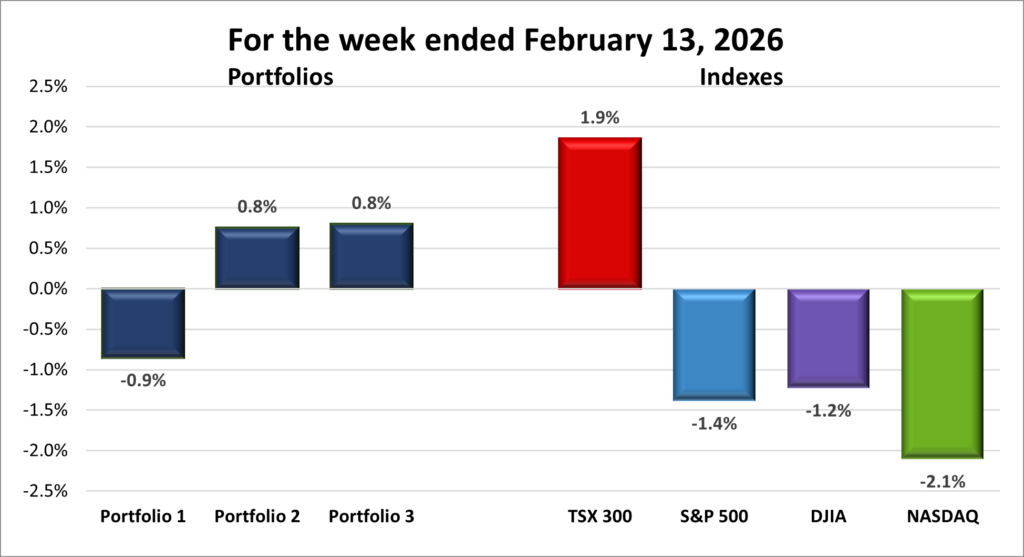
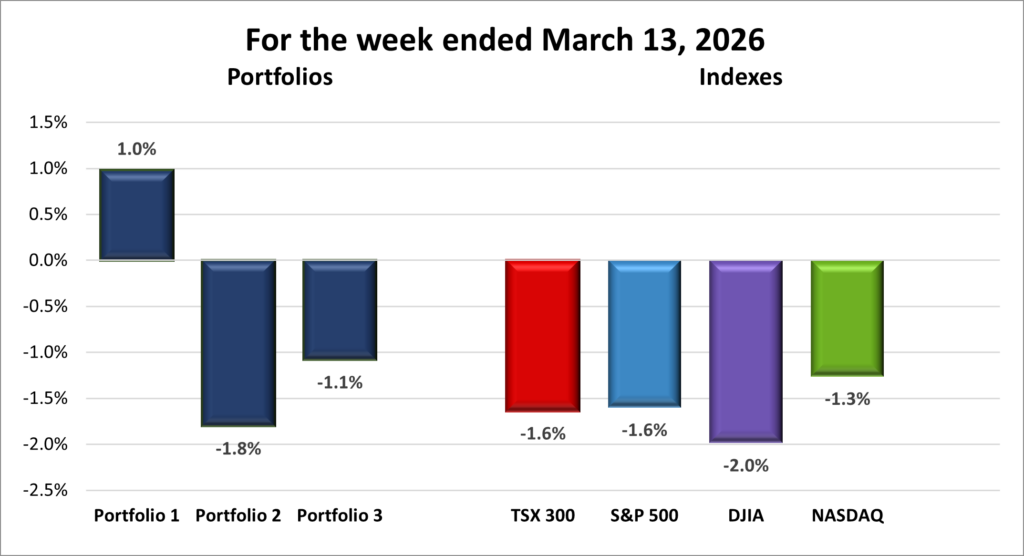
For the week, the TSX (SPTSX) and the S&P 500 (SPX) both fell 1.6%, the DJIA (INDU) dropped 2.0% and the Nasdaq (CCMP) slipped 1.3%.
| Index | Weekly Streak |
| TSX: | 2 – week losing streak |
| S&P: | 3 – week losing streak |
| DJIA: | 3 – week losing streak |
| Nasdaq: | 3 – week losing streak |
![]() Rising geopolitical tensions and a sudden surge in oil prices dominated markets this week, adding to existing concerns about artificial intelligence (AI) spending, inflation, and slowing economic growth.
Rising geopolitical tensions and a sudden surge in oil prices dominated markets this week, adding to existing concerns about artificial intelligence (AI) spending, inflation, and slowing economic growth.
This week didn’t start on the strongest footing. Markets were already on edge after much weaker-than-expected US labour data at the end of the previous week, and over the weekend oil prices surged above US$100 per barrel before pulling back, immediately adding another layer of uncertainty. With that backdrop, it was little surprise that all four major indexes – the TSX, S&P, Dow Jones Industrial Average (DJIA), and Nasdaq Composite (Nasdaq) – finished the week in the red. If you’re looking for something positive, the TSX and Nasdaq did manage to post back-to-back gains midweek (I know, that’s reaching 😊).
Energy markets quickly became the focal point as the conflict between the US, Israel, and Iran raised fears of disruptions to global oil supplies. Oil prices swung sharply as mixed signals from Washington added to the uncertainty. At times President Trump warned Iran of stronger military action, while at other moments he suggested the conflict could end quickly. Iran remained defiant, launching attacks on commercial shipping in the Gulf, hitting several vessels and setting two oil tankers ablaze while warning oil could reach US$200 per barrel.
Crude prices briefly surged to nearly US$120 per barrel early Monday before slipping back below US$100 as markets assessed the risk of supply disruptions. To stabilize energy markets, the President Trump said the US Navy would escort oil tankers through the Strait of Hormuz, while the International Energy Agency coordinated a release of oil from strategic reserves among its 32 member countries. The US also eased restrictions on some Russian crude exports to help offset supply disruptions. Even with those measures, oil hovered just above US$100 per barrel by the end of the week – its highest level since August 2022 after Russia’s invasion of Ukraine – raising concerns that higher energy costs could ripple through the global economy.
Economic data added another layer of uncertainty. This week’s reports show inflation remains above the Fed’s 2% target while growth may be slowing. Rising energy costs combined with a cooling economy raise the specter of stagflation, where inflation rises while the economy weakens, leaving the Fed in a difficult position as it balances inflation risks against weakening growth.
These geopolitical risks arrived at a time when investors were already grappling with other uncertainties, including massive spending on AI infrastructure and inflation that stays stubbornly above the Fed’s 2% target.
The story was similar in Canada, although the TSX’s heavy exposure to energy companies created a slightly different dynamic. As oil prices surged early in the week, energy stocks helped provide some support for the Canadian market. Even so, the broader index struggled as investors weighed the economic risks of rising oil prices and escalating tensions in the Middle East. Canada’s February labour report added to the uncertainty, showing a sharp loss of jobs rather than an expected gain, and a rise in the unemployment rate to 6.7%. Higher energy costs raise the possibility of renewed inflation at a time when economic growth may already be slowing. While strength in the energy sector helped cushion some of the downside, weakness across many other sectors ultimately pushed the TSX lower by the end of the week, in line with the declines seen in US markets.
In the end, investors on both sides of the border were reacting to the same forces: rising oil prices, geopolitical tensions, and renewed concerns about inflation. The question now is whether higher energy prices will prove to be a short-lived geopolitical shock or the start of another inflation problem for the global economy.
| Portfolio | Weekly Streak |
| Portfolio 1: | 1 – week winning streak |
| Portfolio 2: | 3 – week losing streak |
| Portfolio 3: | 1 – week losing streak |
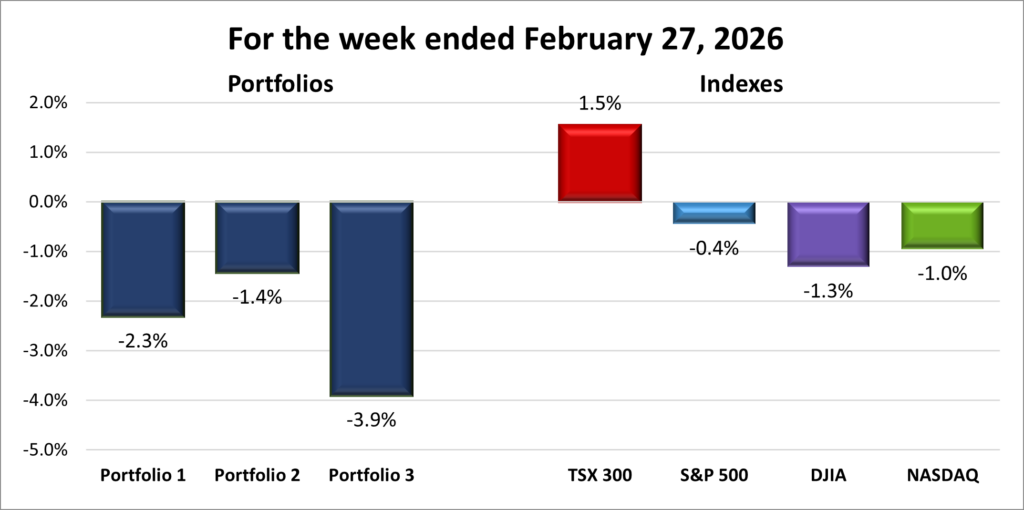
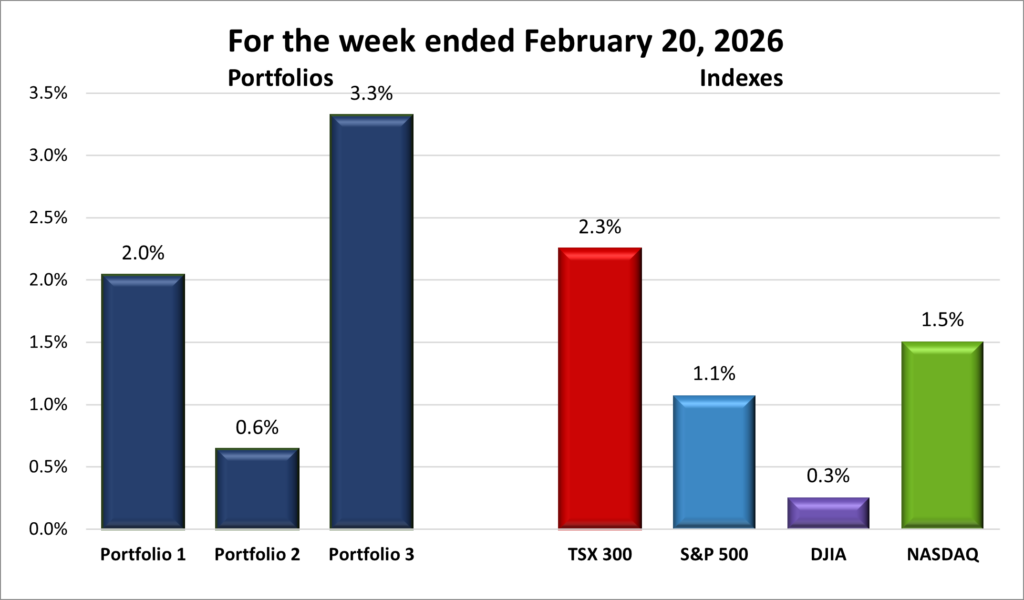
![]()
![]() With all four indexes finishing in the red, it didn’t look like any of my portfolios would escape unscathed. To my surprise, the damage wasn’t as bad as I expected. Helping limit losses was Nvidia (NASD: NVDA), the largest holding in Portfolios 1 and 3, which posted a 1.8% gain during an otherwise turbulent week. If it had moved the other way, Portfolio 1 would likely have finished in the red and Portfolio 3 would have fallen much deeper. As it turned out, Portfolio 1 was the only portfolio or index to finish in positive territory, while Portfolio 3 still managed to outperform the broader market.
With all four indexes finishing in the red, it didn’t look like any of my portfolios would escape unscathed. To my surprise, the damage wasn’t as bad as I expected. Helping limit losses was Nvidia (NASD: NVDA), the largest holding in Portfolios 1 and 3, which posted a 1.8% gain during an otherwise turbulent week. If it had moved the other way, Portfolio 1 would likely have finished in the red and Portfolio 3 would have fallen much deeper. As it turned out, Portfolio 1 was the only portfolio or index to finish in positive territory, while Portfolio 3 still managed to outperform the broader market.
Portfolio 1 was the top performer, gaining 1.0% despite only 49% of holdings advancing. Alongside Nvidia, Kraken Robotics (TSEV: PNG) and Constellation Software (TSE: CSU) rose 16% and 15%, respectively, while Magnite (NASD: MGNI) dragged the portfolio down with a 12% loss.
Portfolio 2 slipped 1.8%, somewhat surprisingly given that 55% of its holdings gained. With the highest exposure to energy stocks, I expected it to benefit more from the oil surge, but that support wasn’t enough to offset weakness elsewhere.
Portfolio 3 ended down 1.1%, with 47% of holdings higher. The biggest drag was goeasy (TSX: GSY), which plunged after forecasting a C$178 million fourth-quarter incremental charge-off and suspending its dividend and share repurchases. The stock fell more than 67% for the week. I sold after the initial drop, when it was down about 60%, but the damage was already done. Magnite’s 12% decline added pressure, though Nvidia’s gain and Vertiv Holdings (NYSE: VRT) – which somehow hit a record high –helped soften the blow.
In the end, it was a week that showed just how unpredictable markets can be. A handful of strong performers helped offset broader weakness, while goeasy’s collapse was a painful illustration that surprises – both good and bad – are part of investing. Considering the rough market backdrop, the portfolios held up better than I expected. Despite the market’s ups and downs, my focus remains the same: own strong businesses and let time do the heavy lifting. 😊
Companies on the Radar
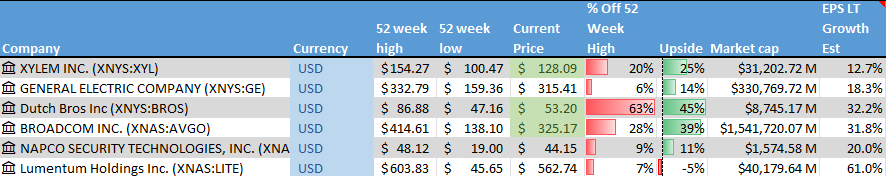
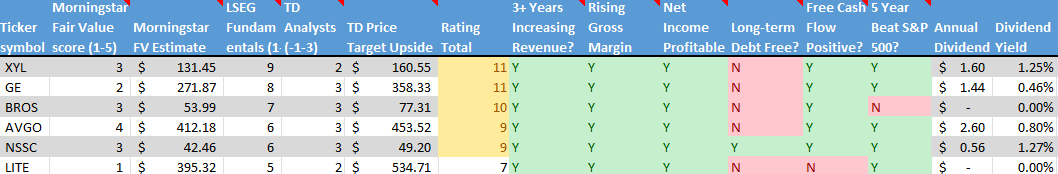
 After a few weeks of companies coming and going from my radar list, things were relatively quiet on the investing front this past week. The only change was the promotion of Napco Security Technologies, Inc. (NASD: NSSC), which is now part of Portfolio 2. Napco is the small-cap American company that develops security and access control systems that are sold through professional security dealers and installers to homes and businesses, while also generating a growing stream of high-margin recurring service revenue.
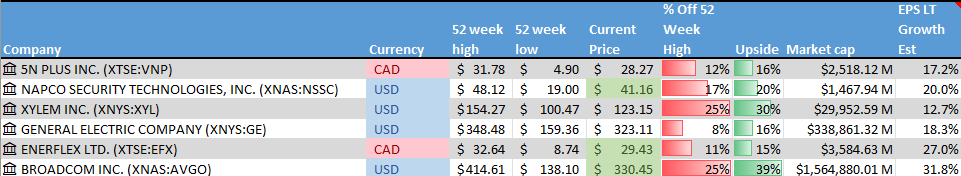
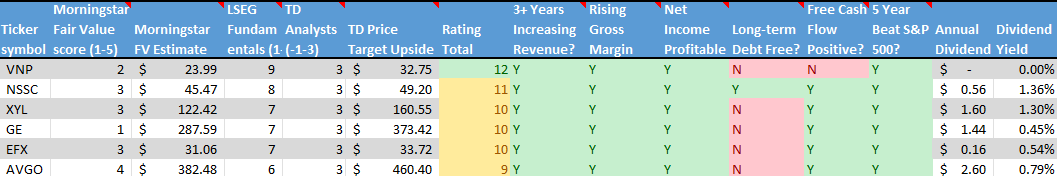
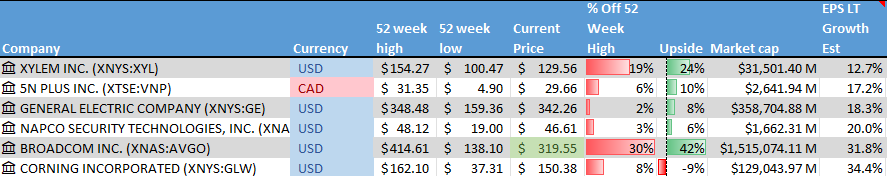
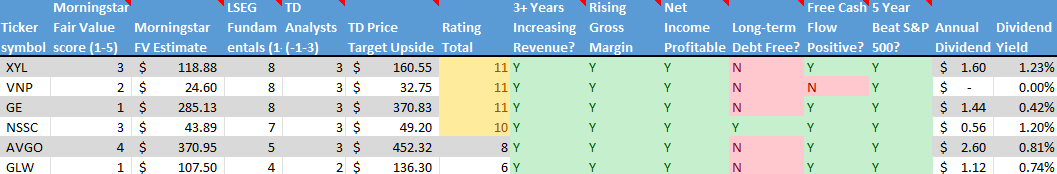
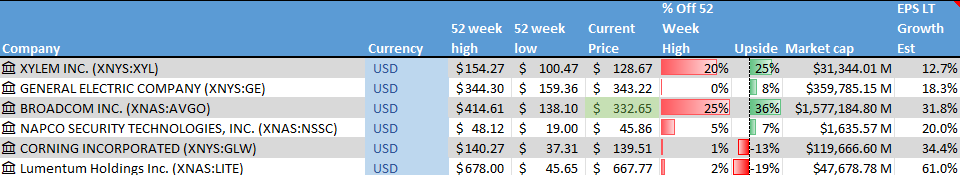
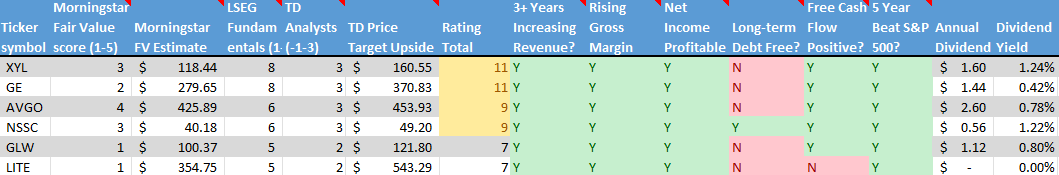
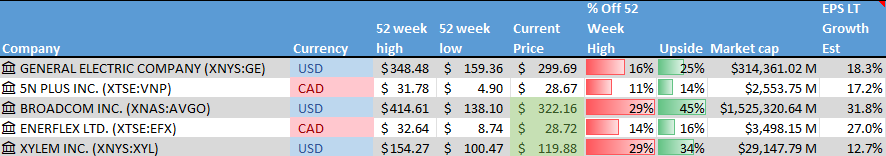
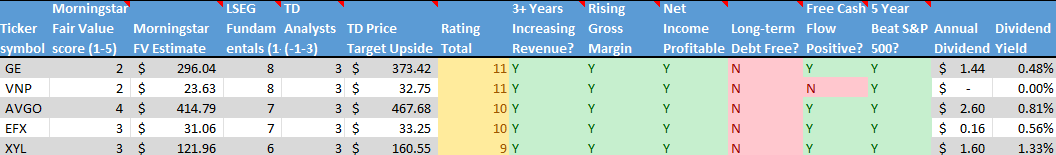
With Napco moving into Portfolio 2, the number of companies on my radar list has now fallen to these five:
- GE Aerospace (NYSE: GE): This is the large American aviation and defence business that remained after General Electric split into three separate companies in 2024. It has been on a strong run thanks to high demand for commercial jet engines as global air travel continues to recover. The company focuses on aircraft propulsion systems and services for both commercial and military customers, and it’s also moving into drones. As a global leader in jet engines and aircraft systems, GE Aerospace offers exposure to long-term trends in travel, defence spending, and emerging aviation technology.
- 5N Plus Inc. (TSX: VNP): a small-cap Canadian company that produces high-purity specialty metals and semiconductor materials used in space solar power, renewable energy, medical imaging, and electronics. Many of its products are mission-critical, requiring consistent quality and long-term supply. With exposure to space programs, clean energy, and strategic materials, 5N Plus operates in several niche but expanding markets where technical expertise creates competitive advantages.
- Broadcom (NASD: AVGO): A large cap American company that sells semiconductors and software globally. It designs critical chips used in data centres, networking equipment, and broadband infrastructure, playing a behind-the-scenes role in cloud computing and AI. Broadcom also owns a growing enterprise software business following its acquisition of VMware, giving it exposure to both hardware and software spending tied to AI and cloud growth.
- Enerflex Ltd. (TSE: EFX): a Calgary-based industrial company that provides engineered energy infrastructure and transition solutions for the global natural gas and power markets. Enerflex designs, manufactures, installs and services equipment and modular facilities — including gas compression, processing systems, power generation and treated water solutions — that are critical to natural gas midstream and industrial operations. With a global footprint and expertise spanning engineering, fabrication and after-market support, Enerflex operates in markets where reliable energy handling and infrastructure are essential, and where long-term contracts and technical integration create competitive advantages.
- Xylem Inc. (NYSE: XYL): This is a large American company that develops water technology focused on moving, treating, and managing water. Its products and services are used by utilities, industrial customers, and municipalities for everything from clean drinking water and wastewater treatment to flood control and leak detection. With aging water infrastructure and more frequent climate challenges like droughts and flooding, demand for Xylem’s solutions is still strong. The business offers exposure to long-term, essential infrastructure spending tied to water scarcity, sustainability, and smarter cities.
As always, these are not buy recommendations. Make sure to do your own research and choose investments that fit your personal financial goals.
The Radar Check was last updated March 13, 2026.
Portfolio Update
Portfolio 2
Bought: Napco Security Technologies, Inc. (NASD: NSSC) With several growth-oriented companies already in the portfolio, I was looking for a business that still offered growth potential but with a more established product base and a clearer path to recurring revenue. Napco Security Technologies stood out as a strong candidate.
Napco develops security and access control systems used in homes, businesses, schools, and government buildings. Its products include intrusion alarms, fire alarm systems, smart locks, and electronic access control solutions. Rather than selling directly to consumers, the company distributes its products through a network of security dealers and installers who integrate them into larger security systems. In simple terms, Napco provides the technology that helps protect buildings and control who can enter them.
What makes the business particularly interesting is its growing recurring service revenue. Many of Napco’s security systems rely on cellular communication services that connect alarm systems to monitoring centres. Each installed system can generate a small monthly fee, which gradually builds into a steady and higher-margin revenue stream as more systems are deployed. For investors, recurring revenue tends to be attractive because it can make earnings more predictable over time.
Another appealing aspect of the company is the long-term demand for security and access control. As buildings become smarter and more connected, traditional locks and alarms are increasingly being replaced with digital systems that can be monitored and managed remotely. Schools, hospitals, offices, and apartment buildings all require reliable security solutions, giving companies like Napco multiple avenues for expansion as adoption grows.
Napco is also a relatively small company, which can create opportunities for faster growth if the business executes well. Over the past several years, the company has steadily expanded its product lineup and distribution network while increasing the share of revenue coming from its service-based offerings. In 2023, the company began returning some of that growing cash flow to shareholders through a dividend, and it has already increased the payout several times since then.
That said, smaller companies can also be more volatile. Demand for security hardware can fluctuate with construction cycles and economic conditions, and competition in the security technology space is significant. While the recurring service revenue provides some stability, the business still relies on installers continuing to adopt and deploy its systems.
Overall, Napco adds exposure to a different corner of the technology landscape – physical security and access control – while introducing a business that combines hardware sales with a growing stream of recurring revenue. In many ways, it’s a technology company dressed up as a brick-and-mortar industrial business (technically, its classified in the industrial sector). It’s a smaller company with room to grow and one that could quietly compound over time if demand for connected security systems continues to expand. I’m excited to see how this company grows – it’s always rewarding to be a part-owner of a business with real long-term potential.
Portfolio 3
Sold: goeasy Ltd. I originally invested in goeasy back in May 2019 to take advantage of the growth in non-prime consumer lending. In simple terms, these companies lend money to people who typically can’t easily qualify for traditional bank loans. I felt it was a good growth opportunity, and it also provided a steadily growing dividend. The company had been performing well since my initial investment, right up until March 10, 2026, when it released a surprise update that dramatically changed my expectations about its credit quality and future earnings.
The company reported a sharp increase in expected loan losses, suspended its dividend and share buyback program, and withdrew its financial guidance. Together, those announcements signalled that credit conditions in its lending portfolio may be deteriorating and that management has limited visibility into near-term results. Following the announcement, the share price plunged nearly 60% in a single day.
In situations like this, I like to ask myself a simple question: “Would I buy this stock today knowing what I now know?” If the answer is no, as in this case, selling is often the best choice – regardless of where the price is relative to the past.
With my original investment thesis shifting from growth and dividend expansion to managing rising credit risk, I decided it was better to look for new opportunities rather than hold through what could be an extended period of uncertainty. My goal as an investor is to become an owner of strong, financially resilient businesses, and when a company’s risk profile changes suddenly, it’s worth reassessing whether it still fits that goal. In this case, selling was simply a way to remove exposure to a company whose risk had changed materially – which is often one of the most important steps in protecting a portfolio.
That’s a wrap for this week, thanks for reading – may your portfolio stay green and your dividends steady. See you next time!