2026 says “Hello”
Welcome to 2026 – and to the first Weekly Update of the year. A new year always brings a fresh sense of optimism for us investors, and after the bull market of the past couple of years, the hope is that the bull still has plenty of life in it. As always, there will be noise along the way, but the backdrop heading into 2026 gives investors a few reasons to stay cautiously optimistic.
One of the bigger themes investors are watching is the growing influence President Trump is having on economic policy, particularly through a reshaped Fed that appears more open to easing interest rates. If lower interest rates do materialize in the US, that would be a meaningful tailwind for markets, businesses, and consumers alike. At the same time, some of the uncertainty around trade policy that weighed on sentiment last year is beginning to fade, helping companies plan with a bit more confidence. Add in Trump’s much-discussed “Big, Beautiful Bill,” with its business-friendly tax code changes, and it’s not hard to see why many investors believe 2026 could still offer opportunities – even if the ride has occasional pockets of turbulence.
Beyond that, the overall environment feels sturdier than it did a few years ago. Inflation has cooled enough to be less of a daily headline and has been relatively “well behaved,” giving central banks more flexibility to lower rates and reducing the risk of surprise hikes. For investors, that kind of stability matters – it keeps borrowing costs from becoming a constant headwind and makes planning a little easier for businesses.
At the same time, many companies are focusing on what they can control: improving efficiency, managing costs, and growing profits in practical ways. Artificial intelligence (AI) and productivity gains are starting to show up beyond just the mega-cap names, quietly helping margins over time. Add in a consumer that’s still holding up reasonably well, and a market that continues to reward patience if momentum stays intact, and it’s easier to see why many investors are heading into 2026 feeling hopeful – even while expecting the occasional bout of volatility along the way. Although a smooth upward trajectory would be greatly appreciated. 😊
With that market optimism in mind, let’s take a look at what actually moved the markets over the past week.
Items that may only interest or educate me ….
End of an Era, TFSA contribution limit for 2026, January effect, Canadian Economic news, US Economic news, ….
End of an Era
January 1, 2026, marked the end of an era in investing as 95-year-old Warren Buffett officially handed over the reins of Berkshire Hathaway (NYSE: BRK.B) to his hand-picked successor, Greg Abel. Buffett’s legendary career – spanning more than seven decades – transformed Berkshire from a small, struggling textile company into one of the world’s largest, most influential, and respected conglomerates. The company is one of only two non-technology firms to have crossed the US$1 trillion value threshold.
While Buffett’s presence will be missed, Greg Abel is no stranger to the business. As Vice Chair of Berkshire’s non-insurance operations, he has long been groomed to takeover the leadership of Berkshire, bringing a steady, disciplined approach to the company’s future. Mr. Abel will now be picking the companies Berkshire invests in, while Mr. Buffett will remain as chair, continuing to share his folksy wisdom in the annual shareholder letters. For investors, this transition is a reminder that even the most iconic leadership eventually passes the torch. The key question, of course, is whether the culture that defined Berkshire can endure.
That culture is rooted in the principles that made Berkshire Hathaway a powerhouse in the first place. Buffett focused on businesses he understood, with strong management, predictable earnings, and lasting competitive advantages. He combined patience with financial discipline, holding cash when opportunities were scarce and acting decisively when value appeared. Above all, he thought long-term, letting quality investments compound over time – a philosophy Greg Abel is expected to carry forward.
TFSA contribution limit for 2026
Good news for Canadians starting the year: you can now put another C$7,000 into your Tax-Free Savings Account (TFSA). If you’re new to investing, think of a TFSA as a special account where your money can grow completely tax-free – any interest, dividends, or gains you earn inside the account are yours to keep. Even better, you can take money out whenever you need it, and it won’t count as income or trigger a tax bill.
The annual contribution limit is C$7,000, but if you haven’t maxed out contributions from past years, you may have even more room. TFSAs aren’t just for cash – you can hold stocks, ETFs, and other eligible investments, letting your money work harder for you while staying sheltered from taxes. For new investors, it’s one of the easiest ways to start building long-term wealth without worrying about the taxman taking a cut.
January effect
The January effect is the idea that stocks tend to perform better in January than in other months, particularly small-cap stocks.
The logic is straightforward. Late in the year, investors often sell losing positions to realize tax losses, which can drive down stock prices in November and December. Once the calendar flips to January, that selling pressure fades and fresh money comes back into the market, helping prices rebound.
Historically, the effect showed up most clearly in smaller and more beaten-down stocks, which are more sensitive to year-end selling. That said, it’s far from reliable. As markets have become more efficient, the January effect has weakened and doesn’t appear every year.
Today, it’s best viewed as a seasonal tendency rather than something to trade on blindly – a possible early-year tailwind, but never a guarantee.
Canadian Economic news
This past week’s key economic data that the Bank of Canada (BoC) considers when deciding whether to raise or lower the interest rate.
Labour Force Survey (LFS)
According to Statistics Canada, the December Labour Force Survey showed that employment was largely unchanged, with the economy adding 8,200 jobs. That came in well above expectations for a decline of about 5,000 jobs and continues the slower, more cautious hiring trend seen in recent months. At the same time, the unemployment rate rose to 6.8% from 6.5% in November, partly because more Canadians entered the labour force looking for work. That increase suggests people are still confident enough to job hunt, even as hiring cools.
Looking beneath the headline numbers, most of the gains came from full-time employment, led by areas such as health care and social assistance, construction, and other services. Those gains were partly offset by job losses in sectors like professional and scientific services and accommodation and food services. Wage growth remained moderate, with average hourly earnings rising about 3.4% year over year, continuing a gradual cooling trend.
Overall, the report points to a labour market that’s slowing but not rolling over. Job growth has clearly lost momentum and unemployment is edging higher, but there are no signs of sudden stress. For investors and policymakers alike, it reinforces the idea of a softening economy rather than a sharp downturn as Canada heads into 2026.
Canadian Market Volatility
Canada’s VIXC – essentially the TSX’s own “fear gauge” – began the week at 12.27 and spent most of the time drifting in a calm 12.0–12.5 range, signalling a relatively steady market backdrop. Volatility picked up briefly later in the week, pushing the index above 15 as investors braced for the latest Canadian labour data. Once the jobs numbers from both Canada and the US were out, without any surprises, nerves settled quickly, and the VIXC cooled back down to finish the week at 12.11.
Think of the VIXC as Canada’s market mood ring. Readings in the low teens point to cautious confidence rather than outright stress – investors are alert and paying attention, but there’s no sense of panic in the cabin.
US Economic news
This past week’s key data points that the Federal Reserve (Fed) considers when deciding whether to raise or lower the interest rate.
Labour data
This week’s labour data from three key reports – the Job Openings and Labor Turnover Survey (JOLTS), the ADP Employment Report, and the Employment Situation Summary (ESS) – offers a well-rounded snapshot of the US job market. Each report looks at a different angle: JOLTS measures demand for workers through openings and quits, ADP provides a read on private sector hiring, and the ESS delivers the headline picture with job growth, unemployment, and wages. Together, they help answer a simple question: is the labour market still running hot, or is it cooling?
Labor Department’s JOLTS
The Department of Labor’s JOLTS report for November showed 7.1 million job openings, one of the lowest levels in nearly five years. That was down from a downwardly revised 7.4 million in October and well below expectations of 7.6 million, signalling a continued pullback in labour demand. While the job market remains relatively resilient, the steady decline in openings suggests employers are becoming more cautious after several years of exceptionally tight conditions.
ADP Employment Report
ADP’s December report showed private sector hiring rebounded modestly, with 41,000 jobs added after a revised 29,000 decline in November. While the return to growth was encouraging, it still fell short of expectations for 47,000 new jobs. Hiring was concentrated in service-oriented sectors such as education, health services, and leisure and hospitality, while goods-producing industries continued to shed jobs. Taken alongside JOLTS, the ADP data points to a labour market that’s cooling rather than re-accelerating.
The Bureau of Labor Statistics’ ESS
The Labor Department’s December ESS confirmed that trend. Employers added 50,000 jobs, down from 64,000 in November and below expectations for 60,000, reinforcing the slower hiring pattern seen in recent months. Job gains were again concentrated in health care, social assistance, and leisure and hospitality, with many other sectors showing little change. Despite softer job growth, the unemployment rate edged down to 4.4% from 4.6%, and wage growth cooled to 3.8% year over year, pointing to easing pressure on labour costs.
Summary
Taken together, JOLTS, ADP, and the ESS tell a consistent story: hiring is slowing, wage growth is easing, and the US labour market is losing momentum – but there are still no clear signs of a sharp deterioration. It looks more like a gradual cooling than a sudden break. As a result, investors are increasingly betting that the Fed will have room to ease interest rates later in the year. Investors expect the Fed to keep rates unchanged at the January meeting, with attention shifting to the months ahead, when slowing labour market momentum could open the door to rate cuts.
Consumer Sentiment Index (CSI)
The preliminary University of Michigan Consumer Sentiment Index for January edged higher, rising to 54.0 from 52.9 in December, slightly beating expectations. That marks the second straight monthly improvement and the highest reading since September. Even so, sentiment remains deeply subdued, sitting roughly 25% below where it stood a year ago.
Digging into the details shows a mixed picture. The Current Economic Conditions index, which reflects how consumers feel about their jobs, income, and day-to-day finances, rose to 52.4, up 4.0% from December. Even with that improvement, it remains 30.2% below its level a year ago, highlighting the ongoing pressure many households are still feeling. Meanwhile, the Expectations Index edged higher to 55.0, up 0.7% month over month, but still 20.9% lower than in January 2025. That suggests consumers are a bit more hopeful about the next six months, even if confidence is still well below last year’s levels.
Concerns about high prices and a cooling labour market remain front and centre, with inflation expectations little changed. In short, consumers feel slightly better than they did at the end of 2025, but confidence remains cautious rather than carefree – a tone that fits neatly with the broader economic backdrop.
American Market Volatility
The CBOE Volatility Index (VIX), often called the market’s “fear gauge,” had a relatively calm week. It opened at 14.47 and spent most of the time hovering around the 15 level, reflecting steady – if cautious – sentiment. Volatility ticked up slightly as the week progressed and investors prepared themselves ahead of Friday’s much anticipated US jobs report, the first official snapshot of how the American economy and labour market were shaping up for the new year. After a mixed but largely as expected jobs report, the VIX eased back to finish the week at 14.49.
Think of the VIX as the market’s pulse. A few weeks ago it was racing, signaling elevated nerves. This week, it settled into a steadier, healthier rhythm. Investors aren’t carefree, but they do appear more comfortable as inflation continues to cool and borrowing costs begin to edge lower.
Weekly Market and Portfolio Review
For the week, the TSX (SPTSX) jumped 2.3%, the S&P 500 (SPX) gained 1.6%, the DJIA (INDU) climbed 2.3% and the Nasdaq (CCMP) advanced 1.9%.
| Index | Weekly Streak |
| TSX: | 1 – week winning streak |
| S&P: | 1 – week winning streak |
| DJIA: | 1 – week winning streak |
| Nasdaq: | 1 – week winning streak |
![]() After a holiday‑shortened week that left all four major indexes in the red, the first full trading week of 2026 brought a much stronger rebound. The Toronto Stock Exchange Composite Index (TSX), the S&P 500 Index (S&P), the Dow Jones Industrial Average (DJIA) all finished the week at fresh record highs, while the Nasdaq Composite (Nasdaq) also ended higher, even if it didn’t quite notch a new high along the way. The TSX notched multiple record closes and its strongest week since November. The DJIA also had multiple high high closes during the week, including crossing the 49,000 milestone, and the S&P also reached record highs twice during the week — a clear sign that confidence has swung back after year‑end uncertainty.
After a holiday‑shortened week that left all four major indexes in the red, the first full trading week of 2026 brought a much stronger rebound. The Toronto Stock Exchange Composite Index (TSX), the S&P 500 Index (S&P), the Dow Jones Industrial Average (DJIA) all finished the week at fresh record highs, while the Nasdaq Composite (Nasdaq) also ended higher, even if it didn’t quite notch a new high along the way. The TSX notched multiple record closes and its strongest week since November. The DJIA also had multiple high high closes during the week, including crossing the 49,000 milestone, and the S&P also reached record highs twice during the week — a clear sign that confidence has swung back after year‑end uncertainty.
US markets opened the year with a mix of optimism and caution. The DJIA led the charge, helped by strong gains in energy, industrials, and other bigger blue‑chip sectors, as investors rotated into areas that had lagged in recent years. Early‑week geopolitical headlines, including actions in Venezuela that lifted oil prices and energy stocks, gave markets an initial boost. Meanwhile, the S&P and Nasdaq were more reserved, with broad gains in semiconductors and select technology stocks offset by profit‑taking and sector rotation as investors diversified into non‑technology names.
Sentiment shifted again midweek after President Trump signaled plans for a significant increase in US defence spending. Aerospace and defence names rallied, while some of the largest technology names saw relative weakness as money flowed into sectors expected to benefit from higher government budgets.
Labour market data played a big role later in the week. With the latest US jobs data returning after the government shutdown, the mixed results – slower hiring but a falling unemployment rate – helped markets balance optimism about growth with caution about inflation and interest rates.
In Canada, the TSX also had a strong week, though it experienced a mid‑week wobble in energy stocks. Canadian oil producers initially sold off amid concerns that increased Venezuelan oil exports could affect market share in the US. That pressure eased later in the week as oil prices stabilized, allowing energy stocks to recover much of those losses. Combined with solid showings from financials and materials, and a generally resilient labour report, this helped push the TSX solidly into the green by week’s end.
Hopefully, the strong start to 2026 is a sign of good things ahead, in line with the “January barometer,” which suggests the S&P’s performance in the first month can hint at its full-year direction. Over the past four years, January gains have often set the tone, with the index finishing higher for the year 79% of the time, according to Dow Jones Market Data. Let’s hope this first week is a sign of things to come for the markets. 😊
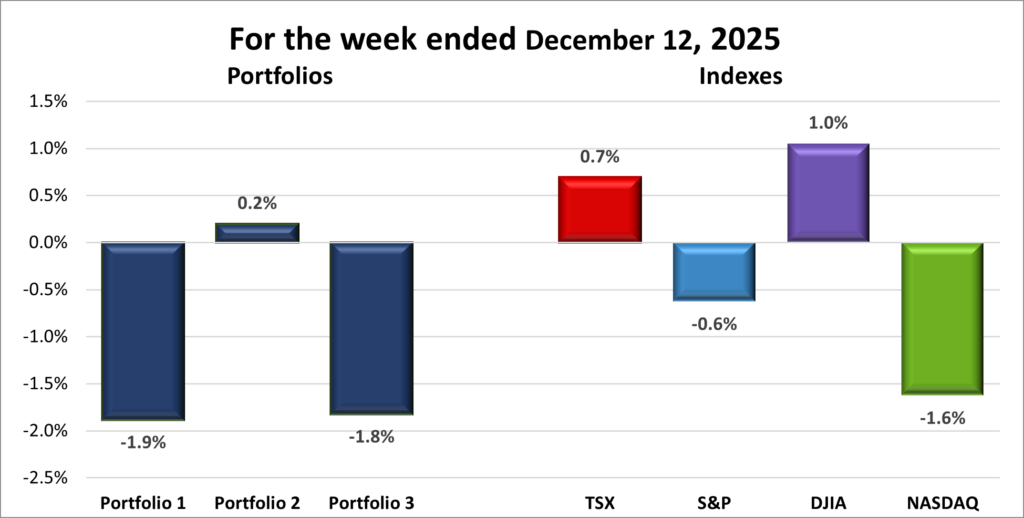
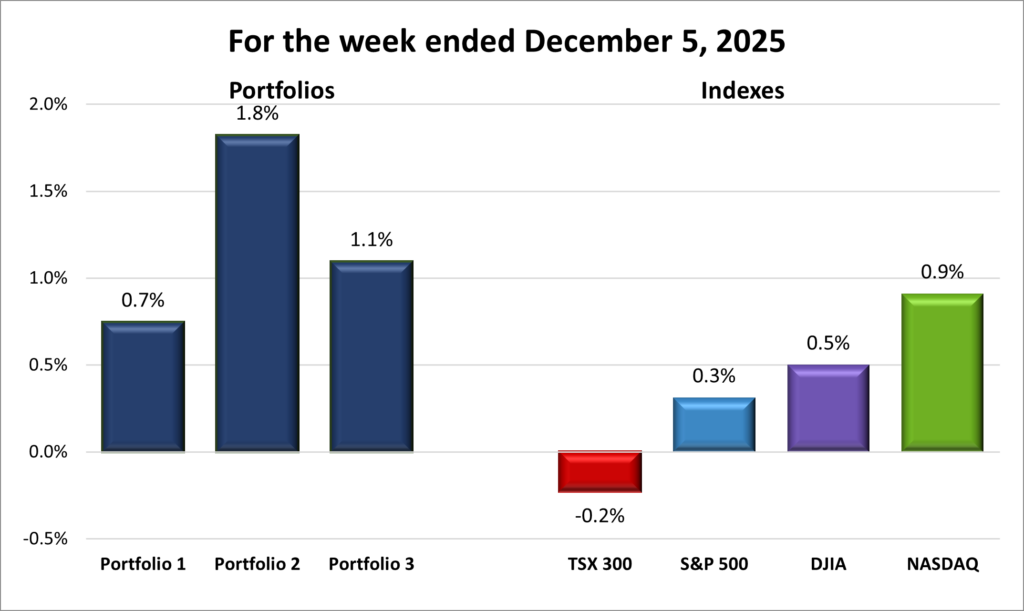
| Portfolio | Weekly Streak |
| Portfolio 1: | 1 – week winning streak |
| Portfolio 2: | 1 – week winning streak |
| Portfolio 3: | 1 – week winning streak |
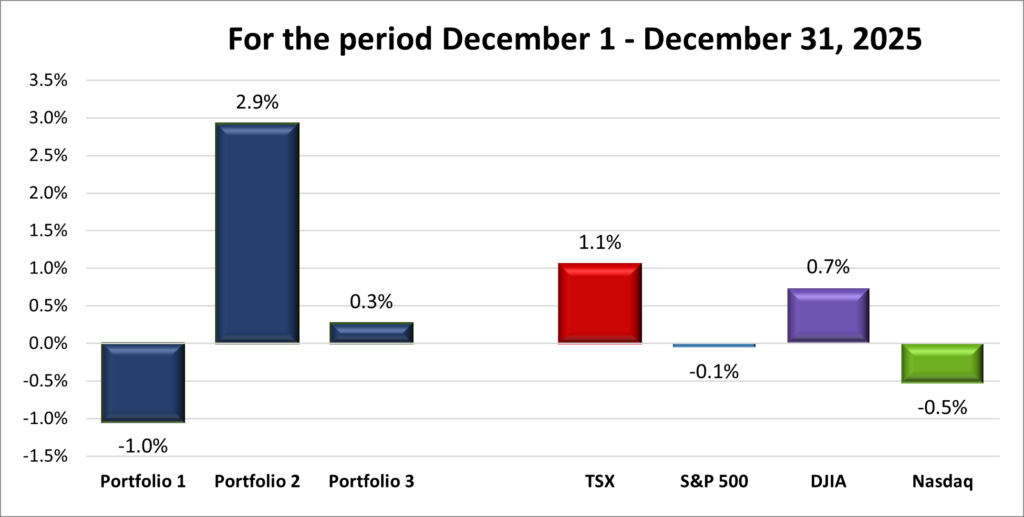
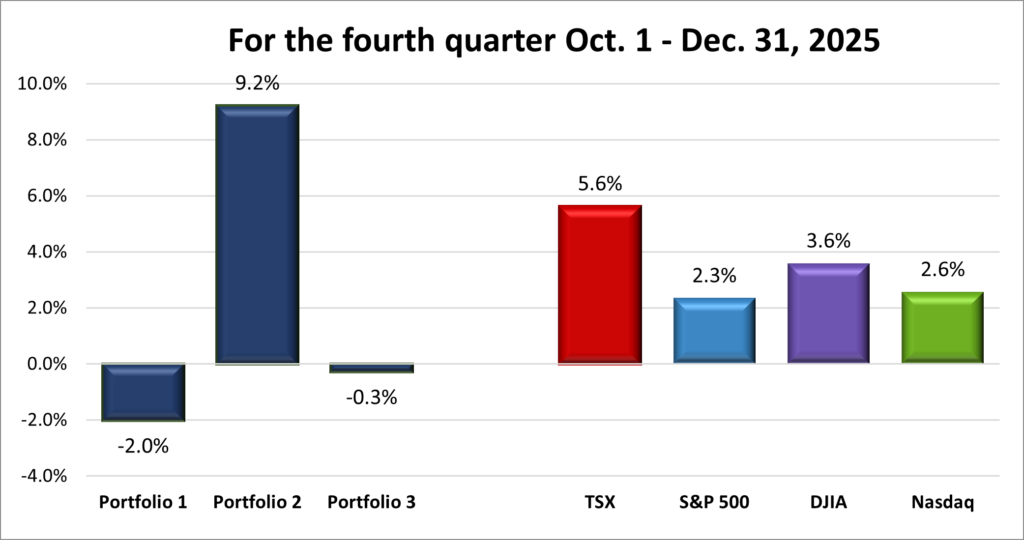
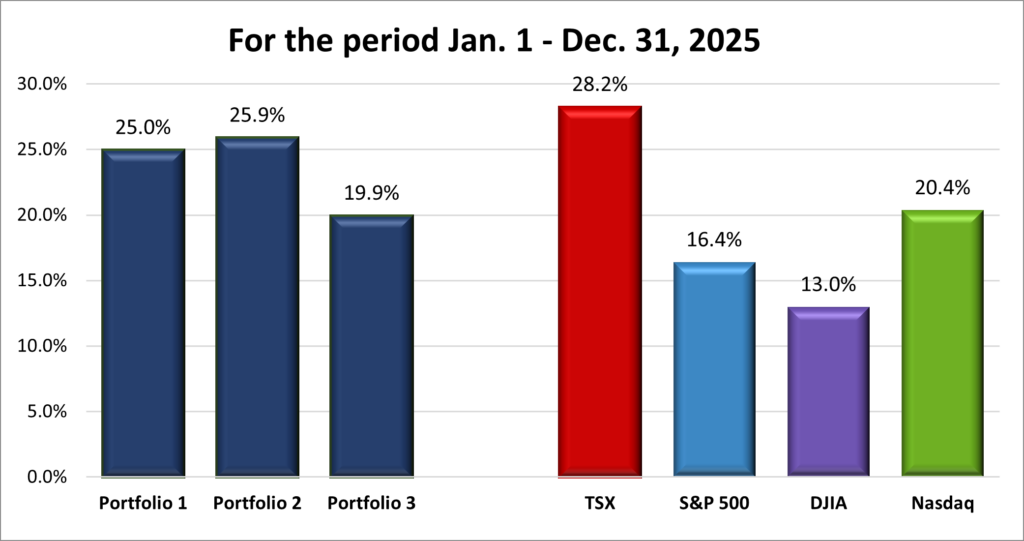
![]() The portfolios closed out 2025 on a soft note, with all three finishing the final (shortened) week of the year in the red. While prices bounced on the final trading day, that single session wasn’t enough to erase the weekly losses. I consider that holiday-shortened stretch as the final week of what was still a very strong 2025, which technically means all three portfolios began the new year with a one-week losing streak.
The portfolios closed out 2025 on a soft note, with all three finishing the final (shortened) week of the year in the red. While prices bounced on the final trading day, that single session wasn’t enough to erase the weekly losses. I consider that holiday-shortened stretch as the final week of what was still a very strong 2025, which technically means all three portfolios began the new year with a one-week losing streak.
That said, the first full week of trading in 2026 told a much more encouraging story. With investors fully back from the holidays, markets found their footing, and more importantly, all three portfolios moved higher to start the year on a positive note. 😊
The week began with some excitement around Nvidia (NASD: NVDA), which unveiled its next-generation AI GPU, the Vera Rubin, set to launch in the second half of the year. Despite the optimism from the announcement, Nvidia still finished the week down about 4%, which weighed on Portfolios 1 and 3.
Despite the downward pressure caused by the drop in Nvidia, the largest holding, Portfolio 1 led the way with a 2.2% gain, supported by 60% of its holdings finishing higher. Standout performers included Navitas Semiconductor (NASD: NVTS), up 18%, and Kraken Robotics (TSX: PNG), which jumped 13%. Adding to the positives, TD Bank (TSX: TD) and Cameco (TSX: CCO) both hit record highs during the week. On the downside, Arista Networks (NYSE: ANET) pulled back 10%. Investor enthusiasm around AI continued to dominate headlines, pushing Alphabet (NASD: GOOGL) past Apple to become the world’s second-largest company by market capitalization, behind Nvidia.
Portfolio 2 trailed the other two portfolios but still posted a 0.7% gain, with 57% of its holdings ending the week higher. The clear highlight was Aritzia (TSX: ATZ), which surged 10% and reached a new record high following a strong third-quarter earnings report.
As with Portfolio 1, Portfolio 3 overcame the weight of Nvidia’s drop to record a 1.4% gain, as 52% of its holdings moved higher. There were no major breakout performers, but steady, broad-based strength carried the portfolio higher, with TD Bank also setting a record high here.
Taken together, it was a solid and encouraging start to 2026, with all three portfolios moving higher as markets found their footing after the stumble the previous week. As with the indexes, I’m hoping this week is a harbinger of things to come this year, with the exception that Nvidia consistently posts weekly gains. 😊

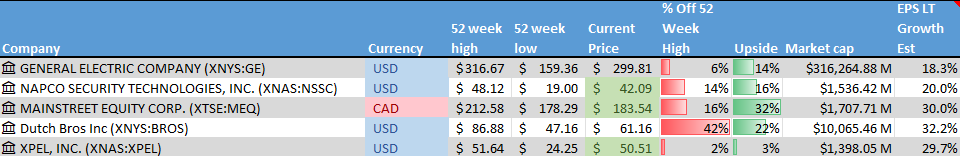
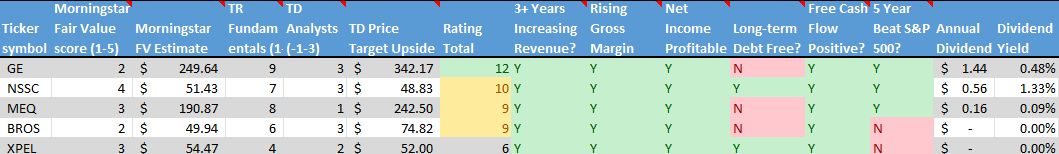
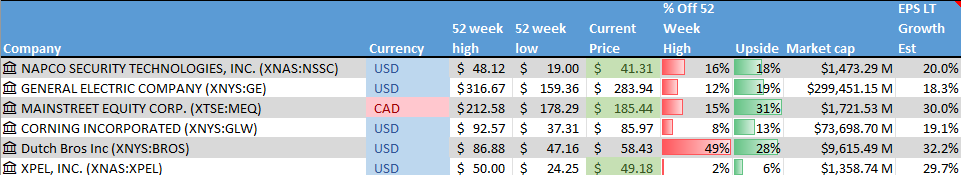
Companies on the Radar
 The start of a new year brings with it an updated radar list. Gone are Mainstreet Equity Corp. (TSE: MEQ), XPEL, Inc. (NASD: XPEL), and Rockpoint Gas Storage (TSE: RGSI). My preference is either an income-generating stock with a dividend above 3% or a high-growth company, and MEQ doesn’t really fit into either bucket. XPEL does not pay a dividend, and I feel there are better growth opportunities elsewhere.
Rockpoint Gas Storage, however, fit nicely into the income-generating category and offered added diversification and stability for the technology-heavy Portfolio 3 – which is why it moved from the radar list into the portfolio.
New to the radar are Build-A-Bear Workshop, Inc. (NYSE: BBW) and Xylem Inc. (NYSE: XYL). BBW is a specialty retailer built around an interactive, build-your-own stuffed animal experience, sold both in-store and online. XYL is a global water technology company that designs and manufactures equipment and solutions for water and wastewater applications, helping utilities, businesses, and communities move, treat, and test water efficiently.
While very different businesses, both BBW and XYL share traits that make them worth a closer look. Each operates in a niche where demand is relatively durable, and both have shown an ability to adapt their business models in changing environments. For now, they remain on the radar – names to watch more closely as opportunities develop.
Following these changes, my radar list now sits at six companies.
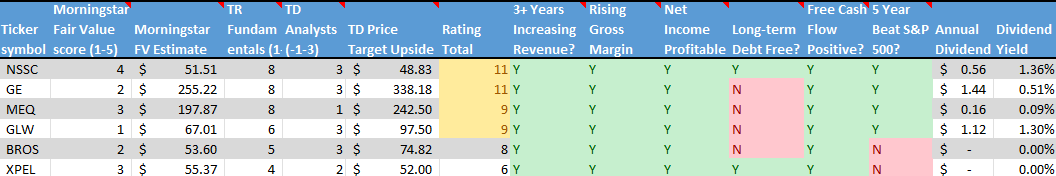
- GE Aerospace (NYSE: GE): This is the large American aviation and defence business that remained after General Electric split into three separate companies in 2024. It has been on a strong run thanks to high demand for commercial jet engines as global air travel continues to recover. The company focuses on aircraft propulsion systems and services for both commercial and military customers, and it’s also moving into drones. As a global leader in jet engines and aircraft systems, GE Aerospace offers exposure to long-term trends in travel, defence spending, and emerging aviation technology.
- Dutch Bros Inc. (NYSE: BROS): A rapidly expanding drive-thru coffee chain in the US, known for its energetic customer service and customizable drinks. The company is aiming to open at least 160 new locations by the end of 2025 and has long-term goals of surpassing 2,000 stores. Strong brand loyalty, especially in the Western US, makes this an interesting high-growth story – though still in an aggressive build-out phase.
- Napco Security Technologies, Inc. (NASD: NSSC): A small US company that provides security hardware and systems like smart locks, intrusion alarms, fire alarms, and access control solutions. It sells through a network of distributors and installers, and has been increasing its recurring service revenue – something investors usually like to see. As demand for security and smart home products grows, Napco has multiple avenues for expansion.
- Rocket Lab (NASD: RKLB): They are an aerospace company helping make space more accessible. It launches rockets that carry small satellites into orbit – the kind used for communications, Earth observation, and research – and also builds the space hardware that makes those missions possible. Over time, Rocket Lab has grown beyond just launching rockets, evolving into a more complete space company that designs spacecraft, manages missions, and supports customers from launch all the way through operations in space.
As always, these are not buy recommendations. Make sure to do your own research and choose investments that fit your personal financial goals.
The Radar Check was last updated January 9, 2026.


Portfolio Update
Portfolio 3
Bought: Rockpoint Storage Systems Inc. In what turned out to be the final investing move of 2025, I added Rockpoint to Portfolio 3 to diversify the holdings and bring in a business tied more to physical infrastructure than the more volatile technology companies that dominate this portfolio. Rockpoint is a smaller, under-the-radar Canadian company that owns and operates natural gas storage facilities across Canada and the US. In simple terms, it helps balance supply and demand in the natural gas market – storing gas when it’s abundant and releasing it when demand rises. This type of business isn’t about flashy growth; it’s about steady, contracted cash flow, which adds a different flavour to an otherwise technology-heavy portfolio.
Beyond diversification, there are a few reasons why a company like Rockpoint stands out. Gas storage businesses tend to generate predictable, recurring revenue through long-term contracts, making results less dependent on daily swings in natural gas prices and helping smooth performance when markets get choppy. The service itself is essential – natural gas is still a key energy source in both Canada and the US, especially during colder months, and storage plays a critical role in keeping supply and demand balanced. Unlike producers, Rockpoint isn’t constantly drilling or chasing new reserves, which keeps ongoing capital needs lower and allows more cash to stay within the business. That steady cash flow also supports a healthy dividend – around 4.3% at time of purchase – adding an income component alongside the potential for long-term growth.
Another factor that adds some comfort is Brookfield’s involvement. Brookfield Asset Management (TSE: BAM) remains the controlling owner of the underlying gas storage assets, retaining roughly a 60% interest after the company went public, while investors own the remainder. Having a global infrastructure investor like BAM, with deep experience in long-life, cash-flow-generating assets as the majority owner adds credibility and a sense of alignment, even though it also means minority shareholders don’t have full control.
That said, Rockpoint is still a small-cap company, so it comes with higher risk, less liquidity, and fewer eyes on it compared to large, well-known stocks. For Portfolio 3, this addition is about balance and stability – owning a straightforward, easy-to-understand business that behaves differently than the technology-heavy holdings, while also generating some ongoing income rather than chasing quick gains.
That’s a wrap for this week, thanks for reading – may your portfolio stay green and your dividends steady. See you next time!