
The week ending February 25, 2022

Certainly uncertain

I had planned on opening this week’s post on the market’s ongoing slide and its impact on the three Portfolios but an event on the other side of the world gave the global markets a scare. That event was the Russian invasion of Ukraine. Let’s look at how the uncertainty and then certainty of the invasion impacted the stock market.

Russia is the world’s second-largest natural gas producer, the third-largest oil producer, and supplies Europe with 40% of its gas imports. Disruption of the Russian oil supply would severely impact Europe. However, the rest of the world would feel the loss of Russian energy products despite other oil producing nations attempt to fill the void left by Russia. Consequently, the markets, especially the price of oil, had been bouncing up and down like a yo-yo every time there was news out of tensions along the Ukraine – Russian border. The markets did not know if there would be a war or not.

Stock markets in general don’t like uncertainty and they definitely don’t like surprises. Well, the uncertainty of a Russian invasion has been removed. When Russia invaded Ukraine Thursday morning, oil prices shot up to over USD $100 a barrel and when the various North American stock exchanges opened, other stocks immediately plunged as investors fled stocks for assets traditionally deemed safer, such as bonds and gold.

The invasion itself wasn’t a surprise as Russia had amassed over 150,000 troops and the US had been stating an invasion was imminent for a few weeks. However, I think a lot of people, myself included, didn’t really think Russia would invade Ukraine. I thought this was a lot of posturing and some sort of agreement would be reached that each party could accept. Wrong! The invasion was a surprise to many.

Prior to the invasion, it was unknown what the West’s response would be to Russian aggression (uncertainty, which the markets don’t like). I thought they would freeze various Russian assets. In retaliation, Russia would cut off the oil flow to Europe, and any disruption to global oil supply would put stress on energy prices. Inevitably, this would lead to higher oil prices which in turn would lead inflation.

However, once the uncertainty of what the sanctions against Russia would be was removed, the markets reversed course. The sanctions had stopped short of disrupting Russian energy exports, and Russia had not been locked out of the international banking system. Since the sanctions were announced, all four major North American indexes have climbed higher, while the price of oil has fallen back to below USD $100 a barrel.

From a purely investment point of view, shares in oil and natural gas companies should rise as the war continues (good for owners of oil related companies). However, higher oil prices will lead to higher costs for gas, heating and other oil related products. This in turn will push inflation higher and likely cause the Bank of Canada and the US Federal Reserve to raise interest rates more aggressively. Until these rate hikes are known, uncertainty will gain cause the markets to go up and down, depending on investor sentiment.

War is a terrible thing. Even a war on the other side of the world from North America has already been felt here in North America. As for the stock market, the roller coaster of the last week is the sort of thing that happens amid uncertainty. Once the uncertainty is removed, the market will react accordingly as we saw this past week.

Now, let see how that roller coaster played out for the Indexes this past week ….

Weekly Market Review

Monday: The major North American Exchanges were closed for Family Day in Canada and President’s Day in the USA. Consequently, there was no movement on the four major Indexes: the Toronto Stock Exchange Composite Index (TSX), the S&P 500 Index (S&P), the Dow Jones Industrial Average (DJIA), and the Nasdaq Composite Index (Nasdaq). However, with Russia launching ‘peacekeeping’ missions into eastern Ukraine, the price of oil should jump while the rest of the market tumbles. This could be a rough week, again.

Tuesday: Depending on which side of the argument you’re on, Russian forces moving into Ukraine is either an invasion (US & NATO version) or peacekeeping missions (Russia). Either way, all four Indexes fell today. A war in Ukraine not only would disrupt energy supplies, which in turn lead to increases in inflation (higher prices for cars, for example).

The TSX extended its losing streak to 4 days despite slight gains in the Energy sector caused by oil reaching a 7 year high. The three American Indexes were down but it could have been worse. The S&P fell into correction territory after the US stated Russia’s peacekeeping efforts were the “beginning of an invasion.” The S&P has lost more than 10% since its record high close on January 3.

Wednesday: Another rough day for the Indexes after Ukraine declared a state of emergency. Once again, the TSX declined the least, falling almost .8% while the S&P lost 1.8%, the DJIA was down 1.4%, and the Nasdaq ended down 2.6%.

The DJIA barely avoided joining the S&P in a correction. The Nasdaq can only wish it were down only 10%. It is down nearly 19% from its record high on November 19, 2021. Meanwhile the TSX is down 2.3%, despite Shopify (TSX:SHOP), Canada’s third largest company, falling almost 55% since the start of the year. The TSX’s over weighting in Canadian financial companies and resource companies is what is keeping it from joining its American counterparts down near the -10% or greater decline.

Thursday: All four Indexes plunged this morning on the Russian invasion of Ukraine. However, all the Indexes abruptly changed directions and ended the day in the black. In Canada, the TSX was led upward by a 4% gain in the Technology sector. The Energy sector was also up, with oil breaking the USD $100 a barrel threshold.

The US Indexes were led by the technology heavy Nasdaq which posted a 3.3% gain for the day. The rise in technology companies also helped the S&P reverse its early plunge. To illustrate how volatile the market can be, the Nasdaq opened the day with a 3% plunge before rallying to close over 3% in the black. In the morning, the Nasdaq briefly down more than 20% from its November high. If it had not rallied and stayed at the morning lows, it would have been considered in a bear market.

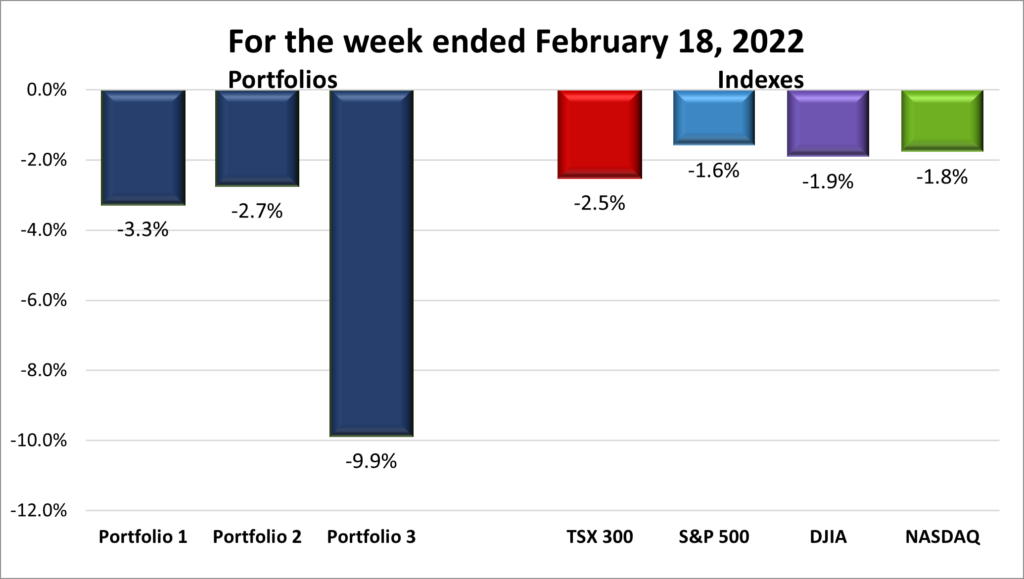
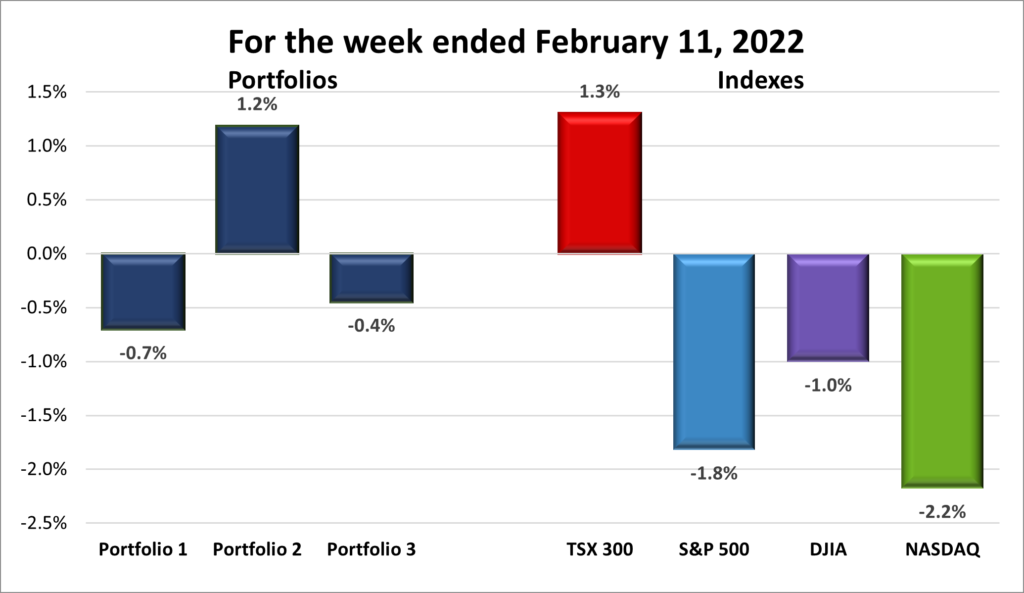
Friday: It was a good day in the market. All four Indexes were in the black for the day and the DJIA had its largest daily percentage gain since November 2020. In the US, it was abroad based rally with all sectors finishing the day higher. In Canada, the TSX was led upward by the Energy and Financial sectors. For the week, the TSX, the S&P and the Nasdaq ended in positive territory while the DJIA posted a slight decline for the week.

Oil prices dropped below USD $100 per barrel after investors realized Western sanctions were aimed at Russia’s banks and financial sector, rather than Russia’s energy sector. For now, the supply of oil to Europe is still flowing.

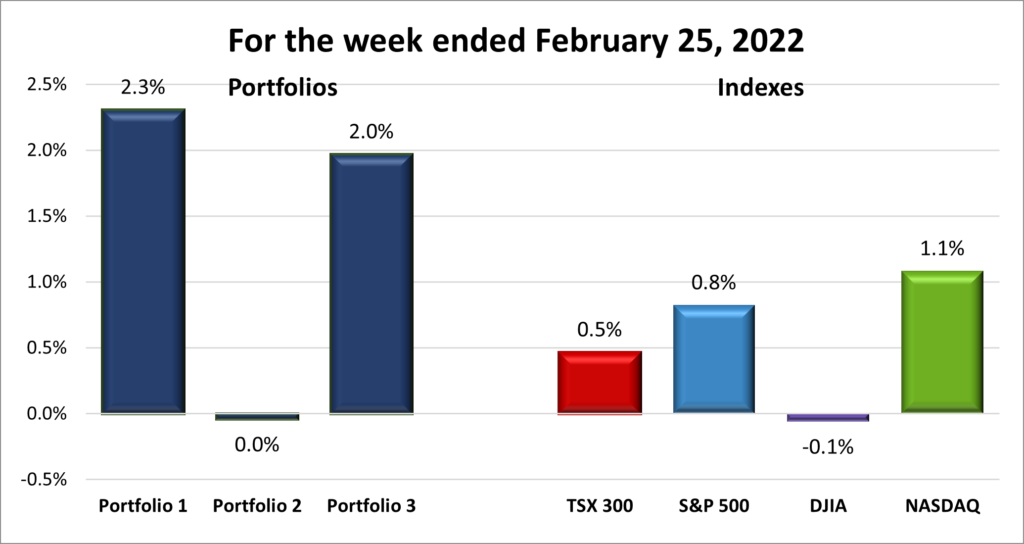
For the week, the TSX, S&P and Nasdaq all had a winning week while the DJIA was down by .1%.

Weekly Portfolio Review

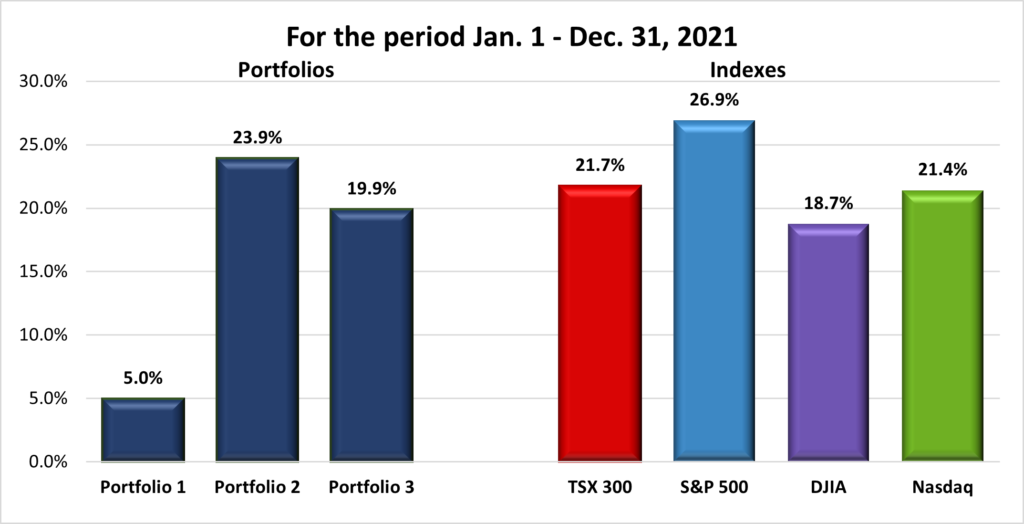
Russia invading Ukraine aside, it was a good week overall with three of the four Indexes rising and two of three Portfolios gaining. The Nasdaq was the best performing Index, gaining 1.1% for the week, while the DJIA was the only Index to end the week in the red. For the Portfolios, Portfolio 1 and Portfolio 3 each gained more than 2%, almost doubling the weekly gain of the Nasdaq Index. While Portfolio 2 was unable to post a gain this past week, neither did it post a loss, finishing the week flat. I cannot remember two Portfolios gaining twice as much as the best performing Index in one week. I’d like to see that more often. Actually, I’d like to see all three Portfolios double the best performing Index.😊

Weekly Portfolio & Index performance
Weekly Portfolio & Index performance for the week ended Feb. 25, 2022.

Companies on the Radar

This week I moved Pulse Seismic from the radar to Portfolio 1 (see the write up in Portfolio 1’s Activity section below) and dropped FuboTV (NYSE:FUBO) after their earnings report came out. The report was OK but what I was looking for was for Fubo to have added more of the major North American sports to their package. If I was a big soccer, perhaps, but I’m not. Until they can sign some deals with the major North American sports leagues, I’m content with the shares already in Portfolio 1.

As has been the case for the last few weeks, the following companies are currently on the radar and an old friend returns:

Portfolio Update

Portfolio 1

Portfolio 1 for the week ended February 28, 2025: UP Green Up Arrow, signifying a positive week

Home Depot fell the most in nearly two years after a decline in gross profit margins for the holiday quarter. Costs were up as the company chartered a cargo ship and used air freight to in attempt to beat supply chain disruptions and get popular products and materials to stores faster. While these measures helped sales, those extra transportation expenses, along with higher labour costs, led decline in fourth-quarter gross margins.

Teladoc Health (NYSE:TDOC) continues to grow its virtual healthcare business. Revenues are up and the net loss improved by 13% (its less than the 2020 loss). Virtual healthcare is here to stay and Teledoc should be fine in the upcoming years.

Kneat.com (TSX:KSI) had record fourth quarter revenues leading to strong 2021 results. As impressive as growth in revenues of 109% sounds, more impressive is their ability to ‘land and expand’ with a net revenue retention rate of 245%. As well as contracting with many of the top global biopharmaceutical companies, Kneat recently signed a deal with a consumer-packaged goods company and are looking to expand into the supply chain, and consumer packaged goods industry. Breaking out of the life sciences industry is a good sign and can only grow the customer base. I look forward to seeing if they can continue their ‘land and expand’ strategy in these new industries.

Cloudflare (NYSE:NET) announced it has agreed to buy email protection provider Area 1 Security for $162 million.

Activity

Bought Pulse Seismic Inc. (TSX:PSD) Following up on last week’s Companies on the Radar, I took a closer look at Pulse Seismic and found they had:

  • a long tenured executive team;
  • a consistently high return on capital (indicating the company is efficiently using shareholders’ equity to generate a profit);
  • a significant moat/competitive advantage (their library of seismic data),
  • generate lots of cash which is used to repay debts (long term debt was recently fully repaid making them long term debt free), dividends to shareholders, and repurchase outstanding shares.

As long as the demand for oil and gas remains high, as it’s expected to for another 10 years or so, energy companies will continue to look for opportunities throughout Canada. Pulse Seismic will benefit as they license out their seismic data which is vital to exploration and development of oil and gas resources.

Dividends

Dividends Received this week for the following companies:

Companies followed by DRIP (Dividend Re-Investment Plan) indicate additional shares were purchased with the dividend. Any cash leftover was added to the cash balance.

Canadian $

Shaw Communications Inc (TSX:SJR.B)

US $

No US$ dividends this past week.

Quarterly Reports

Teladoc Health Inc.

All currency listed in US dollars

Selected highlights from their fourth quarter 2021 financial results on February 22, 2022

Fourth quarter highlights

  • Fourth quarter revenue grows 45% year-over-year to $554.2 million
  • Gross margin was 67.5 percent for the fourth quarter of 2021 compared to 67.2 percent for the fourth quarter of 2020
  • Net loss was $10,985 compared to a loss of $393,967 in the same period the previous year
  • Total visits increase 41% to 4.4 million

Fiscal 2021 highlights

  • Revenue grows 86% year-over-year to $2,032.7 million
  • Gross margin was 67.2% compared to 63.1% in 2020
  • Net loss was $428,793 compared to a loss of $485,136 in the same period the previous year
  • Full year cash flows from operations grew to $194.0 million
  • Total visits increase 38% to 15.4 million

Home Depot

Fourth quarter highlights

  • Sales were $35.7 billion, an increase of 10.7% from the fourth quarter of fiscal 2020
  • Net earnings were $3.4 billion, or $3.21 per diluted share, compared with net earnings of $2.9 billion, or $2.65 per diluted share, in the same period of fiscal 2020

Fiscal 2021 highlights

  • Sales were $151.2 billion, an increase of $19.0 billion, or 14.4 percent, from fiscal 2020.
  • Net earnings were $16.4 billion, or $15.53 per diluted share, compared with net earnings of $12.9 billion, or $11.94 per diluted share in 2020.
  • Approved a 15 percent increase in its quarterly dividend to $1.90 per share, which equates to an annual dividend of $7.60 per share

Magnite Inc.

All currency listed in US dollars

Selected highlights from their fourth quarter 2021 financial results on February 2, 2022

Fourth quarter highlights

  • Revenue was $161.3 million for Q4 2021, up 97% from Q4 2020
  • Net income for Q4 2021 was $0.5 million, representing diluted earnings per share of $0.00, compared to net income of $5.9 million, or diluted earnings per share of $0.05 for the fourth quarter of 2020

Fiscal 2021 highlights

  • Revenue was $468.4 million for 2021, up 111% from 2020
  • Net income for 2021 was $0.1 million, compared to net loss of $53.4 million for 2020

Innovative Industrial Properties, Inc.

All currency listed in US dollars

Selected highlights from their fourth quarter 2021 financial results on February 23, 2022

Fourth quarter highlights

  • Generated total revenues of approximately $58.9 million in the quarter, representing a 59% increase from the prior year’s quarter.
  • Recorded net income attributable to common stockholders of approximately $28.3 million for the quarter, or $1.14 per diluted share, and AFFO of approximately $48.6 million, or $1.85 per diluted share (including the dilutive impact of the assumed full exchange of the Exchangeable Senior Notes).
  • Paid a quarterly dividend of $1.50 per common share on January 14, 2022, representing a 21% increase from the prior year’s fourth quarter

Fiscal 2021 highlights

  • Generated total revenues of approximately $204.6 million, representing an increase of 75% over 2020.
  • Recorded $4.55 of net income attributable to common stockholders per diluted share.
  • Declared dividends to common stockholders totaling $5.72 per share, a 28% increase over 2020.
  • Approximately $406.0 million in cash and cash equivalents and short-term investments.
  • 15% debt to total gross assets, with approximately $2.2 billion in total gross assets, representing a total annual fixed cash interest obligation of approximately $17.8 million, with no debt maturing in 2022 or 2023.

Kneat.com

All currency listed in CAD dollars

Selected highlights from their fourth quarter 2021 financial results on February 23, 2022

Fourth quarter highlights

  • Revenues increased 111% to $6.3 million, compared with $3.0 million for the fourth quarter of 2020.
  • Gross margin increased 177% to $4.4 million, compared with $1.6 million for the fourth quarter of 2020.
  • Gross margin percentage increased to 71% compared with 54% for the fourth quarter of 2020. The increase in gross profit margin was driven by a significant increase in revenue, including some one-time on-premises license revenues, offset by a smaller increase in related cost of revenue.

Fiscal 2021 highlights

  • Total revenues increased 109% to $15.5 million, compared with $7.4 million for the year ended December 31, 2020.
  • Gross margin increased 224% to $9.3 million compared with $2.9 million for the year ended December 31, 2020.
  • Gross margin percentage increased to 60% compared with 39% in the year ended December 31, 2020. The higher gross profit margin was driven by increases in revenue, in particular SaaS license revenues and some one-time on-premises revenue, offset by a smaller increase in related cost of revenue.
  • Gross Revenue Retention Rate was 100% for the year ended December 31, 2021.
  • Net Revenue Retention Rate was 245% for the year ended December 31, 2021.

FuboTV Inc.

All currency listed in US dollars

Selected highlights from their fourth quarter 2021 financial results on February 23, 2022

(in millions)

Fourth quarter highlights

  • Total revenues of $231.06 million
  • Revenues increased to $25.9, compared to $13.1 for the same period in 2020, an increase of 98%.
  • Net loss decreased to $112 from $195.3 for the same period in 2020
  • Customers streamed 404 million hours of content during the quarter, a 96% increase over the same period in 2020.

Fiscal 2021 highlights

  • Total revenue of $638 million, an increase of nearly 144%.
  • Net loss decreased to $383 million from $609.7 million in 2020
  • 1,315,433 global subscribers (including 185,626 attributable to the acquisition of Molotov); on an organic basis FuboTV grew by 581,927 net adds or 106% YoY to 1,130,000
  • Surpassed one million total paid subscribers in the U.S. and 114% growth since the IPO in October 2020

Portfolio 2

Portfolio 2 for the week ended February 25, 2022: FLAT Blue tilde, signifying break even.

Zynga (NASD:ZNGA) completed the ‘go-shop’ phase of its tentative deal to be acquired by Take Two Interactive (NASD:TTWO) and now enters the ‘no-shop’ phase. The ‘go-shop’ phase allowed Zynga to look for better offers than the one put forward by Take Two. The ‘no shop’ phase is just as the phrase implies, Zynga limits its ability to seek alternative options, subject to standard fiduciary obligations. At this time, the deal for Take Two to acquire Zynga is still moving forward and expected to close near the end of June.

Guardant Health (NASD:GH) had a solid fourth quarter and fiscal year, beating analysts’ expectations. Management expects 2022 an increase in revenues of 23% to 26% over fiscal 2021 revenues.

For the rest of the Portfolio there were no surprises one way or the other. A few of the technology stocks were down but the non-technology stocks were able to carry the portfolio this week.

Activity

No significant activity to report this week.

Dividends

Dividends Received this week for the following companies:

Companies followed by DRIP (Dividend Re-Investment Plan) indicate additional shares were purchased with the dividend. Any cash leftover was added to the cash balance.

Canadian $

Dream Industrial Real Estate Investment Trust (TSX:DIR.UN) DRIP

US $

No US$ dividends this past week.

Quarterly Reports

Guardant Health

All currency listed in US dollars

Selected highlights from their fourth quarter 2022 financial results on February 23, 2022

Fourth quarter highlights

  • Revenue of $108 million, an increase of 38% over the corresponding period of 2020.
  • Gross margin was 69%, as compared to 64% for the corresponding prior year period
  • Net loss attributable to common stockholders was $90.9 million, as compared to $93.7 million for the corresponding prior year period.
  • Net loss per share attributable to common stockholders was $0.89, as compared to $0.94 for the corresponding prior year period.

2021 highlights

  • Revenue of $ $374 million for the full year 2021, an increase of 30% over 2020.
  • Gross margin was 67%, as compared to 68% for the corresponding prior year period.
  • Net loss attributable to common stockholders was $405.7 million for 2021, as compared to $253.8 million for the corresponding prior year period.
  • Net loss per share attributable to common stockholders was $4.00 for 2021, as compared to $2.60 for the corresponding prior year period.

Kneat.com

All currency listed in CAD dollars

Selected highlights from their fourth quarter 2021 financial results on February 23, 2022

Fourth quarter highlights

  • Revenues increased 111% to $6.3 million, compared with $3.0 million for the fourth quarter of 2020.
  • Gross margin increased 177% to $4.4 million, compared with $1.6 million for the fourth quarter of 2020.
  • Gross margin percentage increased to 71% compared with 54% for the fourth quarter of 2020. The increase in gross profit margin was driven by a significant increase in revenue, including some one-time on-premises license revenues, offset by a smaller increase in related cost of revenue.

Fiscal 2021 highlights

  • Total revenues increased 109% to $15.5 million, compared with $7.4 million for the year ended December 31, 2020.
  • Gross margin increased 224% to $9.3 million compared with $2.9 million for the year ended December 31, 2020.
  • Gross margin percentage increased to 60% compared with 39% in the year ended December 31, 2020. The higher gross profit margin was driven by increases in revenue, in particular SaaS license revenues and some one-time on-premises revenue, offset by a smaller increase in related cost of revenue.
  • Gross Revenue Retention Rate was 100% for the year ended December 31, 2021.
  • Net Revenue Retention Rate was 245% for the year ended December 31, 2021.

Portfolio 3

Portfolio 3 for the week ended February 25, 2022: UP Green Up Arrow, signifying a positive week

Adyen (OTCM:ADYEY) reports on the Amsterdam Exchange and is only required to report earnings twice a year, compared to North American requirements of quarterly reports. While Adyen reported back on February 9, I only found out about it this week. I think because it’s a European company and its primary Exchange is in Europe it does not get as much attention as North American based companies. That being said, Adyen is a top company in the online payment processing industry, competing with more well-known PayPal and others. Adyen provides a single platform to accept payments across online, mobile or in-store (POS) methods with over 250 payment methods and 187 currencies. They also can help protect revenue streams from fraud and help control a company’s finances. You may not have heard of Adyen, but their list of customers includes eBay, Tiffany & Co., Microsoft, Etsy, KLM airlines, McDonalds and other leading brands.

To purchase shares in Adyen in North America, one must purchase shares on the Over-The-Counter market (OTCM). There are two types of shares of Adyen available on the OTCM: ADYYF and ADYEY (USD $2,012.08 and $20.60, respectively as of market close on February 25). Portfolio 3 owns the ADYEY shares. These are depository receipts (DR), which are negotiable instruments (shares) that allow investors like me to invest in foreign companies, such as Adyen.

Adyen had a great second half earnings report with net revenues up 47% for the half and 46% for fiscal 2021. It takes a bit of hunting around for information on the company but if you go directly to the Adyen website you can find out more about the company and access its financial reports. If you think online and mobile payment processing is only going to increase, you might want to consider this lesser-known European company.

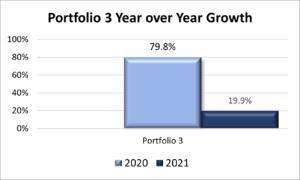
As for the rest of the portfolio, I thought the financial stocks would carry the portfolio this past week, but it turned out a combination of technology and the bank stocks had the biggest impact in getting Portfolio 3 back into the black after previous weeks 9% drop.

Activity

Bought: Brookfield Select Opportunities Fund (TSX:BSO.UN). A little bit of cash was sitting around in an account doing nothing. There wasn’t enough to really invest in a low-risk company, so I decided to take the opportunity to diversify the portfolio with an income fund. I’m familiar with the stock as I’ve bought it for both Portfolios 1 and 2. As with those purchases, I’m confident in the Brookfield management team, it provides diversification and stability to the portfolio, and a 10% dividend provides a solid and reliable stream of income (much better than the 0% it had been doing).

Dividends

Dividends Received this week for the following companies:

Companies followed by DRIP (Dividend Re-Investment Plan) indicate additional shares were purchased with the dividend. Any cash leftover was added to the cash balance.

No dividends this past week.

Quarterly Reports

Adyen N.V.

All currency listed in EUR dollars.

Selected highlights from their second half 2021 financial results on February 9, 2022

Second half highlights

  • Net revenues of €556.5 million, up 47% year-on-year
  • EBITDA of €357.3 million, up 51% year-on-year. EBITDA margin was 64%
  • Net income was €264.9 million for the second half of the year, up 62% year-on-year
  • Processed volume was €300.0 billion, up 72% year-on-year
  • More than 80% of our growth came from existing merchants, volume churn was minimal at <1%, and net revenue concentration during the period decreased

2021 highlights

  • Net revenues for the year were over €1.0 billion, up 46% year-on-year
  • EBITDA of €630 million: up 57% year-on-year. EBITDA margin was 63% for the full year.
  • Processed volume was €516 billion: up 70% year-on-year

Kneat.com

All currency listed in CAD dollars

Selected highlights from their fourth quarter 2021 financial results on February 23, 2022

Fourth quarter highlights

  • Revenues increased 111% to $6.3 million, compared with $3.0 million for the fourth quarter of 2020.
  • Gross margin increased 177% to $4.4 million, compared with $1.6 million for the fourth quarter of 2020.
  • Gross margin percentage increased to 71% compared with 54% for the fourth quarter of 2020. The increase in gross profit margin was driven by a significant increase in revenue, including some one-time on-premises license revenues, offset by a smaller increase in related cost of revenue.

Fiscal 2021 highlights

  • Total revenues increased 109% to $15.5 million, compared with $7.4 million for the year ended December 31, 2020.
  • Gross margin increased 224% to $9.3 million compared with $2.9 million for the year ended December 31, 2020.
  • Gross margin percentage increased to 60% compared with 39% in the year ended December 31, 2020. The higher gross profit margin was driven by increases in revenue, in particular SaaS license revenues and some one-time on-premises revenue, offset by a smaller increase in related cost of revenue.
  • Gross Revenue Retention Rate was 100% for the year ended December 31, 2021.
  • Net Revenue Retention Rate was 245% for the year ended December 31, 2021.

Magnite Inc.

All currency listed in US dollars

Selected highlights from their fourth quarter 2021 financial results on February 2, 2022

Fourth quarter highlights

  • Revenue was $161.3 million for Q4 2021, up 97% from Q4 2020
  • Net income for Q4 2021 was $0.5 million, representing diluted earnings per share of $0.00, compared to net income of $5.9 million, or diluted earnings per share of $0.05 for the fourth quarter of 2020

Fiscal 2021 highlights

  • Revenue was $468.4 million for 2021, up 111% from 2020
  • Net income for 2021 was $0.1 million, compared to net loss of $53.4 million for 2020

Royal Bank of Canada

All currency listed in CAD dollars

Selected highlights from their first quarter 2022 financial results on February 24, 2022

  • net income of $4.1 billion for the quarter, up $248 million or 6% from the prior year.
  • Diluted Earnings Per Share of $2.84, up 7% compared to first quarter 2020.
  • Return on Equity of 17.3%, down 1.3% compared to first quarter 2020.


2020 & 2021 In Review

Indexes

While most of the world had a tough year, it was quite a good year for each of the major North American markets. The Toronto Stock Exchange (TSX) had its best year since 2009, gaining 22%. Helping fuel the rise of Canada’s leading stock exchange were government programs to keep the economy going, covid-19 vaccine rollouts which led to economic recovery through most parts of the world.

South of the 49th, the three American Indexes all had a strong year to make the total gains from 2019 through 2021 the biggest three-year gain since 1999. Not bad considering the last 2 years were amid a pandemic. For the year, the S&P 500 Index (S&P) gained 27%, the Dow Jones Industrial Average (DJIA)was up 18.73% and the Nasdaq Composite Index (Nasdaq) added 21.4%. Leading the way were the energy, real estate, and technology sectors.

In 2021, Covid-19 was still a going concern; everyone grew familiar with the term ‘supply chain issues’; and towards the end of 2021, inflation reared its head leading to fears of higher interest rates. Going into 2022, covid-19 and its variants still linger and will continue to cast a shadow over the markets. As well, the question is no longer will interest rates will be going up, rather, how much will interest rates rise. The new uncertainty impacting the markets is tensions between NATO countries and Russia as Russia masses its military along the Russia – Ukraine border. And who knows what else will happen in 2022.

Portfolio Review

Rather than trying to beat a specific Index, my goal is to get at least a 10% gain each year, preferably 20% or more. As Meatloaf would sing, ‘2 out of 3 ain’t bad’. Portfolio 1 did not have a good 2021, not even keeping up with inflation. On the other hand, Portfolio 2 beat all the Indexes except the S&P 500 Index and Portfolio 3 just missed hitting the 20% goal.

2021 Portfolio & Index Growth
Portfolio & Index Growth for 2021

When I look at how the Indexes performed over 2020 and 2021, all three Portfolios performed well. As a result of the pandemic, technological changes that had been slowly occurring were accelerated as people had to work from home and came to rely on technology more and more. Several technology companies were able to benefit from this accelerated digital transformation. Companies that had previously flown under the radar suddenly saw their revenues grow tremendously. Companies like DocuSign (NASD:DOCU) and their electronic signature and document management system; Teladoc Health (NYSE:TDOC) in the US and Well Health Technologies (TSX:WELL) in Canada with their virtual medical appointments; and of course, Amazon with their online sales.

Looking at the chart below, each Portfolio saw stellar growth in 2020, with Portfolio 3 having a fantastic year. While I’d like to think it was my investing skills that were responsible for the performance of all three portfolios, I know it was more a case of luck than anything. A once in a generation, black swan event (the pandemic), with cash available to invest, and identifying trends that would continue after the pandemic.

On its own, 2021 was not a bad year with returns ranging from 5% to 23.9% and an overall average of 15.9%. I’ll discuss each Portfolio individually below.

2020 to 2021 Year over Year Growth
Year over year growth for the 3 Portfolios

Portfolio 1

2020

2020 to 2021 Year over year growth for Portfolio 1

Portfolio 1 was able to take advantage of the 30% market drop caused by the pandemic and the ensuing market recovery. When the pandemic caused the acceleration of the digital transformation, investments were made in many of the top technology trends: cybersecurity (Crowdstrike (NASD:CRWD)); online shopping (Lightspeed Commerce (TSX:LSPD); online payment processing (TSX:NVEI); remote work DocuSign; telehealth (Teladoc and Well Health); and online entertainment (Roku (NASD:ROKU). Other Investments include Fastly (NYSE:FSLY), SEA Limited (NYSE:SE), Visa (NYSE:V), Virgin Galactic (NASD:SPCE), Trisura (TSX:TSU), AcuityAds (TSX:AT), Datadog (NASD:DDOG) and Celsius Holdings (NASD:CELH).

Existing transportation stocks CN Rail (TSX:CNR) and CargoJet (TSX:CJT) also had a strong 2020 thanks to increased shipments as a result of the growth in online shopping.

On the downside for 2020, Luckin Coffee(it has since been delisted from the Nasdaq Exchange) was discovered to have cooked their books, causing the stock to immediately fall from near USD $50 to around USD $2 in less than 5 minutes. Ouch! I finally sold Intel (NASD:INTC) and Cisco (NASD:CSCO) to invest in Apple (NASD:AAPL), a company that has done great for many years.

2021

In 2021, I sold nearly all the cannabis stocks purchased in 2018. Most were sold at a loss. I should have sold these stocks once cannabis was legalised in Canada in late 2018, when they were at their peak. I was hoping the US would legalize cannabis at the federal level, causing shares in the companies to spike. When legalization never materialized, I decided to get out.

I also sold Virgin Galactic which provided the money to buy General Motors (NYSE:GM). I like GM’s Cruise battery technology and I’m hoping GM will be able to ride the electric vehicle tailwinds. I sold Fastly and bought Cloudflare (NASD:NET) with the proceeds.

On the buying side, I attempted to diversify away from the technology sector with investments in Home Depot (NYSE:HD), GM, Tesla (NASD:TSLA) and ZIM Shipping (NYSE:ZIM). I also made a few ‘swing for the fences’ purchases. I don’t expect much to happen with these companies, but I hope within a few years they will get bought out (Yellow Pages (TSX:Y) or become dominant in their respective fields: FuboTV (NYSE:FUBO) in interactive gambling on streaming sporting events; and Unity Software (NYSE:U) in the metaverse.

Finally, Great Canadian Gaming was taken private in September. Those shares were bought in the 1980s. That investment did well. 😊 With the proceeds, money was invested across the best performing companies, and a few new companies such as Alphabet (NASD:GOOGL) and Rivian Automotive (NASD:RIVN).

2022

The plan is to trim the number of companies down to best 40 companies, either through performance or potential.

Portfolio 2

2020

2020 to 2021 Year over year growth for Portfolio 2

Prior to the onset of the pandemic, investments were made into Real Estate Investment Trusts (REITs) to diversify the portfolio and generate cash while achieving growth. After the initial crash brought on by the pandemic, the portfolio slowly started to climb back to pre-pandemic levels and beyond. The main drivers were Guardant Health (NASD:GH), Microsoft (NASD:MSFT) and MongoDB (NASD:MDB). There was no specific tailwind propelling this portfolio, it just performed well. One notable exception was Chorus Aviation (TSX:CHR). Their share price was cut in half when North America shutdown and then they halted their dividends. Other than Chorus, all other dividend paying companies maintained their dividends. Pure Storage (NASD:PSTG) was sold to free up cash to invest in Zynga (NASD:ZNGA), a mobile gaming company.

2021

The information technology companies Microsoft and MongoDB again were the main drivers in this portfolio. Guardant Health, Zynga and Chorus Aviation dropped during the year while the rest of the companies had decent years. At the start of the year, Savaria (TSX:SIS) was sold because its share price had remained flat for 3 years and I didn’t expect that to change in the near future. That money was invested in Alimentation Couche-Tard Inc (TSX:ATD). In March, money was added to Portfolio 2 and investments were made in three solid, dividend paying stocks: Brookfield Select Opportunities Fund (TSX:BSO.UN) for its 10% dividend; Telus Corporation (TSX:T) for its decent dividend (4.7%) and modest growth potential; and Brookfield Renewable Resources (TSX:BEP.UN) for its modest dividend (3%) and potential growth from renewable energy tailwinds. In the fall, shares in Canopy Growth (TSX:WEED) were sold after there was little to no movement on the legalization of cannabis at the federal level in the US. The proceeds of this sale were invested in iA Financial Corporation Inc. (TSX:IAG), a financial sector company with steady growth and a decent dividend.

Note: none of the money added to the portfolio in March, nor the returns generated from the investments made with that cash infusion, were used in calculating the 2021 returns. It was rolled into the Portfolio 2 calculations on January 4, 2022.

Portfolio 3

2020

2020 to 2021 Year over year growth for Portfolio 3

As with Portfolio 2, most of the transactions were made prior to the onset of the pandemic and the stock market crash. Portfolio 3 dropped nearly 15% during the market crash then not only worked back up to pre-pandemic levels but easily surpassed them. As with the other two Portfolios, Portfolio 3 rode the digital transformation tailwinds accelerated by the pandemic. However, growth was primarily driven by Shopify (TSX:SHOP) which went from CAD$ 516.30 on January 2 to CAD$ 1,437.32 at the end of the 2020, a gain of 278%. Another big winner was AcuityAds which gained 527% from its purchase in late August to the end of 2020. Unfortunately, it was a very small position dollar wise so did not have a significant impact on Portfolio 3. In December, a few shares in Shopify were sold to reduce Shopify’s influence on the portfolio and diversify the portfolio. I’d like to think it was skill that generated Portfolio 3’s tremendous return, however, it was more good fortune in owning the right stock – Shopify – at the right time.

2021

Portfolio 3 was very quiet in 2021. No additional money was added but the money from the sale of a few Shopify shares was used to invest in two companies that could ride the cybersecurity (Cloudflare) and the growing metaverse (Unity Software) tailwinds. In addition, investments were made in Enghouse Systems (TSX:ENGH) and Telus International (TSX:TIXT). Finally, Brookfield Asset Management (TSX:BAM.A) spun off their reinsurance business into Brookfield Asset Management Reinsurance Partners (TSX:BAMR), adding another Brookfield company to the portfolio.

Well, that’s it for 2021. I’m confident 2020 returns were a once a decade occurrence, but I’ll be very happy if each of the portfolios can provide a 15% return, or higher. Here’s to a successful 2022!


The week ending February 18, 2022

When I got back into investing in 2018, I thought I would never buy shares of an oil come as the green revolution was underway and I’m very optimistic about renewable energy and electric vehicles. All I knew about oil companies was the price of oil had fallen from over USD$ 100 a barrel in 2013 to a range between USD $40 – $60 a barrel, a price that was profitable for most companies. Add in the push to electric vehicles and renewable energy sources, I saw oil companies as a dying industry. With the onset of the Covid-19 pandemic in 2020, oil briefly fell to under USD $20 a barrel. The oil industry was done, or so I thought.

Fast forward to February 2022 and it turns out the oil industry is still very much alive. Not only is it alive, but I’ve invested in a few oil & gas companies and I’m looking into one or two additional oil & gas related companies. What changed you ask. Well….

The push to renewable energy is in full swing, and I’ve invested in a few of these companies, but the world cannot go cold turkey from its dependence on oil and gas. Long term, the oil & gas industry is in decline. However, until a reliable alternative is found, there is still strong demand for this type of resource in everyday life. Just ask anyone who has to heat their home during a cold winter. I was aware of the necessity of oil for vehicles and heating but there are so many more applications for oil and natural gas. Check out this interactive infographic from the International Association of Oil & Gas Producers to see how much we rely on this resource. Now, I agree climate change is happening and we should continue the move to renewable energy sources as soon as possible, but in the meantime the world still needs oil.

As an investment, companies in the oil and gas industry are looking more attractive. A year ago, the price of oil was just under USD $60 a barrel and now sits at over USD $90 a barrel. Cold snaps in various locations throughout the world have further increased demand for oil to heat homes. On the supply side, tensions in the Ukraine are causing fears of a restricted supply of oil from the world’s third largest exporter of oil. If Russia were to invade Ukraine, oil could top $100 a barrel for the first time since 2014. So much for lower gas prices.

With huge demands for oil and limited supplies, and an anticipated growth in the demand for oil for at least the next 10 years, oil and natural gas companies are raking in the cash. In previous years these energy companies would re-invest that cash into exploration, development and production projects. However, those in charge of fossil fuel energy companies aren’t blind to what is happening around them. They realize there is a growing move to renewable energy sources and in the long term there will be a decline in the demand for their product so there is not much profit to be made by investing in exploration and the development of new wells. Rather than plowing profits into drilling more wells, they are focused on more short-term projects that can provide a high return on investment. To increase shareholder value and continue to attract investors, they are returning a higher percentage of their money back to shareholders by way of increasing dividends, and/or using some of this money to buy back shares as a way of increasing investor’s earnings per share (the less shares, the more earnings per share). With a small investment in oil and gas companies, I’ve been able to capitalize on rising share prices, and receive a growing dividend. Together, these provide a solid total gain on the investment.

I’ll continue to invest in alternative energy resources and renewable energy products. However, this seems to be a great opportunity to take advantage of a product that is growing in demand and returning more and more cash to investors. If they are giving it away, I’m happy to receive it. 😊

Now, lets see what happened with oil and the rest of the market last week….

Weekly Market Review

Monday: The week started off on a downer with all four major North American Indexes ending the day in the red. However, all three American Indexes, Nasdaq Composite Index (Nasdaq), the S&P 500 Index (S&P), and the Dow Jones Industrial Average (DJIA), ended the day with a late rally. On the other hand, the Toronto Stock Exchange Composite Index (TSX) fell early and stayed down for the rest of the day. The 1 – 2 punch of interest rate hikes and fears of a Russian invasion of Ukraine continue to dog the market. In Canada, government overreach protests have started to negatively impact the Canadian economy, causing the Canadian government to invoke the Emergencies Act to put an end to the blockades at Canadian land ports of entry. This is the first time the Emergencies Act has been invoked since it replaced the War Measures Act in 1988.

Tuesday: The welcome reports of Russia sending some of its trooped amassed along the Ukraine border back to their bases eased the tension in the area and sent all four Indexes upward. The dialing back of tensions also eased oil supply concerns, causing the price of a barrel of oil to fall to USD$ 92.07. While Energy sector stocks fell, gains in Consumer Discretionary, Technology, and Industrial sectors more than compensated for the drop in Energy stocks.

Wednesday: A report showing Canada’s inflation rate increased in January to 5.1%, a 30 year high, combined with a drop in the Technology sector (primarily Shopify (TSX:SHOP) dropping 17%) was more than enough to offset gains in both the Materials sector and Energy.

South of the border, the three US Indexes fell sharply early but rallied late to end the day essentially flat. The S&P was able to inch into the black while the DJIA and Nasdaq ended the day slightly lower. Fears of interest rates hikes, and geopolitical tensions caused the Indexes to fall, but they reversed themselves when the US Federal Reserve announced they would review interest rates on a meeting-by-meeting basis rather than a fixed amount.

Thursday: A rough day for all 4 Indexes with only the TSX able to limit its decline to less than 1%. While Wednesday’s declines could be blamed on fears of interest rate hikes, today’s fall can be laid at the feet of fears Russia would invade Ukraine when the US said they did not see any evidence of a Russian troop withdrawal. Not only would a war in Ukraine plunge the world into a very dangerous situation, but it would also lead to disruptions in energy supplies (Russia is a top oil producer and supplier) which in turn would raise inflation higher as a shortage of gas would lead to higher prices at the pump.

In Canada, losses on the TSX were mitigated thanks to another strong day for members of the Materials sector (miners and fertilizer companies), which was up 2.3% for the day.

In the USA, investors left the growthier sectors of Technology and Communications Services in favour of the more defensive sectors such as Utilities and Consumer Defensive. The DJIA suffered its largest single day loss (1.78%) since late November.

Friday: All four Indexes were down for the day; however, the Nasdaq was the only one down more than 1%. As on Thursday, the main culprit was ongoing tensions in the Ukraine. Despite strong earnings results, investors continued to move out of the high growth stocks to safer assets as the long weekend approached.

For the week, the TSX broke a three-week winning streak while the three American Indexes declined for a second straight week.

Weekly Portfolio Review

It was a bad week in every sense for the three Portfolios as they all had a worse week than the worst Index. And to top it off, Portfolio 3 was very close to a double-digit loss for the week. ☹ As in previous weeks, the technology sector bias of all three Indexes is not helping when there are fears of upcoming interest rate hikes. Portfolio 1 has several companies that benefitted from the acceleration of the digital transformation caused by the pandemic. As the world reopens, there is a natural slowdown in the demand for these companies’ product. Investors don’t like it when the growth rate of high growth companies slows down as is currently happening. Portfolio 2 once again benefits from being more balanced than the other two portfolios and fell the least. Bringing up the rear, literally, Portfolio 3 was punished for being overexposed to one company – Shopify. It was great riding it up for the last two years but not so great seeing it cut in half in less than four months.

Weekly Portfolio & Index performance
Weekly Portfolio & Index performance for the week ended Feb. 18, 2022.

Companies on the Radar

Two new companies have come onto my radar of late, but I have not had a chance to take more than a 2 minute look at either of them. The first is Pulse Seismic (TSX:PSD), the largest provider of seismic data to the energy sector in Canada. The company had a great earnings report on February 17 that has prompted me to take a closer look at the company and its potential.

The other company is Kornit Digital (NASD:KRNT), a “market leader in sustainable, on-demand, digital fashion and textile production technologies”. Their solutions allow for on-demand printing rather than forcing suppliers to carry excess inventory. Sounds interesting, and if they truly are a market leader I will add them to my growing list of companies on my radar, which includes:

In the case of Fubo, a lot depends on their earnings report due on February 23.

Portfolio Update

Portfolio 1

Portfolio 1 for the week ended February 18, 2022: DOWN Red Down Arrow

One of my favourite companies in Portfolio 1, Nvidia, had a strong fourth quarter earnings report (see the highlights in the Quarterly Reports section below). I believe Nvidia will be a top performer, for the next few years at least, because of the company’s optionality. That is, they have a lot of different markets for their products (graphic processor units (GPUs), or chips). Their products can be found in several of the fastest growing trends in the digital world, including gaming, data centers, cloud computing, autonomous vehicles, artificial intelligence and the much talked about ‘metaverse’. In fact, they are market leaders in a number of these fields. Nvidia is a great way to get exposure to a market leader with a number of tailwinds at its back. Despite all that, Nvidia fell 7.5% later in the week when the company predicted gross margins would remain flat in this current quarter. Perhaps this dip is telling me to buy more shares in Nvidia. 😊

In other Portfolio 1 news, on Friday Roku (NASD:ROKU) fell sharply when the company reported fourth quarter earnings with lower-than-expected revenue growth and gloomy prospects for the first quarter thanks to supply chain issues. I suspect Roku is a victim of people getting out and about more and not watching as much TV. The company will continue to grow, just not as fast as during the pandemic when people spent more time at home. Roku continues to be the leading TV operating system in North America and is expanding internationally.

Visa (NYSE:V) and Amazon (NASD:AMZN) UK have made peace, allowing Amazon shoppers to continue using Visa for their online shopping. This is probably better news for Visa than Amazon with the growing number of Amazon shoppers and ensures Visa is “Everywhere you want to be.” 😊


Activity

No significant activity to report this week.

Dividends

Dividends Received this week for the following companies:

Companies followed by DRIP (Dividend Re-Investment Plan) indicate additional shares were purchased with the dividend. Any cash leftover was added to the cash balance.

Canadian $

Automotive Properties Real Estate Investment Trust (TSX:APR.UN) DRIP

US $

BSR Real Estate Investment Trust (TSX:HOM.U)

Quarterly Reports

Voyageur Digital Ltd.

All currency listed in US dollars

Selected highlights from their second quarter 2022 financial results on February 15, 2022

  • Revenue for the quarter is $164.8 million, up over 4400% compared to $3.5 million for the quarter ended December 31, 2020.
  • Revenue for the calendar year ended December 31, 2021, is $415.8 million vs $6.6 million for the calendar year ended December 31, 2020.
  • Total funded accounts exceed 1,074,000 as of December 31, 2021, up 25% from 860,000 at the quarter ended September 30, 2021.
  • Total Assets on Platform grew to $5.9 billion from $4.3 billion as of September 30, 2021.

Lattice Semiconductor Corp

All currency listed in US dollars

Selected highlights from their fourth quarter 2021 financial results on February 15, 2022

(In thousands, except per share data)

Fourth quarter highlights

  • 4 2021 revenue increases 32.3% compared to Q4 2020 and 7.5% compared to Q3 2021
  • Net income of $28,532 compared to $15,989 to Q4 2020
  • Net Income Improves to $0.20 Per Diluted Share for Q4 2021 compared to $0.11 for Q4 2020

2021 highlights

  • Revenue increases 26.3% for the full year 2021 compared to the full year 2020
  • Net income of $$95,922 compared to $47,392 in 2020
  • Net Income Improves to $0.67 Per Diluted Share 2021 compared to $0.34 for 2020

Nvidia Corp

All currency listed in US dollars

Selected highlights from their fourth quarter 2021 financial results on February 16, 2022

($ in millions, except earnings per share)

Fourth quarter highlights

  • Revenue of $7.64 billion, up 53% from a year earlier and up 8% from the previous quarter
  • Net income was $3,003, up 106% from a year earlier
  • Earnings per diluted share for the quarter were a record $1.18, up 103% from a year ago and up 22% from the previous quarter
  • Set record quarterly revenues in their Gaming, Data Center and Professional Visualization units.
  • Revenue in Automotive & Robotics unit was down 14% from a year ago.

2021 highlights

  • Revenue of $26.91 billion, up 61 percent
  • Net income was $9,752, up 125%
  • Earnings per diluted share were a record $3.85, up 123% from $1.73 a year ago
  • Gaming revenue rose 61 percent to a record $12.46 billion
  • Data center revenue rose 58 percent to a record $10.61 billion.
  • Professional Visualization revenue rose 100 percent to a record $2.11 billion.
  • Automotive & Robotics revenue up 6%.

Trade Desk Inc

All currency listed in US dollars

Selected highlights from their fourth quarter 2021 financial results on February 16, 2022

($ in millions, except earnings per share)

Fourth quarter highlights

  • Revenue of $395.6, up 24% compared to the same period in 2020
  • Net income of $8.0, compared to $151.9 in 2020

2021 highlights

  • Revenue was $1,196.5, compared to $836 in 2020, up 43%
  • Net income was $137.7, compared to $242,317 in 2020
  • 2021 gross spend on the platform was approximately $6.2 billion, a 47% increase year-over-year.
  • Customer retention remained over 95% during the fourth quarter and throughout fiscal year 2021, as it has for the past 8 consecutive years.

Global-E Online Ltd

All currency listed in US dollars

Selected highlights from their fourth quarter 2021 financial results on February 16, 2022

Fourth quarter highlights

  • Revenue in the fourth quarter of 2021 was $82.7 million, an increase of 54% year over year.
  • Gross margin in the fourth quarter of 2021 was 39.5%, an increase from 33.5% in the fourth quarter of 2020
  • Net loss in the fourth quarter of 2021 was ($22.5) million, compared to a net profit of $4.3 million in the year-ago period.

2021 highlights

  • Revenue for the full year was $245.3 million, an increase of 80% year over year
  • Gross profit for the full year was $91.4 million, an increase of 110% year over year
  • Net loss for the full year was ($74.9) million, compared to a net profit of $3.9 million in the year-ago period.

Roku Inc

All currency listed in US dollars

Selected highlights from their fourth quarter 2021 financial results on February 17, 2022

(In thousands, except per share data)

Fourth quarter highlights

  • Net revenue of $865,329 compared to $649,886 in the fourth quarter of 2020, an increase of 33%
  • Net income of $23,687 compared to 67,306 in the fourth quarter of 2020, a decline
  • Active Accounts reached 60.1 million, a net increase of 8.9 million active accounts from Q4 2020

2021 highlights

  • Total net revenue grew 55% year-over-year to $2.765 billion
  • Net income of $242,385 compared to a net loss of $17,507 in the previous year
  • Gross profit was up 74% year-over-year to $1.409 billion
  • Average Revenue Per User (ARPU) grew to $41.03 (trailing 12-month basis), up 43% YoY
  • No. 1 TV streaming platform in the U.S., Canada, and Mexico by hours streamed

Portfolio 2

Portfolio 2 for the week ended February 18, 2022: DOWN Red Down Arrow

Per this week’s introduction, and to paraphrase Mark Twain, reports of oil’s death have been greatly exaggerated. Case in point is TC Energy (TSX:TRP) which beat analysts’ estimates for quarterly profit. Their revenues were boosted by strong demand for its oil and gas transportation services after energy prices hit multi-year highs.

I was glad to finally see Chorus Aviation (TSX:CHR) start to make a comeback this past week. The company’s share price nose dived at the start of the pandemic in March 2020, and then they eliminated their dividend. I’ve been debating whether to sell the shares since I don’t see this airline stock suddenly taking off (pun intended) but when I look at TD Direct Investing’s research tools it shows the company as a Strong Buy with an average target of CAD $5.75, a 32.5% upside. I’ll continue to hold it and hope they reintroduce a dividend. However, if I find a company I like better with more upside it won’t take much for me to decide to move on.

Activity

No significant activity to report this week.

Dividends

Dividends Received this week for the following companies:

Companies followed by DRIP (Dividend Re-Investment Plan) indicate additional shares were purchased with the dividend. Any cash leftover was added to the cash balance.

Canadian $

Summit Industrial Income REIT (TSX:SMU.UN)

US $

No US$ dividends this past week.

Quarterly Reports

TC Energy Corp

All currency listed in CAD dollars

Selected highlights from their fourth quarter 2021 financial results on February 15, 2022

Fourth quarter highlights

  • Net income attributable to common shares of $1.1 billion or $1.14 per common share
  • Net income of $1,035 million compared to $1,080 million for the same period in 2020

2021 highlights

  • Net income attributable to common shares of $1.8 billion or $1.87 per common share
  • Net income of $4,153 million compared to $3,945 million for the same period in 2020
  • A 3.4% increase in the quarterly common share dividend to $0.90 per common share for the quarter ending March 31, 2022

Chorus Aviation Inc.

All currency listed in CAD dollars

Selected highlights from their fourth quarter 2021 financial results on February 16, 2022

(Expressed in thousands of Canadian dollars)

Fourth quarter highlights

  • Increased operating revenue to $346,516, up 59% from the same period in 2020
  • Net income of $10.2 million, or $0.06 per basic share; a quarter-over-quarter increase of 10%

2021 highlights

  • Increased operating revenue to $1,023,275, up 8% from fiscal 2020
  • Net loss of $20.5 million, or $0.12 per basic share; a year-over-year decrease in net income of $62.0 million.

iA Financial Corporation

All currency listed in CAD dollars

Selected highlights from their fourth quarter 2021 financial results on February 16, 2022

(In millions)

Fourth quarter highlights

  • Net income of $209, an increase of 22% over the same period in the previous fiscal year
  • Reported ROE of 13.2% compared to 12.8% over the same period in the previous fiscal year
  • Earnings per common share of $1.94, up 16% over the same period in the previous fiscal year
  • Assets under management and administration¤ reached a record $221.2 billion at the end of the fourth quarter, up 12% year over year and up nearly $7 billion during the quarter.

2021 highlights

  • Net income of $830, an increase of 36% over the previous fiscal year
  • Reported ROE of 14.2% for the fiscal year
  • Earnings per common share of $7.70, up 35% over the previous fiscal year
  • Board of Directors approved a quarterly dividend of $0.6250 per share, the same as in the fourth quarter of 2021.

Portfolio 3

Portfolio 3 for the week ended February 18, 2022: DOWN Red Down Arrow

Ouch!

How else to describe hearing that after their earnings report on Wednesday, Shopify experienced their largest single day decline of 17%. I thought there would be a bit of a bounce but the share price ended the week down 35% from Tuesday’s closing price. The company is still growing revenue and had net income of over $2 billion. As with Nvidia and Roku mentioned previously, their sin was they predicted a slower pace for revenue growth – “… anticipates revenue growth for the full year 2022 that is lower than the 57% revenue growth achieved in 2021.” Given the growth of online merchants and shopping over the past two years during the pandemic, which lead to the tremendous growth, and the return to in person shopping as the world reopens, its not surprising the growth rate is expected to cool off. If Shopify had not advised of a probable slow down in their revenues for fiscal 2022, they most likely would have missed their expected numbers and the market frowns on companies that miss expectations (remember, Meta (NASD:FB) fell 27% and lost more than $230 billion in their market capitalization).

The other bit of news announced during their earnings report was Shopify was investing in constructing state of the art warehouse fulfillment centres. This infrastructure would allow merchants to easily sell their products anywhere and grow their business quicker. This is all well and good, but this puts Shopify directly in competition with very deep pocketed Amazon. it will be interesting to see how this battle plays out.

Despite being down 62% from its July 2021 peak, as a long-term investment, I still like Shopify and their management team, so I’ll be holding onto the shares as the company goes through this rough patch.

Activity

No significant activity to report this week.

Dividends

Dividends Received this week for the following companies:

Companies followed by DRIP (Dividend Re-Investment Plan) indicate additional shares were purchased with the dividend. Any cash leftover was added to the cash balance.

No dividends this past week.

Quarterly Reports

Goeasy Ltd.

All currency listed in CAD dollars

Selected highlights from their fourth quarter 2021 financial results on February 16, 2022

Fourth quarter highlights

  • Revenue of $234,430,000, up 35% from the same period in 2020
  • Net income of $49,961,000, compared to $ 48,911 from the same period in 2020
  • Record net customer growth during the quarter of 10,725

2021 highlights

  • Revenue of $826,722,000 up 26% from 2020
  • Net income of $244,943,000 compared to $136,505,000 from 2020, an increase of almost 80%
  • Increased the annual dividend from $2.64 per share to $3.64 per share, an increase of 38%

Shopify Inc

All currency listed in US dollars

Selected highlights from their fourth quarter 2021 financial results on February 16, 2022

Fourth quarter highlights

  • Revenue rose 41% to $1.38 billion, compared with analysts’ estimates of $1.33 billion.
  • Monthly Recurring Revenue (“MRR”) was $102.0 million, surpassing $100 million for the first time. MRR increased 23% year over year, up from $82.6 million as of December 31, 2020.
  • Net loss for the fourth quarter was $371.3 million (includes a $509.7 million net unrealized loss on equity and other investments), or $2.95 per basic and diluted share, compared with net income of $123.9 million, or $0.99 per diluted share.
  • From the start of Black Friday in New Zealand, through the end of Cyber Monday in California, sales on Shopify’s platform reached more than $6.3 billion. This compares with more than $5.1 billion for the global Black Friday Cyber Monday period in 2020.

2021 highlights

  • Total revenue for the full year 2021 was $4,611.9 million, a 57% increase over 2020.
  • Net income for 2021 was $2,914.7 million (includes a $2.9 billion unrealized net gain on our equity investments), or $22.90 per diluted share, compared with net income of $319.5 million, or $2.59 per diluted share, for 2020
  • Launched TikTok Shopping, integrated POS retail hardware


The week ending February 11, 2022

It was an interesting week to see how global actions impact the stock market. After an initial dip, the stock market headed upward with Energy and Technology stocks leading the way. At the end of the week technology stocks had retreated, and energy stocks, after a mid week lull, headed up at the end of the week. So, what is impacting these two sectors?

On the energy front, Russia is one of the top 5 global oil exporters, probably in the top 2 for Europe. With the increasing demand for oil by European countries, blocking oil exports from Russia to Europe would have an immediate impact on Europe. From an investment perspective, Canadian and American energy/oil companies would stand to benefit from the increased demand for their oil resources to replace the oil currently supplied by Russia. At the start of the week fears of an invasion of Ukraine and the West’s threat to cut off Russian oil exports caused the share prices of North American energy companies to surge. Midweek, tensions eased a bit and the price of energy stocks retreated. Then the US and other western countries withdrew their respective diplomatic staffs from Ukraine and warned of imminent invasion, causing energy prices to resume their march upward. As long as tensions in Ukraine remain, combined with increased demand for oil in the North American market, oil prices should remain high causing the share price of oil companies to continue to rise for the next few months, with the occasional dip along the way.

The technology stocks continue to be volatile on fears of inflation. This leads to increasing interest rates, which in turn leads to lower stock prices as the cost to pay down their debt increases, taking away from capital to re-invest in themselves. The recent US Inflation Report showed inflation running at 7.5%, much higher than the US Federal Reserve would like. In Canada the news wasn’t much better, with a December rate of 4.8% and the January report due next week. The target rate for both countries is around 3%. As a result of high inflation rates, the central banks of both countries (Bank of Canada and US Federal Reserve) have indicated they will raise interest rates in March. The question haunting the markets now is, how much will the rates rise and how often will they raise their respective interest rates. Volatility in this sector, and the market in general, will remain until the number and extent of rate hikes is known.

The uncertainty caused by tensions in Ukraine, inflation and corresponding interest hikes, and to a lesser extent (currently) covid-19 and supply chain issues, continues to weigh on the stock market. Whenever I think the current market correction has bottomed and I’m ready to step back into the market, the market decides to head downward. Inevitably, the cause of the dip is related to the Ukraine or interest rates. At some point I’ll have to make a leap of faith and get back in but for now I’m content to sit on the sideline and let the market continue its descent. Assuming war doesn’t break out in Ukraine, once the market has an idea of the amount of the first interest rate hike, I’m hoping a bottom will be established. That is when I’ll start buying some of the great deals currently in the stock market.

For now, lets take a look at the week that was in the markets…

Weekly Market Review

Monday: On the downside, three of the four major North American Indexes lost ground today. On the positive side, the losses were minimal. Compared to January, a flat start to the week is a good thing.

On the Toronto Stock Exchange Composite Index (TSX), gains in the materials sector were not enough to offset losses in the technology and energy sectors. In the US, Meta (NASD:FB), continued to slide, dragging the Nasdaq Composite Index (Nasdaq) and the S&P 500 Index (S&P). Considering Meta fell 5.1% today, and the Nasdaq and S&P fell .58% and .37, respectively, the rest of the companies in the Index probably had a flat if not OK day to offset the Meta loss. Finally, the Dow Jones Industrial Average (DJIA) ended the day flat.

Monday’s close provided no indication if the markets have bottomed and will start heading upward or if last week was a bear rally. Either way I suspect we are not done with this rollercoaster ride.

Tuesday: The Indexes were all back on the winning track today. On all four Indexes, gains in the Financials and Materials sectors were enough to overcome the drop in the Energy sector. Financial companies, especially banks, outperform when interest rates rise, as they are set to do in March on both sies of the border. Higher prices for gold boosted the Materials sector.

Wednesday: All four Indexes were up for the second day in a row as most sectors all had a good day. On the S&P, all eleven sectors ended the day in positive territory. The Consumer Discretionary sector is benefiting from the unwinding of covid-19 restrictions which would give a boost to the economies of both Canada and the US. As the economy picks up, people start to spend more, which is good for Consumer Discretionary sector companies. Meanwhile, there is a sense there is a ceiling for how high interest rates will be raised. As a result, money is moving back into the Technology sectors of both countries. In Canada, Shopify (TSX:SHOP) rose almost 5%, while in the US, big tech titans Microsoft (NASD:MSFT) and Nvidia (NASD:NVDA) helped drive the Nasdaq and S&P higher.

All eyes turn to Wednesday’s US Inflation rate report. A rate greater than 7% could cause the US Federal Reserve to raise interest rates faster than the market is expecting.

Thursday: All four Indexes were down after two positive days on fears of more aggressive interest rate hikes after the US Inflation report showed inflation at 7.5% for January, the largest annual increase in 40 years. As usual when fears of interest rate hikes arise, the Technology and Consumer Discretionary sectors took a tumble on both sides of the border. The TSX, thanks to its heavier weighting of Financial and Energy stocks than its American counterparts, fell the least at .4%, while the three US Indexes dropped over 1.4% each.

Friday: The TSX inched higher today to help it post gains for a third straight week. Today the TSX was helped by gains in the Energy and the Materials sectors. In the US, all three Indexes ended the day down at least 1%. Big tech companies, Amazon (NASD:AMZN), Apple (NASD:AAPL), Microsoft and Nvidia all lost over 2%, bringing down the S&P and Nasdaq. The primary culprits weighing on the Indexes are the ongoing tensions in the Ukraine, and the concerns about upcoming interest rate hikes following Thursday’s US Inflation report.

For the week, the TSX was up 1.3%, the S&P fell 1.82%, the DJIA was down 1.0%, and leading the pack downward, the Nasdaq dropped 2.18%

Weekly Portfolio Review

The TSX was the only Index to post a win for the week, thanks to its heavier weighting in the Financial and Energy sectors. The S&P and Nasdaq were dragged down by the Technology sector while the DJIA fell the least. As for the Portfolios, Portfolio 2 was the only Portfolio to rack up a win. Portfolio 2 is more balanced than the other two technology heavy Portfolios. Once again, slow and steady Portfolio 2 put up another good week. Considering how technology heavy Portfolio 1 and 3 are, its a bit surprising they didn’t fall further considering the losses of the Nasdaq and the S&P last week. The only thing that comes to mind is the Portfolios each had enough Canadian stocks (banking companies specifically) to cushion the blow of the US based companies in each of the Portfolios. I don’t know if this could have occurred if I had invested in US banks instead of Canadian banks, and it would not have occurred if any of the Portfolios was solely invested in the US market. Another reason to diversify across sectors and across countries.

Weekly Portfolio & Index performance
Weekly Portfolio & Index performance for the week ended Feb. 11, 2022.

Companies on the Radar

While reviewing Disney’s (NYSE:DIS) latest earnings report, I came across a line item in Disney’s financial statements indicating Disney has an investment in FuboTV (NYSE:FUBO). Since Fubo has been badly beaten down in 2022, it wasn’t on my radar for further investment, but the Disney earnings report caused me to take a second look. Fubo is a live sports oriented streaming platform that can stream to smartTVs, mobile devices and computers. At this point it sounds like just another streaming service. But what differentiates Fubo from other streaming service and caused me to make an initial investment in Fubo, is its plans to become an interactive sports wagering platform with a live TV streaming experience. This would make it a first mover in the integration of live streaming and a real time betting on events you are watching. While I’m not a gambler, I think gambling is a growing industry (just think of all the ads on TV for online gambling) and it is only a matter of time before real time wagering on events you are watching becomes mainstream. While Fubo has grown its subscriber base and revenues, it has also launched its Sportsbook in 2 states and recently signed a deal with Ceasars Entertainment Inc to provide access in an additional 8 states. Fubo appears to be executing its plan, but I want to see their earnings report due on February 23. For now, I’ll add them to my radar of stocks from last week:

  • Microsoft
  • Apple
  • Home Depot (NYSE:HD)
  • Nvidia

Portfolio Update

Portfolio 1

Portfolio 1 for the week ended February 11, 2022: DOWN Red Down Arrow

Very good earnings report from Datadog (NASD:DDOG) with increased revenues and an increase of 114% in the number of customers with USD $1 million of annual recurring revenue (ARR), and over 2,000 customers with ARR of $100,000 or more, an increase of 63% from 1,228 in 2020. This indicates their land and expand strategy is working and should continue to increase revenues.

As for the rest of the companies that reported last week, no red flags. I invested in Yellow Pages hoping it would be purchased by another company and I could get a share price bump as a result, so I’m not concerned about their report. However, I’d like to see better earnings to push up the value of the company.

Activity

No significant activity to report this week.

Dividends

Dividends Received this week for the following companies:

Companies followed by DRIP (Dividend Re-Investment Plan) indicate additional shares were purchased with the dividend. Any cash leftover was added to the cash balance.

Canadian $

Bank of Nova Scotia DRIP

US $

Apple Inc

Quarterly Reports

TMX Group Ltd

All currency listed in CAD dollars

Selected highlights from their fourth quarter 2021 financial results on February 7, 2022

Fourth quarter highlights

  • Revenue of $252.4 million, up 15% from $219.5 million in Q4/20
  • Diluted earnings per share of $1.56, up 24% from $1.26 in Q4/20
  • Net Income up 22%

2021 highlights

  • Revenue of $980.7 million, up 13% from 2020
  • Net income of $338.5 million, up 21% from 2020
  • Raised dividend by 8% to $.83 per share.

Telus Corp

All currency listed in CAD dollars

Selected highlights from their fourth quarter 2021 financial results on February 10, 2022

Fourth quarter highlights

  • Revenue up 10%
  • Net Income up 16%
  • Total Mobile and Fixed customer growth of 272,000, Telus’s best fourth quarter on record and an increase of 19,000 over last year.

2021 highlights

  • Operating Revenue up 9.8%
  • Net Income up 35%
  • Record 960,000 net customer additions
  • Dividends declared in 2021 up 7.3 per cent; Quarterly dividend declared for April 2022 of $0.3274, up 5.2 per cent over the prior year

Datadog Inc

All currency listed in US dollars

Selected highlights from their fourth quarter 2021 financial results on February 10, 2022

Fourth quarter highlights

  • Fourth quarter revenue grew 84% year-over-year to $326 million
  • GAAP net income per diluted share was $0.02

2021 highlights

  • Revenue was $1.03 billion, an increase of 70% year-over-year.
  • GAAP operating loss was $19.2 million
  • 216 customers with Annual Recurring Revenue of $1 million or more, an increase of 114% from 101 as of December 31, 2020

Cloudflare Inc

All currency listed in US dollars

Selected highlights from their fourth quarter 2021 financial results on February 10, 2022

Fourth quarter highlights

  • Fourth quarter revenue totaled $193.6 million, an increase of 54% over the same period last year
  • GAAP net loss was $77.5 million, compared to $34.0 million in the fourth quarter of 2020
  • GAAP net loss per basic and diluted share was $0.24 compared to $0.11 in the fourth quarter of 2020

2021 highlights

  • 2021 revenue totaled $656.4 million, an increase of 52% year-over-year
  • GAAP net loss was $260.3 million compared to $119.4 million for fiscal 2020
  • GAAP net loss per share was $0.83, compared to $0.40 for fiscal 2020.
  • A 71% year-over-year increase in large customer growth
  • Record dollar-based net retention of 125%, representing an increase of 6% year-over-year, driven by continued strength from large enterprise customers

Upwork Inc

All currency listed in US dollars

Selected highlights from their fourth quarter 2021 financial results on February 10, 2022

Fourth quarter highlights

  • Total revenue grew 29% year-over-year to $136.9 million in the fourth quarter of 2021
  • GAAP net loss was $(22.6) million in the fourth quarter of 2021 compared to GAAP net income of $0.9 million in the fourth quarter of 2020
  • GAAP net loss per basic share was $(0.18) in the fourth quarter of 2021 compared to GAAP net income per basic share of $0.01 in the fourth quarter of 2020

2021 highlights

  • Full-year 2021 total revenue grew 35% year-over-year to $502.8 million.
  • Full-year GAAP net loss was $(56.2) million in 2021 compared to GAAP net loss of $(22.9) million in 2020.
  • GAAP net loss per basic share was $(0.44) in 2021 compared to GAAP net loss per basic share of $(0.19) in 2020.

Yellow Pages Ltd

All currency listed in CAD dollars

Selected highlights from their fourth quarter 2021 financial results on February 10, 2022

Fourth quarter highlights

  • Total revenues decreased 10.5% year-over-year to $68.6 million for the fourth quarter, an improvement from the decrease of 11.7% reported last quarter. Due to the decline of higher margin Yellow Pages digital media and print products
  • Net earnings of $38.7 million, or $1.46 per diluted share, compared with $16.8 million, or $0.58 per diluted share, for the prior year quarter. This was a result of previously unrecognized tax attributes and temporary differences.
  • Quarterly revenue of $68.6 million compared with $76.7 million for Q4 2020

2021 highlights

  • Total revenues for the year decreased by 13.8% to $287.6 million, as compared to $333.5 million for the same period last year. As in the fourth quarter, this was due to the decline of higher margin Yellow Pages digital media and print products.
  • Net earnings increased to $70.6 million for the year compared to net earnings of $60.3 million, for the same period last year due to higher recognition of previously unrecognized tax attributes and temporary differences.
  • Declared a dividend of $0.15 per common share, to be paid on March 15

Trisura Group Ltd

All currency listed in CAD dollars

Selected highlights from their fourth quarter 2021 financial results on February 11, 2022

Fourth quarter highlights

  • Net income of $10.3 million in the quarter fell 6.0% compared to Q4 2020, negatively impacted by novation of a life annuity reinsurance contract and higher claims in the quarter
  • EPS of $0.24 in Q4 2021 compared to $0.26 in 2020
  • Interest and dividend income rose 25.8% in the quarter compared to Q4 2020

2021 highlights

  • Net income for the full year grew by 92.8% to $62.6 million, a result of both growth and strong underwriting in Canada, increasing fee income from the US, and appropriate asset liability matching in our Reinsurance business.
  • EPS of $1.49 for the full year compared to $0.82 in 2020
  • ROE of 19.0% compared to 13.4% in 2020, exceeding mid-teens target
  • Interest and dividend income rose 17.6% for the full year compared to 2020

Portfolio 2

Portfolio 2 for the week ended February 11, 2022: UP Green Up Arrow, signifying a positive week

Disney had a very strong first quarter earnings report thanks to a combination of a considerable increase in both visitors to its properties and Disney+ streaming service subscribers. Considering the various lockdowns in 2020, I’d have been surprised if the number of attendees for 2021 had not been higher. While the increased attendance was predictable, its growing subscriber base for Disney’s streaming services such as Disney+, Hulu and ESPN was not so obvious. Though Disney+ is still well behind streaming service leader Netflix, it continues to add subscribers. Combine that with continued growth in the number of visitors to Disney parks, and the amount visitors spend per visit, Disney appears to be returning to its long-term growth rate.

Activity

No significant activity to report this week.

Dividends

Dividends Received this week for the following companies:

Companies followed by DRIP (Dividend Re-Investment Plan) indicate additional shares were purchased with the dividend. Any cash leftover was added to the cash balance.

Canadian $

Bank of Nova Scotia DRIP

US $

No US$ dividends this past week.

Quarterly Reports

Zynga Inc

All currency listed in US dollars

Selected highlights from their fourth quarter 2021 financial results on February 9, 2022

Fourth quarter highlights

  • Record revenue of $695 million, up 13% compared to the fourth quarter, 2020
  • Net loss was up 27% to a loss of $67 million compared to the fourth quarter, 2020

2021 highlights

  • The highest-ever annual revenue of $2,801 million, an increase of 42% year-over-year
  • A net loss of $104 million, an improvement of $325 million year-over-year

Walt Disney Co

All currency listed in US dollars

Selected highlights from their first quarter 2022 financial results on February 9, 2022

  • Diluted earnings per share (EPS) from continuing operations for the quarterincreased to $0.63 from $0.02 in the prior-year quarter
  • First quarter revenue of $ 21,819 million versus $16,249 million
    • Disney Media and Entertainment Distribution revenue up 15&
    • Disney Parks, Experiences and Products revenue up over 100%
  • increase in total subscriptions across Disney’s streaming portfolio to 196.4 million, including 11.8 million Disney+ subscribers added in the first quarter

Telus Corp

All currency listed in CAD dollars

Selected highlights from their fourth quarter 2021 financial results on February 10, 2022

Fourth quarter highlights

  • Revenue up 10%
  • Net Income up 16%
  • Total Mobile and Fixed customer growth of 272,000, Telus’s best fourth quarter on record and an increase of 19,000 over last year.

2021 highlights

  • Operating Revenue up 9.8%
  • Net Income up 35%
  • Record 960,000 net customer additions
  • Dividends declared in 2021 up 7.3 per cent; Quarterly dividend declared for April 2022 of $0.3274, up 5.2 per cent over the prior year

Fortis Inc

All currency listed in CAD dollars

Selected highlights from their fourth quarter 2021 financial results on February 11, 2022

Fourth quarter highlights

  • Net Earnings were $328 million, or $0.69 per common share, compared to $331 million or $0.71 per common share for the same period in 2020

2021 highlights

  • Reported annual net earnings of $1,231 million, or $2.61 per common share in 2021

Portfolio 3

Portfolio 3 for the week ended February 11, 2022: DOWN Red Down Arrow

During the Brookfield Asset Management (TSX:BAM.A) fourth quarter report, the company announced it was considering spinning off its management division to ‘open up growth opportunities to us that don’t exist today’. Portfolio 3 currently has three Brookfield companies (Brookfield Asset Management Inc, Brookfield Renewable Partners (TSX:BEP.UN and TSX:BEPC) and Brookfield Renewable Partners (TSX:BAMR). In addition, Brookfield Infrastructure Partners (TSX:BIP.UN and TSX:BIPC) is part of Portfolio 2, Trisura Group (TSX:TSU), completely spun out of the Brookfield orbit, is part of Portfolio 1, and Brookfield Select Opportunities Fund (TSX:BSO.UN) is in both Portfolio 1 and 2. It would be fair to say I like Brookfield run companies. 😊 That being said, I think Brookfield management is very capable, as evidenced by their growing businesses, and I’ve no reason to doubt another Brookfield company would be just as good.

Activity

No significant activity to report this week.

Dividends

Dividends Received this week for the following companies:

Companies followed by DRIP (Dividend Re-Investment Plan) indicate additional shares were purchased with the dividend. Any cash leftover was added to the cash balance.

No dividends this past week.

Quarterly Reports

Telus International Canada Inc

All currency listed in CAD dollars

Selected highlights from their fourth quarter 2021 financial results on February 10, 2022

Fourth quarter highlights

  • Q4 revenue of $600 million, up 36% year-over year
  • Net income of $36 million and diluted EPS of $0.13, compared with $21 million and $0.09 respectively

2021 highlights

  • Full-year revenue of $2,194 million, up 39%
  • Net income of $78 million and diluted EPS of $0.29, compared with $103 million and $0.46 respectively, in the prior year.

Cloudflare Inc

All currency listed in US dollars

Selected highlights from their fourth quarter 2021 financial results on February 10, 2022

Fourth quarter highlights

  • Fourth quarter revenue totaled $193.6 million, an increase of 54% over the same period last year
  • GAAP net loss was $77.5 million, compared to $34.0 million in the fourth quarter of 2020
  • GAAP net loss per basic and diluted share was $0.24 compared to $0.11 in the fourth quarter of 2020

2021 highlights

  • 2021 revenue totaled $656.4 million, an increase of 52% year-over-year
  • GAAP net loss was $260.3 million compared to $119.4 million for fiscal 2020
  • GAAP net loss per share was $0.83, compared to $0.40 for fiscal 2020.
  • A 71% year-over-year increase in large customer growth
  • Record dollar-based net retention of 125%, representing an increase of 6% year-over-year, driven by continued strength from large enterprise customers

Brookfield Asset Management

All currency listed in US dollars

Selected highlights from their fourth quarter 2021 financial results on February 10, 2022

Fourth quarter highlights

  • 21.7 billion in revenue for the fourth quarter compared to $17 billion in the prior year
  • Generated $3.4 billion of net income for the fourth quarter compared to $1.8 billion in the prior year

2021 highlights

  • $75 billion in revenue, including $71 billion of capital inflows due to strong performance from principal investments, and significant carried interest and gains generated from $42 billion of asset sales.
  • Generated $12.4 billion of net income
  • As of December 31, 2021, Brookfield had $92 billion of capital available to deploy into new investments
  • Declared an 8% increase in the quarterly dividend to US$0.14 per share

The week ending February 4, 2022

As the saying goes, fool me once….

Is the rise of the market this week a genuine rise or a bear market rally (a brief rise in stock prices when the overall market has been falling)?

Charlie Brown Kicking Football Video - Imfuture14

I find myself feeling like Charlie Brown trying to decide if Lucy will pull the ball away at the last second when he attempts to kick it. Charlie Brown knows Lucy will remove the football at the last moment but for some reason he hopes this time it will be different. I find myself in a similar predicament – has the market bottomed or is this a bear rally?

On Tuesday, after three consecutive days of upward movement by all four major North American indexes, I was very tempted to get back in the game and purchase a few shares. Microsoft (NASD:MSFT), Apple (NASD:AAPL) and now Alphabet (NASD:GOOGL or NASD:GOOG) had reported strong quarterly reports. All four indexes were rising, indicating a broad rally. The coast looked clear…. I was ready to try and kick the football.

Late Wednesday afternoon I was thinking about placing an order for Thursday when Meta (NASD:FB), formerly Facebook, had their quarterly earnings report. It disappointed analysts. It got crushed, dropping nearly 27%, wiping out more than USD$ 230 billion in market value.

Not content with wiping out a third of its own market value, Meta triggered a steep drop in other social media stalwarts Twitter (NYSE:TWIT), Pinterest (NYSE:PINS) and Snapchat (NYSE:SNAP) in after hours trading on Wednesday. I felt this sharp decline by some of the big names in the technology/high growth sector did not bode well for Thursday. So instead of trying to kick the football …. I decided to do nothing.

Sure enough, all four Indexes fell during Thursday’s trading session. For once, an investing hunch paid off. To conclude with the Charlie Brown metaphor, by sticking with my plan to see four days of broad upward movement in the market, I was able to avoid taking a run at the proverbial football, only to have it pulled away at the last second. This time. I’m sure the market will fool me again.😊

And now the four-day count of upward movement starts again. One down 3 to go.

Let’s see how the Indexes and portfolios did this past week…

Weekly Market Review

Monday: Looks like the January effect finally showed up. Better late than never. All four major North American Indexes were each up over 1% for the day.

In Canada, the Toronto Stock Exchange Composite Index (TSX) had its best day in almost 6 weeks, led by Technology shares which were up over 5% for the day, with Shopify (TSX:SHOP) up over 10%.

In the US, the Nasdaq Composite Index (Nasdaq) had its worst start of a year since 2008 and barely avoided its worst ever January. Thanks to a strong session today it finished the month down nearly 9%. The S&P 500 Index (S&P) had its worst January since 2009. Both the S&P and Dow Jones Industrial Average (DJIA) had their worst month since March 2020, when the pandemic started. Of the 11 major S&P sectors, all but the energy sector was down for January. So … a two-day rally to end the month. Let’s hope this continues going forward although I expect it to be a bumpy ride.

Tuesday: Although not as strong as Monday’s gains, once again all four Indexes ended the day in positive territory, for a third straight day. The TSX ended up the most at just over 1% which was enough to lift the TSX into the black for 2022. The energy sector was the big winner on both sides of the border as the price of oil is holding near seven-year highs. The energy sector component of the S&P Index is by far the best performing sector in the S&P, up 23% so far this year, compared to the rest of the S&P which is down approximately 5%.

Wednesday: And the beat goes on. For a fourth consecutive trading day, all four Indexes closed in positive territory. On the TSX, the financial and energy sectors more than offset a drop in the technology sector. In the US, the Dow Jones Industrial Average (DJIA), the S&P and the Nasdaq all rose nearly 1%, indicating a broad rally. The Indexes were lifted by a strong quarterly report from Alphabet. However, in an ominous sign, a few of the big social media companies released disappointing results after the market close. Traders will get their first chance to tell these companies what they think about those results on Thursday morning. If its anything like what happened to PayPal (NASD:PYPL), which fell nearly 25%, it won’t be a good day for those companies or the technology heavy Nasdaq, and to a lesser extent, the S&P.

Thursday: A sharp downdraft in the major social media companies spilled over to the technology sector in general, ending the four-day winning streak of all four of the Indexes. On the TSX, Shopify ended the day down over 8% and the technology sector was down almost 5%. South of the border, Meta, formerly Facebook, set a record for the biggest single day fall in value by an American company, falling more than 25% and losing over USD$ 200 billion of its market value. On its way down, Meta took other social media companies in the Communication Services sector with it. Even big technology companies Alphabet, Amazon, and Microsoft that had previously reported strong earnings got caught in the downdraft.

In a possible bit of foreshadowing for both the Bank of Canada and the US Federal Reserve, the Bank of England raised interest rates to .5% from .25%.

Friday: The TSX, the S&P and Nasdaq ended the day in the black while the DJIA ended slightly in the red. However, for the week, all four Indexes ended in positive territory.

In Canada, a rally by the Canadian technology sector, along with the energy and financial sectors, helped the TSX to its largest one week gain in 11 months.

In the US, a great earnings report by Amazon, causing its share price to soar and set the record for largest single day increase, jump started the day. Pinterest and Snap followed up with strong reports, indicating Meta’s slowing numbers were a Meta problem rather than a social media industry problem. As a result, technology companies rebounded from Thursday’s downdraft. Also on the move were energy companies which were buoyed by crude oil prices that hit a seven-year high.

 Weekly Portfolio Review

Last week I said I would be happy if one of the portfolios had a positive week. Well, ask and you shall receive. Lo and behold, not only do I get one portfolio in positive territory for the week, but all three finished in positive territory. Even better, all three beat the S&P and DJIA, with Portfolio 2 beating all four Indexes. If I’d known all I had to do was ask, I would have done it along time ago. OK, I wish it were that easy. 😊

Since all three portfolios are technology heavy, its no coincidence that when the technology heavy Nasdaq Index does well (it was the best performing Index of the four), the Portfolios do well. While being technology heavy has negatively impacted the Portfolios for the last two months, this past week it paid off. More weeks like last week, please. 😊

Weekly Portfolio & Index performance
Weekly Portfolio & Index performance for the week ended Feb. 4, 2022.

Companies on the Radar

Another quiet week on the hunt for great companies at a fair price. The decline in share prices since late 2021 has made several of the bigger companies more attractive for me. Since they are the same companies as they were a few months ago, but with a cheaper share price, they are a better value. And with Alphabet’s upcoming 20 for 1 stock split, its share price seems more reasonable. I know that 20 shares for $150 costs the same as 1 share for $3,000 but mentally it feels like I’m getting more when I get 20 shares for the same amount as 1 share. Ahhh, the psychology of investing. 😊

Otherwise, the same companies as in previous weeks remain on the radar with Alphabet replacing Visa (NYSE:V). Currently, I like the combination of stability, growth potential, and tailwinds each of these big names brings to the table. It doesn’t hurt that these four all have a dividend, even if it is less than 1% for the technology companies and less than 2% for Home Depot.

Portfolio Update

Portfolio 1

Portfolio 1 for the week ended February 4, 2022: UP Green Up Arrow, signifying a positive week

A strong earnings report from Alphabet, one of the mega technology companies, boosted Portfolio 1 this past week. Alphabet generated record revenues thanks to growth in search advertising, Google cloud, sales of their Pixel phones, and the continued monetizing of its YouTube business. Alphabet also announced a 20:1 stock split. The split will make Alphabet shares much easier for retail investors like me to buy shares. Alphabet is so dominate in multiple areas, that I consider it a Core holding of Portfolio 2 as well as across all three portfolios.

Other highlights were solid earnings report from Pinterest and Unity Software (NYSE:U). Pinterest revenues increased over 50% for the fiscal year while Unity’s revenue grew by 43% for their fiscal year. The only caution was both companies are still losing money but that is typical for high growth tech stocks.

The one disappointing earnings report was PayPal. They had a decent first quarter with revenue up 6% but missed its earnings per share target by $.01. Analysts don’t like misses, even if its by a penny. Payment volumes and net new active users were also down, and they anticipate lower numbers going forward. Analysts don’t like this type of news, so PayPal was punished, and its share price fell nearly 25% on Wednesday.

Lightspeed Commerce (TSX:LSPD) had a decent quarter, but the big news was founder Dax Dasilva resigned as CEO but will remain as Executive Chairman. Lightspeed president JP Chauvet was appointed CEO, assuming the role immediately. Chauvet joined Lightspeed in 2012 and was named President in 2016 so it should be a smooth transition.

As for the other companies in Portfolio 1 that reported last week, all had solid earnings reports. Nothing spectacular, the companies just keep putting up solid numbers.

Activity

No significant activity to report this week.

Dividends

Dividends Received this week for the following companies:

Companies followed by DRIP (Dividend Re-Investment Plan) indicate additional shares were purchased with the dividend. Any cash leftover was added to the cash balance.

Canadian $

Toronto-Dominion Bank (TSX:TD)

US $

No US$ dividends this past week.

Quarterly Reports

General Motors Co.

All currency listed in US dollars

Selected highlights from their fourth quarter 2021 financial results on February 1, 2022

Fourth quarter 2021 highlights

  • Net revenue of $33.6 billion compared to $37.5 billion in fourth quarter 2020
  • Net income of $1.7 billion compared to $2.8 billion in fourth quarter 2020
  • Net income margin of 5.2% compared to 7.6% in fourth quarter 2020
  • Diluted Earnings Per Share of $1.16 compared to $1.93 in fourth quarter 2020

2021 highlights

  • Net revenue of $127 billion compared to $122.5 billion in 2020
  • Net income attribute to shareholders of $10 billion compared to $6.4 in 2020
  • Net income margin increased to 7.9% from 5.2% in 2020
  • Diluted Earnings Per Share of $6.70 compared to $4.33 in 2020
  • Return on Invested Capital of 21.3% compared to 15.0% in 2020
  • Record 2021 EBIT-adjusted and EBIT-adjusted margin in a challenging semiconductor and supply chain environment

PayPal Holdings Inc

All currency listed in US dollars

Selected highlights from their fourth quarter 2021 financial results on February 1, 2022

Fourth quarter 2021 highlights

  • Revenue up 13% year-over-year to $6.92 billion
  • GAAP operating margin of 15.2%, declining .57%
  • GAAP EPS of $0.68, down 49%

2021 highlights

  • Revenue up 17% year-over-year to $25.4 billion
  • GAAP operating margin of 16.8%, up 1.47%
  • GAAP EPS of $3.52 down 1%
  • 48.9 million Net New Accounts added, bringing total active accounts to 426 million accounts, up 13%
  • 19.3 billion payment transactions, up 25%
  • Repurchased approximately 15.4 million shares of common stock, returning $3.4 billion to stockholders

Alphabet Inc.

All currency listed in US dollars

Selected highlights from their fourth quarter 2021 financial results on February 1, 2022

Fourth quarter 2021 (unaudited)

  • Fourth quarter revenues of $75 billion, up 32% year over year
  • Net income of $20.6 billion, up almost 35% year over year
  • Earnings per share of $30.69, up almost 38% year over year

2021 highlights (unaudited)

  • Revenues of $257 billion, up 41% year over year
  • Net income of $76 billion, up almost 89% year over year
  • Monthly Average Revenue Per User (ARPU) grew to approximately $290 compared to approximately $180 in the same quarter last year

Lightspeed Commerce Inc

All currency listed in USD dollars

Selected highlights from their Third quarter 2022 financial results on February 2, 2022

  • Third quarter revenue grew 165% YoY to $152.7M
  • Subscription and transaction-based revenue grew 175% year-over-year to $144.4 million
  • ARPU up to $ 290 million compared to $ 180 million in third quarter 2021
  • Net loss of ($65.5) million as compared to a net loss of ($42.7) million

BCE Inc.

All currency listed in CAD dollars

Selected highlights from their Fourth quarter 2021 financial results on February 3, 2022

  • Fourth quarter 2021 revenue of $6.2 billion, up 1.8% from Fourth quarter 2020’s $6.1 billion
  • Net earnings in Q4 declined 29.4% to $658 million
  • Cash flows from operating activities in fourth quarter 2021 were $1,743 million, up 6.9% from Q4 2020
  • Increase annual common share dividend 5.1%, or $0.18 per share, to $3.68 annually

Skyworks Solutions Inc

All currency listed in US dollars

Selected highlights from their First quarter 2022 financial results on February 3, 2022

  • Record Revenue of $1.510 Billion, up 15% Sequentially
  • Posts Earnings Per Share of $2.40
  • Declared a cash dividend of $0.56 per share of the Company’s common stock

Unity Software Inc

All currency listed in US dollars

Selected highlights from their Fourth quarter 2021 financial results on February 3, 2022

Fourth quarter 2021 highlights

  • Revenue was $315.9 million, up from $220.3 million in fourth quarter 2020
  • Loss from operations was $144.8 million, or 46% of revenue, compared to loss from operations of $80.8 million, or 37% of revenue, in the fourth quarter of 2020. These results were impacted by an increase in stock-based compensation expenses.
  • Basic and diluted net loss per share was $0.56, compared to basic and diluted net loss per share of $0.31 in the fourth quarter of 2020
  • More than 1,000 customers spending more than $100,000 each last quarter

2021 highlights

  • Revenue was $1.1 billion, an increase of 44% from 2020
  • Loss from operations was $531.7 million, or 48% of revenue, compared to loss from operations of $274.8 million, or 36% of revenue, in 2020. Results were impacted by an increase in stock-based compensation expense, as well as a charge of $49.8 million related to the termination of a lease agreement.
  • Basic and diluted net loss per share was $1.89, compared to basic and diluted net loss per share of $1.66 in 2020.
  • 140% net retention rate

Pinterest Inc.

All currency listed in US dollars

Selected highlights from their Fourth quarter 2021 financial results on February 3, 2022

Fourth quarter 2021 highlights

  • Q4 revenue grew 20% year over year to $847 million.
  • GAAP net income was $175 million for Q4, including a $49 million one-time share-based compensation charge related to our co-founder’s transition and a $25 million non-cash charitable contribution.
  • Revenue was up 16% compared to the same period last year
  • Net Income was down 16% compared to the same period last year

2021 highlights

  • Revenue grew 52% year over year to $2,578 million
  • GAAP net income was $316 million for 2021.

Portfolio 2

Portfolio 2 for the week ended February 4, 2022: UP Green Up Arrow, signifying a positive week

Portfolio 2 has been the most robust portfolio since I started this blog, so I’m not surprised it was the best performer of the portfolios this past week. Almost 75% of the stocks in the portfolio had a good week. The only surprise was Microsoft’s share price finished just below where it started the week. I thought Microsoft would have had a good week, following on the upward momentum from the previous week, but the Meta downdraft put an end to that momentum. Fortunately, Microsoft is back on the rise again, along with the rest of the companies in Portfolio 2.

Activity

No significant activity to report this week.

Dividends

Dividends Received this week for the following companies:

Companies followed by DRIP (Dividend Re-Investment Plan) indicate additional shares were purchased with the dividend. Any cash leftover was added to the cash balance.

Canadian $

TC Energy Corp (TSX:TRP)

US $

No US$ dividends this past week.

Quarterly Reports

Brookfield Energy Partners

All currency listed in CAD dollars

Selected highlights from their Fourth quarter 2022 financial results on February 4, 2022

Fourth 2021 quarter highlights

  • Revenues of $1,091 million, compared to $ 952 million for the same period in the previous year
  • Net income of $33 million, compared to a net loss of $5 million in the same period in the previous year

2021 highlights

  • Funds From Operations of $934 million or $1.45 per Unit, a 10% increase from the prior year
  • Declared a quarterly dividend increase of 5%, to $0.32 per share
  • Revenues of $4,096 million, compared to $ 3,810 million in the previous year
  • Net loss of $66 million, compared to a net loss of $45 million in the previous year
  • Diversified the business with the first investment in offshore wind, and expanded the hydroelectric and battery storage portfolios
  • Ended the year with over $4 billion of available liquidity and access to significant sovereign and institutional capital providing enhanced flexibility for future growth

Portfolio 3

Portfolio 3 for the week ended February 4, 2022: UP Green Up Arrow, signifying a positive week

The way the week started I thought technology sector heavy Portfolio 3 would get its first winning week of the year. Then the Meta earning report came out and the portfolio fell nearly 10% when Shopify got caught in the technology sector beatdown caused by PayPal’s and Meta’s respective earning reports. Fortunately, the market rallied on Friday to end the week with the first positive week of 2022.

Activity

No significant activity to report this week.

Dividends

Dividends Received this week for the following companies:

Companies followed by DRIP (Dividend Re-Investment Plan) indicate additional shares were purchased with the dividend. Any cash leftover was added to the cash balance.

Canadian $

Toronto-Dominion Bank (TSX:TD)

US $

No US$ dividends this past week.

Quarterly Reports

Unity Software Inc

All currency listed in US dollars

Selected highlights from their Fourth quarter 2022 financial results on February 3, 2022

Fourth 2021 quarter highlights

  • Revenue was $315.9 million, up from $220.3 million in fourth quarter 2020
  • Loss from operations was $144.8 million, or 46% of revenue, compared to loss from operations of $80.8 million, or 37% of revenue, in the fourth quarter of 2020. These results were impacted by an increase in stock-based compensation expenses.
  • Basic and diluted net loss per share was $0.56, compared to basic and diluted net loss per share of $0.31 in the fourth quarter of 2020
  • More than 1,000 customers spending more than $100,000 each last quarter

2021 highlights

  • Revenue was $1.1 billion, an increase of 44% from 2020
  • Loss from operations was $531.7 million, or 48% of revenue, compared to loss from operations of $274.8 million, or 36% of revenue, in 2020. Results were impacted by an increase in stock-based compensation expense, as well as a charge of $49.8 million related to the termination of a lease agreement.
  • Basic and diluted net loss per share was $1.89, compared to basic and diluted net loss per share of $1.66 in 2020.
  • 140% net retention rate

Brookfield Energy Partners

All currency listed in CAD dollars

Selected highlights from their Fourth quarter 2022 financial results on February 4, 2022

Fourth 2021 quarter highlights

  • Revenues of $1,091 million, compared to $ 952 million for the same period in the previous year
  • Net income of $33 million, compared to a net loss of $5 million in the same period in the previous year

2021 highlights

  • Funds From Operations of $934 million or $1.45 per Unit, a 10% increase from the prior year
  • Declared a quarterly dividend increase of 5%, to $0.32 per share
  • Revenues of $4,096 million, compared to $ 3,810 million in the previous year
  • Net loss of $66 million, compared to a net loss of $45 million in the previous year
  • Diversified the business with the first investment in offshore wind, and expanded the hydroelectric and battery storage portfolios
  • Ended the year with over $4 billion of available liquidity and access to significant sovereign and institutional capital providing enhanced flexibility for future growth


Market Corrections

Correction: No, not something that is done to correct a mistake. I’m referring to a stock market correction. Since one is currently going on it seemed likely a timely subject.

Corrections

A correction is when an Index, such as the S&P 500 Index, falls 10% – 20% from its latest high, over a few weeks or even months. This can even happen to the share price of your favourite company. Corrections are quite normal and can last a few weeks to a few months while the market consolidates before it resumes moving higher. A drop of more than 20% from its record closing high is considered a bear market.

While a correction occurs over weeks or months, when the market undergoes a surprising and sudden drop of 20+% in one or two days it is often referred to as crash. A high-speed correction, if you will. One of the leading contributors to a stock market crash is emotions, such as panic and fear. When there is uncertainty in the market and the share prices start to suddenly go down, fear and panic can set in, and investors start selling their shares in an attempt to preserve cash.

A market crash is what happened at the onset of the Covid-19 pandemic. It was a big gulp moment when I checked the portfolios and saw they each were down between 20% – 30%. I was tempted to sell but realized there was nothing I could do, other than lock in losses.

More recently, the Nasdaq Index went through a correction in January as it fell over 12% from its mid-November, all time high. When an Index falls, that means it underlying companies have seen their respective share prices fall, some more than others. Unfortunately for me, all three portfolios include several Nasdaq listed companies, so each Portfolio went through its own correction. Some worse than others. ☹

Causes

Corrections are usually caused by one of two things. The first thing is bad news, especially if its unexpected. Current examples of sources of potentially bad news include: the ongoing impact of Covid-19; concerns of high inflation leading to higher interest rates; and the current tensions between NATO countries and Russia over Ukraine. The other primary cause of a correction is when stock prices climb to high, too quickly and get well ahead of their underlying value. People believe the price will rise indefinitely, until it doesn’t. And then the share price ‘corrects’.

What to do

When a correction or crash occurs, I take a breather from investing. I remind myself there have been numerous corrections and the markets have always recovered and gone on to establish new all-time highs. I’ve learned to stay calm and keep my emotions in check.

As you can see in the chart below, over the last 10 years all four Indexes have had their ups and downs put have always gone higher. Even after the Covid-19 market crash in March 2020 all four Indexes have gone on to establish new all-time highs. You can also see why I went big into the technology companies which largely reside on the Nasdaq exchange. 😊

During this recent correction I’ve taken the opportunity to reassess the portfolios to ensure they are meeting their objectives. In the case of Portfolio 1, I’m leaning towards getting out of some of the higher risk, small cap companies because they tend to fall the hardest and are among the last to start moving upward. Portfolio 2 is weathering this downturn fine. There are one or two companies I’m considering selling but I’m in no rush to sell them. Portfolio 3 is too concentrated in one particular stock but that is largely because the share price has gone up so much relative to the other companies in the portfolio. As problems go, this isn’t the worst one to have.

As for buying and selling stocks, hopefully you have not invested any money into the stock market that you anticipate needing in the next year or two. If you did, there is nothing you can do but hope for a quick recovery before you need the money. Unless you absolutely need the cash, what you should not do is sell your shares as all that will do is lock in a loss and/or cause you to miss out on the gains when the market starts heading up again.

If you don’t have any cash to invest, resist the urge to do something. In this case, the best thing to do is do nothing. The market eventually starts heading upward and you want to be invested to catch the gains from the up lift.

While a drop of up to 10% or more appears scary, it does present buying opportunities since stocks are ‘on sale’. However, you need to have the stomach, the right mindset, and available cash, to invest in stocks during a falling market. This would be the classic ‘buy low’.

if you’ve got investing cash set aside for a market drawdown, take advantage of the ‘sale’ and strategically deploy your cash. Consider purchasing additional shares in your highest conviction companies you already own (think of this as dollar cost averaging) or make an initial purchase in a company that you are confident will ride out the storm and will outperform when the market rises. You will probably miss out on the exact market bottom (don’t try to time the market), but you don’t want to miss out on the market turnaround. While getting the maximum discount would be great, getting a 10% – 25% discount on great companies can really boost a portfolio.

I know what you’re thinking – why not simply sell your stock when the market first starts to fall and buy back in when it starts heading back up. This would be market timing and rarely works since no one can predict what will happen in the future and what the market will do. What typically happens is you sell your stocks and get back in after the market has returned to its previous levels. More often than not, investors get back in at higher prices so all they’ve done is cost themselves transaction fees and potential tax implications. I know, I tried this with the Ethereum cryptocurrency, and so far, its an unforced error and has not worked out so well.

Remember, while stocks can fall quickly, most stocks go up more than they go down. During a correction the best thing you can do is stick to your investment plan and don’t let panic cause you to make decisions you’ll regret.