Items that may only interest or educate me ….
The Fed raises the US interest rate again, Canadian economic data, Jobs and more jobs, Another US regional bank bites the dust, What is the Consumer Sentiment Index (CSI)?
US interest rate rises
In a unanimous decision, the US Federal Reserve’s (Fed) Federal Open Market Committee (FOMC) announced an increase to the US benchmark interest rate of 0.25%, upping the rate to 5.25%. This was the tenth consecutive rate increase since March 2022, pushing the rate to its highest level since 2007. I thought the market would rally on the announcement but once again I proved I am not very good at predicting the markets direction. ☹
The FOMC also said it will, “take into account the cumulative tightening of monetary policy, the lags with which monetary policy affects economic activity and inflation, and economic and financial developments” (a long way of saying they will see how the cumulative increases affect the economy). This is a notable difference from their last announcement in March when they anticipated additional increases may be needed. While this does not mean there will not be an increase, it also does not mean there will be an increase. One thing we do know is there is not a plan to lower the rate any time soon.
The hike was expected as the Fed walks a tightrope between bringing down inflation and the risk of re-igniting the banking crisis. On top of that, they must consider the possibility of a US debt default. If the Fed does pause rate hikes, how long will the pause last? And will the next change in the rate be up or down? More questions for investors to ponder. 😊 However, I suspect investors will now be watching the US debt limit crisis. An avoidable situation that could trigger a recession in the US and eliminate millions of jobs. Stay tuned.
Canadian economic data
Statistics Canada announced Canada’s trade balance for March came in with a C$972 million surplus, easily beating expectations of a C$200 million surplus. Canada went from a trade deficit in February to a surplus in March thanks to a minor decrease in exports (0.7%) and a larger drop in imports (2.9%). On a monthly basis, exports of forestry products (down 6.4) and energy products (down 5.9%) saw the biggest drops, while export of aircraft transportation equipment was up 30.8%. In imports, the biggest declines were consumer goods (down 11%) and metal ores (down 13.9%), while metal and non-metallic mineral products imports grew by 6.1%. On a yearly basis, total exports were down 1.3% and imports were flat.
On a yearly basis, global demand for Canadian products and raw materials has declined. A drop in imports would suggest a drop in domestic demand as well. Both can be seen as signs of a slowing Canadian economy, a necessary evil to get inflation down to the Bank of Canada’s (BoC) target of 2%.
Jobs and more jobs data
While the economy may be slowing, the jobs market remains robust. Another Statistics Canada report showed Canada’s employment rate in April grew 0.2% compared to March. On a yearly basis, employment grew by 2.1%. Meanwhile, the unemployment rate has remained unchanged at 5.0% since December 2022. Both monthly numbers were better than analysts had forecast. Average hourly wages continued to rise, up 5.2% on an annual basis, the same level of growth as in March. The bulk of employment was in part time work.
In the USA, the US Department of Labor’s April jobs report showed unemployment dropped to 3.4%, a 53-year low, indicating the US job market is barely slowing down, despite the rising interest rate. The average hourly wage also rose 0.5% from March and 4.4% on an annual basis. A strong labour market and growing wage gains are key drivers of inflation. As long as jobs and wage growth remain robust the Fed is likely to keep the US interest rate at its current 5.25%, or higher, as they battle to get inflation down to their 2% target.
Another US regional bank bites the dust
First Republic (NYSE: FRC) managed to survive the banking crisis of March thanks to a US$30 billion infusion from a few of the largest American banks, but that did not make its customers feel any safer. When it disclosed results for the first quarter last week, investors discovered that First Republic customers had pulled $72 billion in deposits during that period, more than a 40% drop, and the bank’s stock was down more than 97% in 2023. Last weekend, First Republic became the fourth major US bank to fail in two months and the largest bank failure since the 2008 financial crisis.
The US Federal Deposit Insurance Corp (FDIC) seized First Republic Monday morning and sold the bulk of the bank’s operations to JPMorgan Chase (NYSE: JPM) for US$10.6 billion. JPMorgan beat out PNC Financial Services Group (NYSE: PNC), and Citizens Financial Group Inc (NYSE: CFG) in an auction put on by US regulators. On Monday, First Republic’s 84 offices reopened as JPMorgan Chase branches. As well as the office space, JPMorgan assumed roughly $173 billion in loans, $30 billion in securities, $92 billion in deposits and First Republic’s list of wealthy clients. In addition, JPMorgan plans to return the $30 billion lent to First Republic back in March.
JPMorgan plans to share both losses and gains from First Republic’s single family, residential and commercial loans with the FDIC. That is good news for the FDIC since it cost them US$13 billion from their Deposit Insurance Fund to cover depositors. As for corporate debtors and preferred stockholders, they are out of luck.
This is the latest, and hopefully last, in government brokered acquisitions of bigger banks absorbing smaller banks that had failed (First Citizens snatched the scraps of SVB) or were failing (UBS (NYSE: UBS) took over rival Credit Suisse at the behest of the Swiss government) these past few months. Hopefully, this puts to rest the concerns over the US banking system, but I doubt it.
What is the Consumer Sentiment Index (CSI)?
In Canada, the CSI rose from 47.28 points in March, to 49.24 points in April, suggesting Canadians are slightly pessimistic but their feelings towards the economy and their situation are improving. Meanwhile in the US, the CSI for April remained unchanged at 63.5, suggesting Americans remain optimistic about the economy and their personal financial situation.
You may be wondering, what those numbers mean and how did I come to that conclusion. Well let me tell you. The previous two weeks I have talked about the Volatility Index (VIX), and the Consumer Confidence Index (CCI). This week I will talk about another tool that could help provide a sense of where the markets may be heading – the Consumer Sentiment Index (CSI).
The CSI is a measure of how confident or optimistic consumers feel about the economy and their personal finances. It is based on surveys of consumers and their attitudes towards various economic factors, such as job opportunities, income, and spending habits. The CSI is measured on a scale of 0 to 100. A reading above 50 generally indicates that consumers are feeling optimistic about the economy and their personal finances, while a reading below 50 suggests a more pessimistic outlook.
The CSI is a useful tool for investors because it can provide insight into consumer behavior, which can have a significant impact on the overall economy and the stock market. When consumers are feeling optimistic, they tend to spend more money, which can lead to increased economic growth and corporate profits. On the other hand, when consumers are feeling pessimistic, they tend to save their money and spend less, which can slow down economic growth and negatively affect stock market performance.
Both Canada and the USA have their own CSI measurements. In Canada, the CSI is published by the Conference Board of Canada and is known as the Index of Consumer Confidence. While in the US, the CSI is published by the University of Michigan and is known as the University of Michigan Consumer Sentiment Index.
When I first started looking into the CCI and CSI, I thought these were essentially the same thing – measures of consumer attitudes towards the economy. It turns out there are some subtle, yet key differences.
One major difference is that the CSI is typically based on a smaller sample size of consumers. The University of Michigan surveys about 500 households each month to produce their CSI, while the Conference Board, which publishes the CCI in both Canada and the US, surveys thousands of households each month.
Another difference is that the CSI asks consumers about their overall feelings towards the current economic situation, their personal finances, and their spending plans. The CCI is more forward looking and asks consumers about their perceptions of current business and job market conditions, as well as their expectations for future economic growth.
Despite these slight differences, both indexes can be useful as indicators of consumer behavior, spending patterns, and attitudes towards the economy. Together they provide a good idea of what people are thinking and feeling about the economy.
In April, all four major North American indexes gained ground (one just barely). Let’s see if that upward momentum carried over into the first week of May ….
Weekly Market Review
Monday: the indexes started the week with a whimper as all four major North American indexes ended slightly lower. Most investors remained on the sidelines, waiting for the Fed’s latest update. Its not so much the expected 0.25% increase, its what they say, if anything, about a future pause in the increases. Oil prices fell on soft demand out of China, causing the Energy sectors in both countries to end in the red.
In Canada, on the Toronto Stock Exchange Composite Index (TSX), Consumer Cyclicals and Industrials gained the most of the Canadian sectors. Considering the TSX lost ground today, I was surprised to see only three sectors ended in the red: Energy, Technology and Financials. Those three offset the other seven.
In the USA, JPMorgan Chase & Co acquired failing First Republic Bank to avoid re-igniting the banking crisis and calming investors’ nerves. In trading on the S&P 500 Index (S&P), the Dow Jones Industrial Average (DJIA), and the Nasdaq Composite Index (Nasdaq), the Healthcare and Industrials sectors gained the most, while Energy and Consumer Cyclicals had the biggest drops.
Tuesday: A few financial issues caused all four indexes to end lower. Investors continued to wait and see if the Fed will raise interest rates when they finish their two-day meeting tomorrow. As well, there are concerns the banking crisis is not over after two regional banks wobbled. Investors are getting worried about the possibility the US could default on its debts due to political brinkmanship. That would not be good. Oil prices fell over 5% today on concerns higher interest rates would lead to lower demand.
In Canada, the drop in oil prices led to a fall in the share price of many of the Energy companies, dragging the TSX down. In trading, Basic Materials (miners and fertilizer manufacturers) and Technology were the only Canadian sectors to end higher, while Energy and Financials fell the farthest.
In the US, investors are concerned about higher borrowing costs and how much higher the Fed was prepared to go. In trading, it was a day of across-the-board losses in the American sectors. Consumer Cyclicals and Consumer Staples declined the least, and not surprisingly, Energy and Financials had the worst day.
Wednesday: All four indexes were slightly higher for most of the day. In the afternoon, the Fed announced an expected 0.25% increase to the US benchmark rate and said future hikes would be dependent on the cumulative impact of previous rate hikes to the US economy. However, the indexes took a nosedive when the Fed commented there was no plan for cutting the US benchmark rate. Oil prices continued their fall due to the higher interest rate.
In Canada, the TSX was dragged down by falling oil prices and the Fed declining to give a timeline for lowering the US interest rate. In the Canadian market, the Utilities and Healthcare sectors were the only sectors to end higher, while Consumer Cyclicals and Consumer Staples had the biggest drop.
In the US, all three indexes dropped into the red after the Fed’s said it was too early to say that was the end of the increases. In the American markets, Healthcare and Telecommunications Services were the only two sectors to advance, while the Energy and Financials sectors had the biggest decline.
Thursday: More turmoil in US regional banks caused all four indexes to end lower. PacWest Bancorp’s (NASD: PACW) efforts to explore its options re-ignited fears of a deepening banking crisis in the US. The latest increase to the US lending rate is not going to make it any easy for wobbling regional banks.
In Canada, the TSX closed at a four-week low on lower oil prices and Canadian banks that are getting dragged down by US banking concerns. On Bay Street, the Technology and Basic Materials sectors were the only sectors to advance, while the declining sectors were led lower by Healthcare and Consumer Cyclicals.
In the USA, the American indexes ended down as fears another regional bank could fail fuels concerns of a deeper banking crisis. As well, the latest interest rate hike has raised concerns of a recession for the world’s largest economy. On Wall Street, the defensive Utilities sector was the only one to post a gain, while Financials and Industrials led the rest of the sectors lower.
Friday: All four indexes soared higher on the final day of the week. The big news was employment numbers came in better than expected in both countries, but the growth rates are gradually declining. The US banking industry also saw a rebound after coming under pressure the last few days. Oil prices rebounded after falling most of the week on rumours of a supply cut at the next meeting of oil producing countries (OPEC+) in June.
In Canada, positive Canadian corporate earning reports along with bullish forecasts, and higher oil prices offset concerns about the ongoing US banking crisis, pushing the TSX into positive territory today. On the trading floor, all Canadian sectors ended higher, led by the Technology and Consumer Cyclicals sectors, and trailed by Telecommunications Services and Consumer Staples.
In the US, a solid earnings report from Apple (NASD: AAPL) yesterday jumpstarted the indexes, and combined with a rebound in US regional bank stocks and a strong jobs report to push all three indexes into higher ground. It was a day of broad-based gains, led higher by Energy and Financials. Defensive sectors Consumer Staples and Utilities trailed the pack but still ended higher.
Weekly Market and Portfolio Review
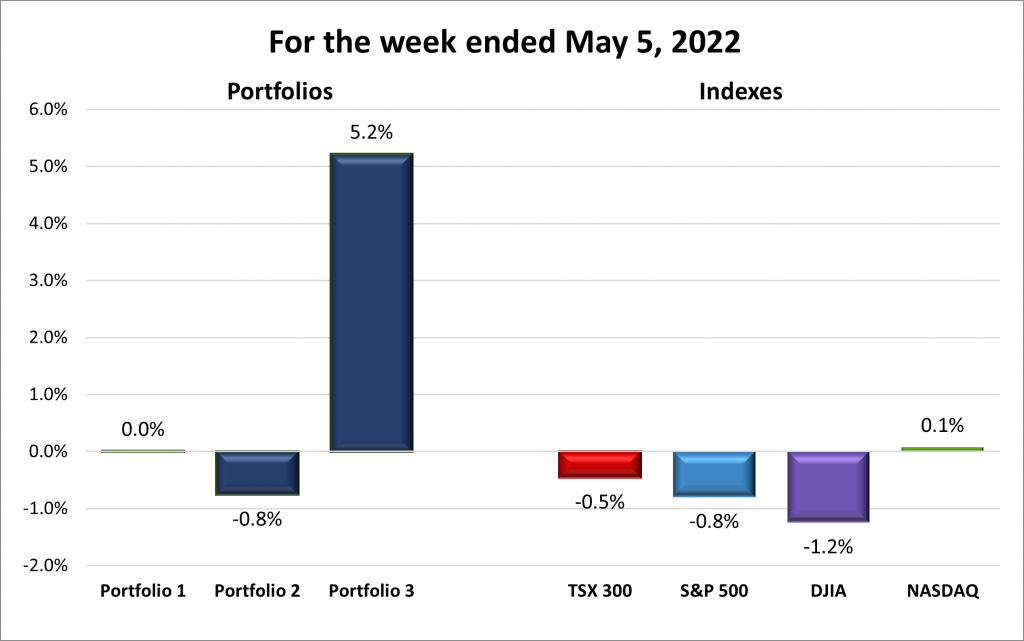
For the week, the TSX (SPTSX) fell 0.5%, the S&P 500 (SPX) dropped 0.8%, the DJIA (INDU) tumbled 1.2% and the Nasdaq (CCMP) rose 0.1%.
![]()
All four indexes ended lower the first four days of the week before a strong rally on Friday, as seen in the above chart. The Fed’s interest rate hike, and faltering US regional banks both played a roll in dragging the indexes down at the start of the week. They all then reversed course after a strong Apple earnings report and positive jobs reports in both countries sparked a rally late in the week that nudged the Nasdaq into the green. The S&P and DJIA staged a late rally, but it was not enough to offset the downturn caused by renewed US regional banking concerns and the interest rate hike. In the TSX, a sharp jump by Shopify and a late rise in oil prices raised the TSX but not enough to break into the win column.
![]()
![]() I am giving the Portfolios a bull and a bear rating for this week because its hard to give a bear rating when Portfolio 3 had a stellar week, as shown below.
I am giving the Portfolios a bull and a bear rating for this week because its hard to give a bear rating when Portfolio 3 had a stellar week, as shown below.
If it were not for Shopify (TSX: SHOP), I am sure all three Portfolios would have ended within 1% of the breakeven bar. As it was, a 25+% increase in one of the largest holdings in Portfolio 3 was more than enough to propel it to the top performer position this past week. In what was a mostly a down week, Portfolio 1 was flat thanks to a late surge by Apple. Bringing up the rear, Portfolio 2 reflected the overall direction of the market this past week.
I hope the momentum at the end of this week continues into next week and the indexes and Portfolios all return to their winning ways. More of 5+% increases by the Portfolios would be even better. 😊
Companies on the Radar

Airbnb left the Radar List for Portfolio 2, while Costco joined Portfolio 1. Otherwise, no changes to the list this past week.
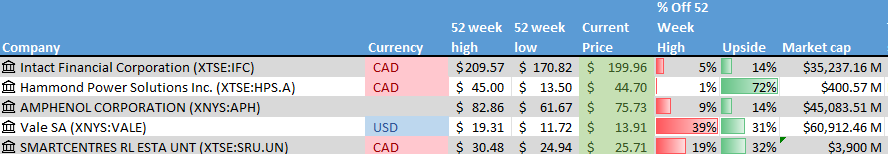
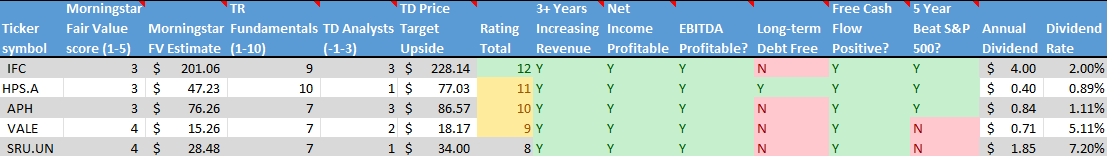
- Intact Financial (TSX: IFC): A Canadian mid size insurance company supplying home, car and business insurance in Canada, the US, and the UK.
- Hammond Power Solutions (TSX: HPS.A): A small cap Canadian company manufacturing transformers used throughout the world in a wide variety of industries.
- Amphenol: (NYSE: APH) Producer of a high-tech interconnect, sensor, and antenna solutions for the automotive, aerospace, industrial and various technology industries.
- Vale (NYSE: VALE): A global mining company that extracts various metals and rare earth elements such as nickel, cobalt, gold, copper, that are used in electric vehicles.
- Smartcentres Real Estate Investment Trust (TSX: SRU.UN): Owns and manages a number of income producing malls and retails spaces throughout Canada.
The Radar Check was last updated May 5, 2023.
Portfolio Update
Portfolio 1
Portfolio 1 for the week ended May 5, 2023: Flat ![]()
- Apple is facing another lawsuit. This one is for US$2 billion. The British based lawsuit claims Apple covered up a defective battery issue with a power management app to limit performance to hide the battery problems. Apple admits they had battery problems with a few iPhone 6s units which they fixed free of charge, but there were no issues with other models. On a personal note, I had one of those defective 6s units and they did fix it free of charge.
Apple surprised investors with record iPhone sales in South Asia, Latin America, and the Middle East. Apples marketing efforts in those regions is starting to pay off. - Alphabet (NASD: GOOGL) and Microsoft (NASD: MSFT) met with President Biden and other top US government officials to discuss the risks and guardrails of Artificial Intelligence (AI). The leaders of the tech companies were told they have a “legal responsibility” to ensure the safety of their AI products. However, the government is open to enacting new regulations and legislation on AI.
- General Motors (NYSE: GM) announced the end of their popular Chevrolet Bolt electric vehicle (EV). Despite an increase in sales of 50,000 units in 2022 and plans to build 70,000 more in 2023, the Bolt is being discontinued because it has become dated as far as EVs are concerned.
- At the ‘Woodstock for Capitalists’ Berkshire Hathaway (NYSE: BRK.B), chairman Warren Buffet said he could not imagine the US government allowing the US to default on its debt because it risked putting the global financial system “into turmoil.”
Activity
Bought: Costco (NASD: COST) – This is one of the few times I bought shares in a company without going through my full checklist, but I saw a dip in Costco and bought a few shares. Whenever I go to Costco and see a packed parking lot with masses of people throughout the warehouse, I always wonder why I do not own shares in Costco. The company is an international chain of warehouses for members only. It provides quality, brand-name and private label merchandise at substantially lower prices than found at other sources. It is a strong defensive stock with a solid record of revenue, income, and eps growth. Now when I go to Costco, I will probably wonder why I do not own more shares. 😊
Dividends
Dividends Received this week for the following companies:
Companies followed by DRIP (Dividend Re-Investment Plan) indicate additional shares were purchased with the dividend. Any cash leftover was added to the cash balance.
Canadian $
Toronto-Dominion Bank (TSX: TD) DRIP
Bank of Nova Scotia (TSX: BNS) DRIP
US $
No US$ dividends this past week.
Quarterly Reports
Cargojet Inc.
All currency listed in millions of Canadian dollars, except earnings per share.
Selected highlights from their first quarter 2023 financial results on May 1, 2023
- Revenue of $231.9 for the three months ended March 31, compared to $233.6 for the same period in 2022. A decrease of less than 1%.
- Net income of $30.5 for the three months ended March 31, compared to net loss of $56.4 in the same period in 2022.
- Diluted earnings per ordinary share of $1.67 for the three months ended March 31, compared to a loss of $3.26 per share for the same period in 2022.
TMX Group Limited
All currency listed in millions of Canadian dollars, except earnings per share.
Selected highlights from their first quarter 2023 financial results on May 5, 2023
- Revenue of $299.1 for the three months ended March 31, compared to $287.4 for the same period in 2022. An increase of over 4%.
- Net income of $89.0 for the three months ended March 31, compared to net income of $267.4 in the same period in 2022.
- Diluted earnings per ordinary share of $1.59 for the three months ended March 31, compared to earnings of $4.75 per share for the same period in 2022.
Lattice Semiconductor Corporation
All currency listed in thousands of US dollars, except earnings per share.
Selected highlights from their first quarter 2023 financial results on May 1, 2023
- Revenue of $184,310 for the three months ended March 31, compared to $150,515 for the same period in 2022. An increase of over 22%.
- Net income of $55,923 for the three months ended March 31, compared to net income of $36,078 in the same period in 2022.
- Diluted earnings per ordinary share of $0.40 for the three months ended March 31, compared to earnings of $0.26 per share for the same period in 2022.
Upwork Inc.
All currency listed in thousands of US dollars, except earnings per share.
Selected highlights from their first quarter 2023 financial results on May 3, 2023
- Revenue of $160,858 for the three months ended March 31, compared to $141,337 for the same period in 2022. An increase of almost 14%.
- Net income of $17,167 for the three months ended March 31, compared to net loss of $24,738 in the same period in 2022.
- Diluted loss per ordinary share of $0.15 for the three months ended March 31, compared to a loss of $0.19 per share for the same period in 2022.
Andlauer Healthcare Group Inc.
All currency listed in thousands of Canadian dollars, except earnings per share.
Selected highlights from their first quarter 2023 financial results on May 3, 2023
- Revenue of $164,774 for the three months ended March 31, compared to $148,351 for the same period in 2022. An increase of over 11%.
- Net income of $16,528 for the three months ended March 31, compared to net income of $16,471 in the same period in 2022.
- Diluted earnings per ordinary share of $0.39 for the three months ended March 31, compared to earnings of $0.39 per share for the same period in 2022.
Apple Inc.
All currency listed in millions of US dollars, except earnings per share.
Selected highlights from their second quarter 2023 financial results on May 4, 2023
- Revenue of $94,836 for the three months ended March 31, compared to $97,278 for the same period in 2022. A decrease of over 2%.
- Net income of $24,160 for the three months ended March 31, compared to net income of $25,010 in the same period in 2022.
- Diluted earnings per ordinary share of $1.52 for the three months ended March 31, compared to earnings of $1.52 per share for the same period in 2022.
- Revenue of $211,990 for the six months ended June 30, compared to $221,223 for the same period in 2022. A decrease of over 4%.
- Net earnings of $54,158 for the six months ended June 30, compared to net earnings of $59,640 in the same period in 2021.
- Diluted earnings per ordinary share of $3.41 for the six months ended June 30, compared to earnings of $3.62 per share for the same period in 2022.
Telus Corporation
All currency listed in millions of Canadian dollars, except earnings per share.
Selected highlights from their first quarter 2023 financial results on May 5, 2023
- Revenue of $4,964 for the three months ended March 31, compared to $4,282 for the same period in 2022. An increase of almost 17%.
- Net income of $224 for the three months ended March 31, compared to net income of $404 in the same period in 2022.
- Diluted earnings per ordinary share of $0.15 for the three months ended March 31, compared to earnings of $0.28 per share for the same period in 2022.
Datadog, Inc.
All currency listed in thousands of US dollars, except earnings per share.
Selected highlights from their first quarter 2023 financial results on May 4, 2023
- Revenue of $481,714 for the three months ended March 31, compared to $363,030 for the same period in 2022. An increase of over 33%.
- Net loss of $2,086 for the three months ended March 31, compared to net income of $9,738 in the same period in 2022.
- Diluted loss per ordinary share of $0.08 for the three months ended March 31, compared to earnings of $0.03 per share for the same period in 2022.
BCE Inc.
All currency listed in millions of Canadian dollars, except earnings per share.
Selected highlights from their first quarter 2023 financial results on May 4, 2023
- Revenue of $6,054 for the three months ended March 31, compared to $5,850 for the same period in 2022. An increase of over 3%.
- Net income of $788 for the three months ended March 31, compared to net income of $934 in the same period in 2022.
- Diluted earnings per ordinary share of $0.79 for the three months ended March 31, compared to earnings of $0.96 per share for the same period in 2022.
Ferrari N.V.
All currency listed in thousands of Euros, except earnings per share.
Selected highlights from their first quarter 2023 financial results on May 4, 2023
- Revenue of €1,429,006 for the three months ended March 31, compared to €1,185,982 for the same period in 2022. An increase of over 20%.
- Net income of €296,909 for the three months ended March 31, compared to net income of €239,393 in the same period in 2022.
- Diluted earnings per ordinary share of €1.62 for the three months ended March 31, compared to earnings of €1.29 per share for the same period in 2022.
FuboTV Inc.
All currency listed in thousands of US dollars, except earnings per share.
Selected highlights from their first quarter 2023 financial results on May 5, 2023
- Revenue of $324,374 for the three months ended March 31, compared to $242,320 for the same period in 2022. An increase of almost 34%.
- Net loss of $83,368 for the three months ended March 31, compared to a net loss of $128,363 in the same period in 2022.
- Diluted loss per ordinary share of $0.37 for the three months ended March 31, compared to a loss of $0.89 per share for the same period in 2022.
Portfolio 2
Portfolio 2 for the week ended May 5, 2023: DOWN ![]()
- In a silly game of tit for tat, the new district board which oversees Disney World, hand-picked by Florida Governor Ron DeSantis, is counter suing Disney (NYSE: DIS). The board claims that because they were sued, they have no choice but to respond in kind. I can think of better ways to spend taxpayer dollars.
- Canadian Natural Resources (TSX: CNQ) said if the price of oil continues to fall or stays low it could cause the company to miss its getting down to its net debt target of $10 billion by the end of 2023. That is not good news since it would delay the company from returning 100% of free cash flow to shareholders (currently it returns 50%).
Activity
Bought: Airbnb (NASD: ABNB) – the company is founder led, basically started the short-term rental industry, and now dominates the travel stay industry. The company has a growing base of loyal fans because it provides an extra revenue stream for hosts, saves money for guests while potentially providing a better stay experience. As well as the standard Airbnb service, they have a high end luxury service (Airbnb Luxe) and recently created a hostel like edition (Airbnb Rooms). The company is growing revenues and earnings per share and has lots of cash on hand if needed.
Over the next year, I think tourism will increase as the world continues to come out of the pandemic restrictions, as evidenced by airlines showing growing demand. In the long term, there is still lots of room to expand and it should remain the dominant company in the Travel Services industry for many years to come.
Dividends
Dividends Received this week for the following companies:
Companies followed by DRIP (Dividend Re-Investment Plan) indicate additional shares were purchased with the dividend. Any cash leftover was added to the cash balance.
Canadian $
Bank of Nova Scotia (TSX: BNS) DRIP
US $
No US$ dividends this past week.
Quarterly Reports
Fortis Inc.
All currency listed in millions of Canadian dollars, except earnings per share.
Selected highlights from their first quarter 2023 financial results on May 3, 2023
- Revenue of $3,319 for the three months ended March 31, compared to $2,835 for the same period in 2022. An increase of over 17%.
- Net income of $484 for the three months ended March 31, compared to net income of $393 in the same period in 2022.
- Diluted earnings per ordinary share of $0.90 for the three months ended March 31, compared to earnings of $0.74 per share for the same period in 2022.
Canadian Natural Resources Limited
All currency listed in millions of Canadian dollars, except earnings per share.
Selected highlights from their first quarter 2023 financial results on May 4, 2023
- Revenue of $8,630 for the three months ended June 30, compared to $10,677 for the same period in 2022. A decrease of over 19%.
- Net income of $1,799 for the three months ended June 30, compared to net income of $3,101 in the same period in 2022.
- Diluted earnings per ordinary share of $1.62 for the three months ended June 30, compared to earnings of $2.63 per share for the same period in 2022.
Telus Corporation
All currency listed in millions of Canadian dollars, except earnings per share.
Selected highlights from their first quarter 2023 financial results on May 5, 2023
- Revenue of $4,964 for the three months ended March 31, compared to $4,282 for the same period in 2022. An increase of almost 17%.
- Net income of $224 for the three months ended March 31, compared to net income of $404 in the same period in 2022.
- Diluted earnings per ordinary share of $0.15 for the three months ended March 31, compared to earnings of $0.28 per share for the same period in 2022.
Brookfield Renewable Partners L.P.
All currency listed in millions of US dollars, except earnings per share.
Selected highlights from their first quarter 2023 financial results on May 5, 2023
- Revenue of $1,331 for the three months ended March 31, compared to $1,136 for the same period in 2022. An increase of over 17%.
- Net income of $177 for the three months ended March 31, compared to net income of $33 in the same period in 2022.
- Diluted loss per ordinary share of $0.09 for the three months ended March 31, compared to a loss of $0.16 per share for the same period in 2022.
Portfolio 3
Portfolio 3 for the week ended May 5, 2023: UP ![]()
- Shopify is getting out of the logistics business. Shopify will sell its logistics unit to Flexport in exchange for a 13% equity interest in Flexport, a private global freight forwarder. In addition, Shopify plans to reduce its headcount by another 20% as it seeks to focus solely on its core business – their ecommerce platform.
This is great as it will eliminate the distraction and costs of building out a logistics network. I was never big on Shopify’s attempt to compete with logistics king Amazon. But I give them credit for cutting their losses (a few billions were invested). And I was very happy to see the share price jump over 20% after the announcement. 😊 - TD Bank (TSX: TD) has terminated its acquisition of US regional bank First Horizon (NYSE: FHN). The reason provided was regulatory uncertainty, but I suspect TD is breathing a sigh of relief that they were able to get out of this deal given the problems in the US regional banking industry.
Activity
No significant activity to report this week.
Dividends
Dividends Received this week for the following companies:
Companies followed by DRIP (Dividend Re-Investment Plan) indicate additional shares were purchased with the dividend. Any cash leftover was added to the cash balance.
Canadian $
Toronto-Dominion Bank (TSX: TD)
US $
No US$ dividends this past week.
Quarterly Reports
Telus International Inc.
All currency listed in millions of US dollars, except earnings per share.
Selected highlights from their first quarter 2023 financial results on May 5, 2023
- Revenue of $686 for the three months ended March 31, compared to $599 for the same period in 2022. An increase of over 14%.
- Net income of $14 for the three months ended March 31, compared to net income of $34 in the same period in 2022.
- Diluted earnings per ordinary share of $0.05 for the three months ended March 31, compared to earnings of $0.13 per share for the same period in 2022.
Shopify Inc.
All currency listed in millions of US dollars, except earnings per share.
Selected highlights from their first quarter 2023 financial results on May 4, 2023
- Revenue of $1,508 for the three months ended March 31, compared to $1,204 for the same period in 2022. An increase of over 25%.
- Net income of $68 for the three months ended March 31, compared to a net loss of $1,468 in the same period in 2022.
- Diluted earnings per ordinary share of $0.05 for the three months ended March 31, compared to a loss of $1.17 per share for the same period in 2022.
Brookfield Renewable Partners L.P.
All currency listed in millions of US dollars, except earnings per share.
Selected highlights from their first quarter 2023 financial results on May 5, 2023
- Revenue of $1,331 for the three months ended March 31, compared to $1,136 for the same period in 2022. An increase of over 17%.
- Net income of $177 for the three months ended March 31, compared to net income of $33 in the same period in 2022.
- Diluted loss per ordinary share of $0.09 for the three months ended March 31, compared to a loss of $0.16 per share for the same period in 2022.