Items that may only interest or educate me ….
Canadian Economic data, US Economic data, First Quarter Earnings Season, What is the Consumer Confidence Index? …
Canadian Economic data
On Friday, Statistics Canada reported Canadian Gross Domestic Product (GDP) gained 0.1% in February, down from a revised 0.6% increase in January. An early estimate of the March GDP had the Canadian economy shrinking by 0.1%. For the first quarter, the economy likely grew by 2.5%, beating the Bank of Canada’s (BoC) 2.3% growth estimate.
All of that simply says, after a quick start to the year, the economy has cooled towards the end of the March. The slowing economy should prevent the BoC from increasing the Canadian benchmark rate. In fact, a BoC survey of Canadian market participants indicates they believe the interest rate will remain at 4.5% for the rest of 2023 before the BoC starts to reduce the rate in 2024.
The BoC itself anticipates inflation in Canada to fall to the high end of its inflation target of 1% – 3% in the second half of 2023. That does not mean it will be a smooth ride. Inflation could spike up before falling closer to the target range. Nor does it mean that once inflation hits the target range that inflation will continue to fall or remain in the range. The minutes from BoC’s last meeting shows the six BoC members wanted to see more evidence the effects of the higher interest rates are lowering inflation before they consider lowering the rate. They want to see signs, such as lower GDP growth (as reported this week), that inflation will not spike upward if they lower the interest rate. If there is to be any change in the interest rate this year, its most likely to be higher, otherwise, the rate will remain at 4.5% for the remainder of 2023.
US Economic data
The Commerce Department released the advance estimate of first-quarter GDP, showing it grew by 1.1% in the first quarter of 2023, on a year over year basis, well below analysts’ expectations of 1.9% and the previous quarters 2.6%. Higher consumer spending was more than offset by businesses blowing out existing inventories rather than building stockpiles of products. Another reason for the drop in productivity was likely the higher borrowing costs caused by the higher interest rate. However, before thinking the US is headed for a recession, consumer spending the first quarter increased by 3.7%, its highest increase in almost two years, and unemployment remains near historic lows.
One of the US Federal Reserve’s (Fed) favourite inflation measures, the Personal Consumption Expenditures (PCE) price index, which measures how much consumers spend on goods and services, rose 0.1% in March, falling from February’s 0.3% increase. On an annual basis, the PCE index rose 4.2%, after gaining 5.1% in February. The Core PCE, which excludes food and energy, held steady at 0.3% on a monthly basis but fell to 4.6% in March from 4.7% in February on an annual basis.
The good news: employment remains high, and consumers continue to spend.
The bad news: the higher numbers will catch the eye of the Fed and all but guarantees a rate increase next week and potentially an additional increase in June.
First Quarter Earnings Season
Last week the markets primary direction was sideways as investors had a lot to think about: mixed earnings, upcoming Fed decision on the US interest rate, and uncertainty about the world’s largest economy. This past week, concerns about the interest rate and a possible recession remain but it was a busy week for earnings reports, including many of the technology giants. The earnings reports should provide another view on how the US economy is performing.
Going into this week, many of the S&P 500 companies have reported their first quarter results. So far, over 75% have beaten analysts’ estimates. Not bad considering the long-term average for beating estimates is 66%. This past week there was a flood of reports, including many of mega cap technology and growth companies that have helped propel the S&P higher during the first quarter.
For the first four months of 2023, Microsoft (NASD: MSFT) is up over 28% this year, Amazon (NASD: AMZN) is up over 25% and Alphabet (NASD: GOOGL) was up over 21% (laggard 😊). Each company is a major player in the cloud services arena as well as the emerging Artificial Intelligence (AI) field. The roll out of AI is in its infancy so the revenue from AI will be negligible this past quarter and hard to determine since none of the companies have broken out that revenue stream. Let us look at these three companies.
Microsoft: revenues and earnings were both up, 7% and 9% respectively, beating expectations. On an annual basis, the Productivity and Business Processes division, includes the Microsoft 365 productivity suite, was up 11%; the Intelligent Cloud division, includes Azure cloud services, gained 16%; and the More Personal Computing (MPC) division was down 9%. Of note, in the MPC division (Bing, Xbox, etc.) the Bing search unit increased revenues 10%. I am guessing this has a lot to do with the integration of the AI bot ChatGPT into Bing. Microsoft said AI was already boosting sales, although they said it was not a big driver in the last quarter. However, they claim to have had a lot of interest from clients so the results should start to show in future earnings reports. Finally, share buybacks and dividends returned US$9.7 billion in value to shareholders.
Alphabet: posted better-than-expected first-quarter results with revenues up 3% on a yearly basis. Its big money maker, Google Search, was up 2.6% after falling 2% in the previous quarter. The company said Bard, their AI bot, boosted sales but probably had little impact since it was only rolled out in March. They did say users can look forward to seeing Bard more integrated into its productivity tools and cloud services. Google saw growth in its Google Cloud division and hopes to be profitable in 2024. Finally, they announced a US$70 billion share buyback plan.
Amazon: beat first quarter expectations in revenues (up 9%), operating margins (up 30%), and net income was US$3.2 billion compared to a net loss of US$3.8 billion in the previous year. A lot of the gains can be attributed to Amazon reducing its staff count by 10% this past quarter. Their highly profitable Amazon Web Services (AWS) cloud unit brought in sales of $21.4 billion, up 16% year-over-year. However, Amazon’s share price took a hit when its Chief Financial Officer said its customers were trying to reduce their AWS expenses so AWS’s revenue growth was likely to suffer going forward. Amazon has developed their own proprietary chips (“Trainium” and “Inferentia”) to boost their AI capabilities they can offer their AWS customers and stay ahead of rivals Microsoft and Google in cloud computing.
Wrapping up, all three companies did well last quarter, other than slowing sales in Amazon’s AWS unit. Cloud services remains a growth area for each company and AI will play a key role in their respective futures. Fortunately, all three are in at least one portfolio but I may look to add shares on a sizable drop in share price.
What is the Consumer Confidence Index?
In the US, The Conference board reported consumer confidence dropped to 101.3 in April from 104.2 in March. In Canada, the consumer confidence index rose to 49.24 in April. Great but what is the Consumer Confidence Index and how is it relevant to investors?
Last week I explained the Volatility index (VIX), this week let us look at the Consumer Confidence Index (CCI).
Both countries have their own CCI and use it as an important economic indicator to assess consumer sentiment and its impact on their respective economies. In Canada, the CCI is measured by The Conference Board of Canada, while in the US, it is measured by the Conference Board (it would be easy to get the two confused). Obviously if you are Canadian investing in Canada, you would check the Canadian CCI. Likewise, if you are investing in the American markets, you would want to check the American CCI.
The CCI measures how confident consumers feel about the economy and their own financial situation. It is like taking a temperature reading of the economy from the perspective of regular, ordinary people. In both countries, the CCI is measured on a scale of 0 to 200, with 100 representing a neutral level of confidence.
If the CCI is high, it means consumers are feeling relatively good and might be more likely to spend money on things they want or need. But if the CCI is low, it probably means they are feeling a more cautious and may focus spending on needs rather than wants. They are less likely to splurge on that extra fancy coffee or new designer shoes.
As an investor, you can use the CCI to get a sense of how confident or cautious consumers are feeling, which can help you make informed decisions about which sectors or companies might be doing well or not-so-well. When the CCI is high, investors tend to look at growth sectors such as consumer cyclicals, technology, and financials. On the other hand, when consumer confidence is low, investors tend to focus on defensive sectors like healthcare, utilities, and consumer staples.
In closing, the CCI is another tool you may want to use to help understand constantly changing market conditions. Use it in combination with other relevant information and analysis to make informed investment decisions. And keep in mind that market conditions can change quickly, so it is always good to keep an eye on the horizon!
With another index in our investing tool belt, let’s see what happened this past week….
Weekly Market Review
Monday: Another day, another lateral move by the indexes. Investors are waiting for the first quarter earnings reports later this week and the Fed update next week. Oil prices were higher as analysts expect rising demand in China, lifting Energy companies in both countries.
In Canada, the Toronto Stock Exchange Composite Index (TSX) ended slightly lower as investors wait for earnings announcements later this week. In trading in the Canadian sectors, Energy and Consumer Cyclicals had the biggest gains, while Technology, Financials and Healthcare were the only sectors to end lower.
In he US, the S&P 500 Index (S&P) and the Dow Jones Industrial Average (DJIA) moved higher, while the Nasdaq Composite Index (Nasdaq) dropped. Investors were cautious ahead of earnings reports from the technology giants this week. In the American sectors, Energy and Basic Materials (miners and fertilizer manufacturers) led gainers, while Telecommunications Services and Technology had the biggest declines.
Tuesday: Not a good day for the North American markets as all four major indexes ended lower by more than 1%. Falling commodity prices, concerns the banking crisis could flare up and fears the US will fall into a recession all put downward pressure on the markets.
In Canada, the TSX had its biggest drop in almost six weeks as lower commodity prices (crude oil and copper) had a significant impact on the resource heavy index. In the Canadian sectors, the defensive Utilities sector was the only one to advance while the Industrials and Consumer Cyclicals had the biggest declines.
In the US, a significant drop in deposits at US regional bank First Republic (NYSE: FRC) led to a record low share price and reignited concerns about regional banks, dragging the markets down. Disappointing earnings and gloomy forecasts by several companies increased concerns the US was heading for a recession, sending investors looking for less risky assets. It was a day of broad-based declines in the American sectors. Consumer Staples and Telecommunication Services fell the least while Basic Materials and Technology had the greatest declines.
Wednesday: Better than expected earnings reports by Microsoft and Alphabet yesterday led to a rebound in the indexes this morning before dropping into negative territory in the afternoon. Only the Nasdaq was able to move into positive territory on a late rally. Fear of the world’s largest economy falling into a recession and concerns about higher interest rates was too much for better than expected earnings reports to offset.
In Canada, the TSX fell as lower oil prices were too much for a rally in Canadian technology companies to overcome. In the Canadian sectors, the Technology and Consumer Staples sectors led gainers, while Industrials and Energy were the biggest decliners.
In the US, the strong earnings report from Microsoft led to a rally in technology companies as the Nasdaq bounced up and down for most of the day, finishing higher on a late rally. Otherwise, it was another day of mixed earnings and economic concerns that weighed on the S&P and DJIA. In trading, the Technology sector was the only American sector to advance, with Utilities and Industrials dropping the most.
Thursday: in a reversal of yesterday’s decline, all four indexes were up considerably today. More strong earnings report from the big technology companies was the catalyst that drove the indexes higher. Investors have started to move back into the growth-oriented Technology sector, especially the biggest companies.
In Canada, Canadian bank shares rebounded after falling on concerns the US banking crisis would flare up and side swipe the Canadian banking industry. On Bay Street, the heart of Canada’s financial industry, the Financials and Technology sectors were the best performers that saw all Canadian sectors end higher. Bringing up the rear were the Utilities and Industrials sectors.
In the US, strong earnings from Meta (NASD: META) in the morning followed up better than expected earnings from Alphabet and Microsoft earlier in the week to jumpstart a bullish day for the Nasdaq. GDP came in lower than expected indicating a slowing economy. On Wall Street, the heart of America’s financial district, it was a day of broad-based gains with all sectors ending higher. Leading the way were the growth-oriented Consumer Cyclicals, Technology, and Telecommunications Services sectors, which were up over 2% each. Trailing the pack were Energy and Healthcare.
Friday: All four indexes ended in positive territory today, a good way to end a volatile week. Earnings continue to meet or beat expectations, offsetting concerns of a slowdown in the US economy. After a mid week slump, oil prices rebounded on rising demand and lower production. Investors now turn their attention to the Fed meeting next week.
In Canada, the TSX benefitted from higher oil prices that lifted the Canadian Energy sector. Canada’s GDP grew less than expected, leading analysts to believe there will be no more increases to the Canadian benchmark interest rate. Trading on the last day of April was led higher by the Energy and Industrials sectors. The Utilities and Basic Materials sectors fell the most.
In the US, all three indexes were largely driven by gains in the big technology companies. There are more earnings to come but investors are concerned about higher interest rates and a possible recession. In the marketplace, leading the American sectors were Energy and Industrials, while Utilities and Telecommunications Services were the only two sectors to decline.
Weekly Market and Portfolio Review
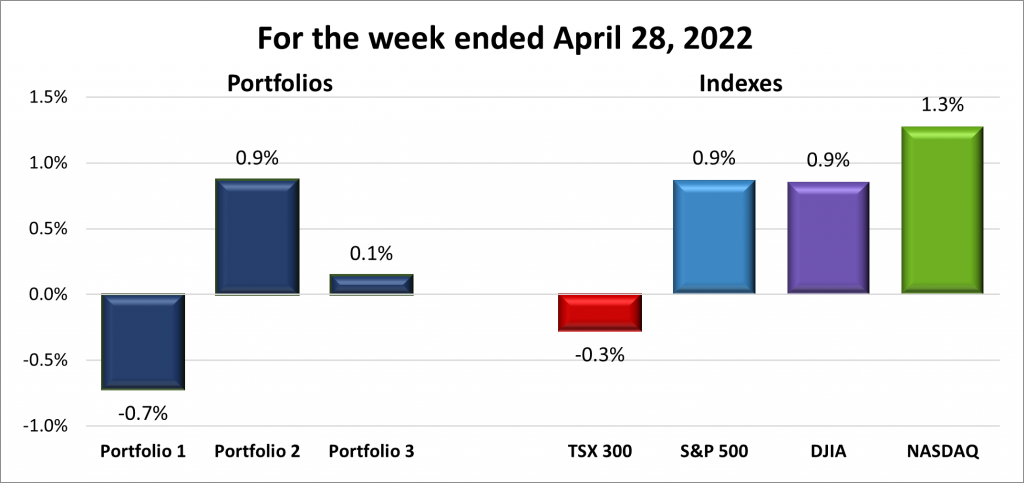
For the week, the TSX (SPTSX) fell 0.3%, the S&P 500 (SPX) increased 0.9%, the DJIA (INDU) added 0.9% and the Nasdaq (CCMP) rose 1.3%.
![]()
As shown in the chart above, the week didn’t start out well but a late rally lifted the three American indexes into positive territory, unfortunately the TSX came up a bit short. The main drivers this past week were earnings reports. Once Alphabet and Microsoft produced better than expected reports, investors started moving back into the big technology companies which in turn pushed the markets higher. Weighing on the indexes were concerns about the Fed’s interst rate announcement next week. Could an increase break another bank or push the US into a recession? Next week will provide an answer on the interest rate and also provide a glimpse of what the Fed is thinking going forward.
It was a mixed bag for the Portfolios with two out of three ending higher, as shown below. To paraphrase MeatLoaf, “two outa three ain’t bad.” 😊 I’m a bit surprised Porfolio 1 was down this week but it had no big winners and many of the technology companies in the portfolio ended lower for the week, including drops of more than 20% by Cloudflare (NYSE: NET) and Pinterest (NASD: PINS). Portfolio 2 advanced on the strength of Microsoft and MongoDB (NASD: MDB). Portfolio 3 was flat as gains by Microsoft were offset by the losses in Cloudflare.
Monthly Portfolio Review
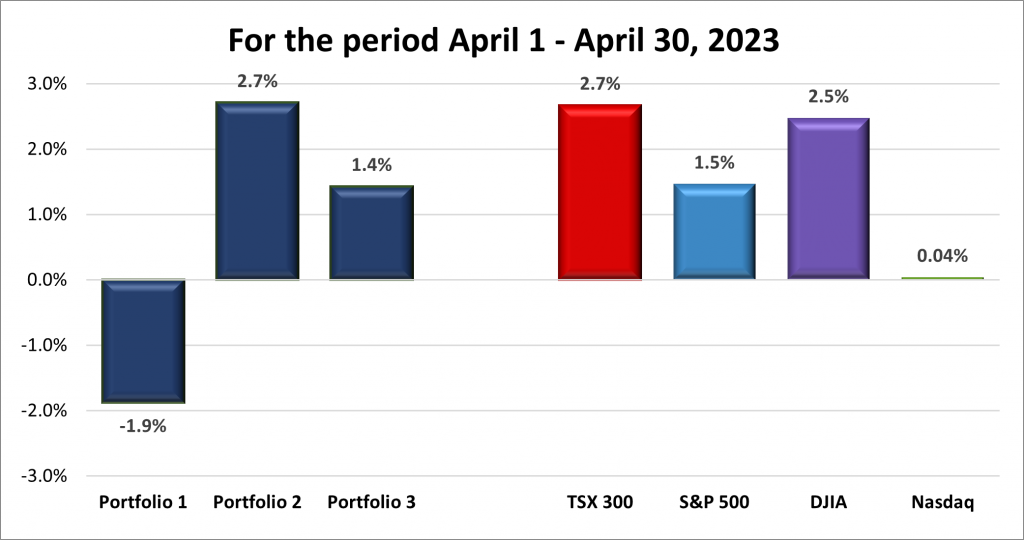
For the month, the TSX (SPTSX) advanced 2.7%, the S&P 500 (SPX) added 1.5%, the DJIA (INDU) rose 2.5% and the Nasdaq (CCMP) inched higher by 0.04%.
![]()
Looking at the chart above, you can see it was a volatile month for all four indexes, with good weeks and bad weeks. Earnings were the big market mover this month. On average, earnings were 6% lower compared with the first quarter of 2022, largely thanks to rising interest rates and inflation. But earnings season wasn’t as bad as many feared. In the end, all four indexes ended the month higher with the Nasdaq barely scrapping into positive territory. The TSX and DJIA each posted weekly gains for three of the four weeks in April, helping them become the top two performing indexes in April. While the S&P and Nasdaq posted weekly gains only twice in April.
As for the Portfolios, again, I’m surprised Portfolio 1 droppped but it declined two of the four weeks and when it did advance, it wasn’t as much as the other portfolios. Portfolio 2 and 3 posted there second straight month of gains. Both were buoyed by Microsoft’s strong performance.
I hope Portfolios 2 and 3 continue their monthly winning streak through May and Portfolio 1 gets back in the monthly win column.
Companies on the Radar
 Ero Copper Corp. (TSX: ERO) has been dropped from the list because it felt too risky for me.
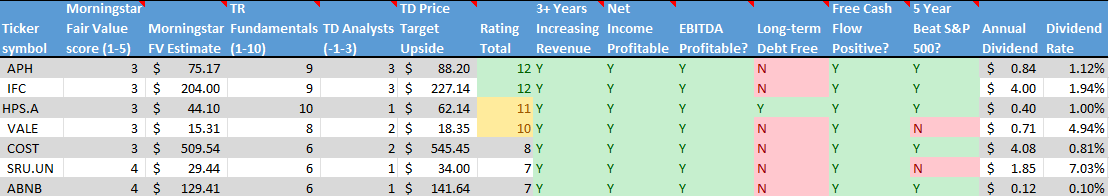
New to the Radar List is Costco (NYSE: COST), the global retailer selling out of giant warehouses. Every time I go there the place is packed and I wonder why I do not own shares in the company. Time to consider purchasing a few shares.
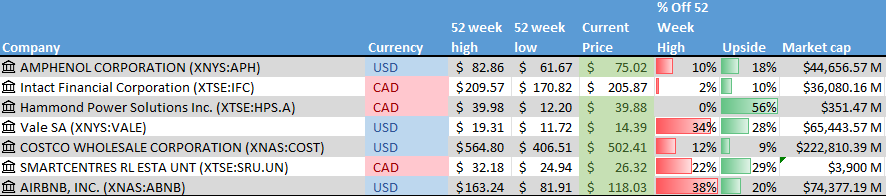
- Amphenol: (NYSE: APH) Producer of a high-tech interconnect, sensor, and antenna solutions for the automotive, aerospace, industrial and various technology industries.
- Intact Financial (TSX: IFC): A Canadian mid size insurance company supplying home, car and business insurance in Canada, the US, and the UK.
- Hammond Power Solutions (TSX: HPS.A): A small cap Canadian company manufacturing transformers used throughout the world in a wide variety of industries.
- Vale (NYSE: VALE): A global mining company that extracts various metals and rare earth elements such as nickel, cobalt, gold, copper, that are used in electric vehicles.
- Smartcentres Real Estate Investment Trust (TSX: SRU.UN): Owns and manages a number of income producing malls and retails spaces throughout Canada.
- Airbnb (NASD: ABNB): provider of short term rental unit, connecting hosts and guests.
The Radar Check was last updated April 28, 2023.
Portfolio Update
Portfolio 1
Portfolio 1 for the week ended April 28, 2023: DOWN ![]()
- Apple (NASD: AAPL) lost its bid to have the US Court of Appeals overturn a previous decision to allow developers to provide the ability for third party in app payment options to avoid paying sales commissions to Apple. This is likely to have an impact on Apple’s revenues.
- General Motors (NYSE: GM) reported better than expected earnings thanks to higher demand for higher priced vehicles. However, GM warned the good times will not last throughout 2023.
- Tesla (NASD: TSLA) is at it again with price cuts. This time they have lowered the price on their popular Model Y, making the cheapest version of the Model Y lower than the average price of a conventional car or truck. Good for buyers, not so good for Tesla investors due to the lower profit margin.
Tesla also announced Canada will soon be receiving Model Y’s produced in China. The Shanghai plant must be extremely efficient if its cheaper to ship vehicles from China rather than from their US factories.
Activity
Sold: Innovative Industrial Properties Inc. (NYSE: IIPR) After watching IIPR drift down from a high of nearly US$280 in November 2021, I finally decided to sell the shares. I had been holding the company hoping it would return to the heady days of late 2021 but it was not to be. I don’t see cannabis being a high growth industry so decided to take the 50%+ gains but annoyed at myself for leaving to much money on the table. I should have sold when it dropped below US$200. ☹
Dividends
Dividends Received this week for the following companies:
Companies followed by DRIP (Dividend Re-Investment Plan) indicate additional shares were purchased with the dividend. Any cash leftover was added to the cash balance.
Canadian $
BCE Inc (TSX: BCE) DRIP
US $
No US$ dividends this past week.
Quarterly Reports
CN Railway Company
All currency listed in millions of Canadian dollars, except earnings per share.
Selected highlights from their first quarter 2023 financial results on April 24, 2023
- Revenue of $4,313 for the three months ended March 31, compared to $3,708 for the same period in 2022. An increase of over 16%.
- Net income of $1,220 for the three months ended March 31, compared to net income of $918 in the same period in 2022.
- Diluted earnings per ordinary share of $1.82 for the three months ended March 31, compared to earnings of $1.31 per share for the same period in 2022.
General Motors Co.
All currency listed in thousands of US dollars, except earnings per share.
Selected highlights from their first quarter 2023 financial results on April 25, 2023
- Revenue of $39,985 for the three months ended March 31, compared to $35,979 for the same period in 2022. An increase of over 11%.
- Net income of $2,395 for the three months ended March 31, compared to net income of $2,939 in the same period in 2022.
- Diluted earnings per ordinary share of $2.21 for the three months ended March 31, compared to earnings of $2.09 per share for the same period in 2022.
Alphabet Inc.
All currency listed in millions of US dollars, except earnings per share.
Selected highlights from their first quarter 2023 financial results on April 25, 2023
- Revenue of $69,787 for the three months ended March 31, compared to $68,011 for the same period in 2022. An increase of over 2%.
- Net income of $15,051 for the three months ended March 31, compared to net income of $16,436 in the same period in 2022.
- Diluted earnings per ordinary share of $1.17 for the three months ended March 31, compared to earnings of $1.23 per share for the same period in 2022.
Visa Inc.
All currency listed in millions of US dollars, except earnings per share.
Selected highlights from their second quarter 2022 financial results on April 25, 2023
- Revenue of $7,985 for the three months ended March 31, compared to $7,189 for the same period in 2022. An increase of over 11%.
- Net income of $4,257 for the three months ended March 31, compared to net income of $3,647 in the same period in 2022.
- Diluted earnings per ordinary share of $2.04 for the three months ended March 31, compared to earnings of $1.70 per share for the same period in 2022.
- Revenue of $15,921 for the six months ended March 31, compared to $14,248 for the same period in 2022. An increase of almost 12%.
- Net income of $8,436 for the six months ended March 31, compared to net income of $7,606 in the same period in 2022.
- Diluted earnings per ordinary share of $4.03 for the six months ended March 31, compared to earnings of $3.54 share for the same period in 2022.
Roku, Inc.
All currency listed in thousands of US dollars, except earnings per share.
Selected highlights from their first quarter 2022 financial results on April 26, 2023
- Revenue of $740,990 for the three months ended March 31, compared to $733,699 for the same period in 2022. An increase of almost 1%.
- Net loss of $193,604 for the three months ended March 31, compared to net loss of $26,306 in the same period in 2022.
- Diluted loss per ordinary share of $1.38 for the three months ended March 31, compared to a loss of $0.19 per share for the same period in 2022.
Teladoc Health, Inc.
All currency listed in thousands of US dollars, except earnings per share.
Selected highlights from their first quarter 2022 financial results on April 26, 2023
- Revenue of $629,244 for the three months ended March 31, compared to $565,350 for the same period in 2022. An increase of over 11%.
- Net loss of $69,228 for the three months ended March 31, compared to net loss of $6,674,523 in the same period in 2022.
- Diluted loss per ordinary share of $0.42 for the three months ended March 31, compared to a loss of $41.58 per share for the same period in 2022.
Cloudflare, Inc.
All currency listed in thousands of US dollars, except earnings per share.
Selected highlights from their first quarter 2022 financial results on April 27, 2023
- Revenue of $290,175 for the three months ended March 31, compared to $212,167 for the same period in 2022. An increase of over 37%.
- Net loss of $38,082 for the three months ended March 31, compared to a net loss of $41,381 in the same period in 2022.
- Diluted loss per ordinary share of $0.12 for the three months ended March 31, compared to a loss of $0.13 per share for the same period in 2022.
Amazon.com, Inc.
All currency listed in millions of US dollars, except earnings per share.
Selected highlights from their first quarter 2022 financial results on April 27, 2023
- Revenue of $127,358 for the three months ended March 31, compared to $116,444 for the same period in 2022. An increase of over 10%.
- Net income of $3,172 for the three months ended March 31, compared to net loss of $3,844 in the same period in 2022.
- Diluted earnings per ordinary share of $0.31 for the three months ended March 31, compared to a loss of $0.38 per share for the same period in 2022.
Pinterest, Inc.
All currency listed in thousands of US dollars, except earnings per share.
Selected highlights from their first quarter 2022 financial results on April 27, 2023
- Revenue of $602,581 for the three months ended March 31, compared to $574,885 for the same period in 2022. An increase of almost 5%.
- Net loss of $208,579 for the three months ended March 31, compared to a net loss of $5,281 in the same period in 2022.
- Diluted loss per ordinary share of $0.31 for the three months ended March 31, compared to a loss of $0.01 share for the same period in 2022.
Portfolio 2
Portfolio 2 for the week ended April 28, 2023: UP ![]()
- Walt Disney (NYSE: DIS) underwent a second round of layoffs this week as part of their ongoing efforts to lower cost by eliminating approximately 7,000 workers this year. The first round of layoffs to their 220,000-person workforce was in March. Disney has been trying to stop or at least slow losses incurred by their Disney+ streaming service. When the streaming service began in 2019, the goal was to grow the subscriber base. Now, investors are starting to focus on the cost of online video platforms.
Separately, Disney launched a lawsuit against Florida governor Ron DeSantis. Disney says DeSantis is weaponizing the state government to harm Disney in retaliation for criticizing a state law banning discussion of sexuality in classrooms. Disney maintains voicing an opinion is protected by free-speech rights. - Guardant Health (NASD: GH) announced they will be working with the Parker Institute for Cancer Immunotherapy to study the connection between cancer biomarkers and immunotherapy treatment response.
- In their earnings conference call, TC Energy (TSX: TRP) said they were looking to sell some of their assets to reduce debt and/or fund other projects.
Activity
No significant activity to report this week.
Dividends
Dividends Received this week for the following companies:
Companies followed by DRIP (Dividend Re-Investment Plan) indicate additional shares were purchased with the dividend. Any cash leftover was added to the cash balance.
Canadian $
Dream Industrial Real Estate Investment Trust (TSX: DIR.UN) DRIP
TC Energy Corp (TSX: TRP)
US $
No US$ dividends this past week.
Quarterly Reports
Microsoft Corporation
All currency listed in millions of US dollars, except earnings per share.
Selected highlights from their third quarter 2022 financial results on April 25, 2023
- Revenue of $52,857 for the three months ended March 31, compared to $49,360 for the same period in 2022. An increase of over 7%.
- Net income of $18,299 for the three months ended March 31, compared to net income of $16,728 in the same period in 2022.
- Diluted earnings per ordinary share of $2.45 for the three months ended March 31, compared to earnings of $2.22 per share for the same period in 2022.
- Revenue of $155,726 for the nine months ended March 31, compared to $146,405 for the same period in 2022. An increase of over 6%.
- Net income of $52,280 for the nine months ended March 31, compared to net income of $55,998 in the same period in 2022.
- Diluted earnings per ordinary share of $6.99 for the nine months ended March 31, compared to earnings of $7.41 per share for the same period in 2022.
TC Energy Corporation
All currency listed in millions of Canadian dollars, except earnings per share.
Selected highlights from their first quarter 2022 financial results on April 28, 2023
- Revenue of $3,928 for the three months ended March 31, compared to $3,500 for the same period in 2022. An increase of over 12%.
- Net income of $1,313 for the three months ended March 31, compared to net income of $358 in the same period in 2022.
- Diluted earnings per ordinary share of $1.29 for the three months ended March 31, compared to earnings of $0.36 per share for the same period in 2022.
Portfolio 3
Portfolio 3 for the week ended April 28, 2023: UP ![]()
- Shopify (TSX: SHOP) expanded its financial technology offerings with Shopify Bill Pay. The new, free service that will allow merchants to manage and pay vendors from their Shopify admin dashboard.
- Microsoft’s acquisition of Activision (NASD: ATVI) is all but dead after Britain’s Competition and Markets Authority (CMA) blocked the deal. The CMA said agreements Microsoft offered rivals only covered consoles, not cloud platforms, and would hinder competition in cloud gaming. Microsoft already has a tremendous advantage in the cloud environment where it holds 60% – 70% of the gaming market. Microsoft plans to appeal the decision, but the veto sets a precedent for upcoming decisions by the European Commission and the US Federal Trade Commission. I just do not see a split decision among the three trade commissions, but it would make for an interesting situation. 😊
Despite the setback in Britain, Microsoft signed a ten-year deal with Spain’s Nware to bring Xbox and Activision games to Nware’s cloud platform. I suspect the deal was to prove a point to the CMA as well as the European and US regulatory bodies. - A study by Magnite (NASD: MGNI) revealed streaming TV is now the most watched form of TV in the Nordic region (Denmark, Finland, Norway, and Sweden), watched by 78% of viewers in the Nordic countries.
Activity
No significant activity to report this week.
Dividends
Dividends Received this week for the following companies:
Companies followed by DRIP (Dividend Re-Investment Plan) indicate additional shares were purchased with the dividend. Any cash leftover was added to the cash balance.
Canadian $
goeasy Ltd. (TSX: GSY)
US $
No US$ dividends this past week.
Quarterly Reports
Microsoft Corporation
All currency listed in millions of US dollars, except earnings per share.
Selected highlights from their third quarter 2022 financial results on April 25, 2023
- Revenue of $52,857 for the three months ended March 31, compared to $49,360 for the same period in 2022. An increase of over 7%.
- Net income of $18,299 for the three months ended March 31, compared to net income of $16,728 in the same period in 2022.
- Diluted earnings per ordinary share of $2.45 for the three months ended March 31, compared to earnings of $2.22 per share for the same period in 2022.
- Revenue of $155,726 for the nine months ended March 31, compared to $146,405 for the same period in 2022. An increase of over 6%.
- Net income of $52,280 for the nine months ended March 31, compared to net income of $55,998 in the same period in 2022.
- Diluted earnings per ordinary share of $6.99 for the nine months ended March 31, compared to earnings of $7.41 per share for the same period in 2022.
Cloudflare, Inc.
All currency listed in thousands of US dollars, except earnings per share.
Selected highlights from their first quarter 2022 financial results on April 27, 2023
- Revenue of $290,175 for the three months ended March 31, compared to $212,167 for the same period in 2022. An increase of over 37%.
- Net loss of $38,082 for the three months ended March 31, compared to a net loss of $41,381 in the same period in 2022.
- Diluted loss per ordinary share of $0.12 for the three months ended March 31, compared to a loss of $0.13 per share for the same period in 2022.
Real Matters Inc.
All currency listed in thousands of US dollars, except earnings per share.
Selected highlights from their second quarter 2022 financial results on April 28, 2023
- Revenue of $37,610 for the three months ended March 31, compared to $94,981 for the same period in 2022. A decrease of almost 60%.
- Net loss of $2,580 for the three months ended March 31, compared to a net loss of $509 in the same period in 2022.
- Diluted earnings per ordinary share of $0.04 for the three months ended March 31, compared to a loss of $0.01 per share for the same period in 2022.
- Revenue of $75,775 for the six months ended March 31, compared to $202,738 for the same period in 2022. A decrease of over 62%.
- Net loss of $7,199 for the six months ended March 31, compared to net earnings of $2,127 in the same period in 2022.
- Diluted loss per ordinary share of $0.10 for the six months ended March 31, compared to earnings of $0.03 per share for the same period in 2022.