
September Slump: Will This Year Be Different?
September has a bit of a bad reputation on Wall Street. Historically, it’s the weakest month for stocks – a pattern often called the “September Effect.” Unlike other market drops tied to clear events, this is more of a seasonal trend. Some say investors pull back after the summer rally to lock in profits. Others point to mutual funds and big institutions rebalancing portfolios ahead of year-end, which adds selling pressure. Add in traders returning from summer holidays with a cautious outlook, and September has often leaned negative.
History has delivered some painful reminders. In 2008, during the financial crisis, the S&P 500 plunged nearly 9% in a single September. In 2001, the 9/11 attacks triggered a steep selloff. More recently, in 2022, the index slid almost 10% as rising interest rates rattled investors.
So, what could make this September another challenging month? Interest rates are still high, and while the Fed has hinted at cuts later this year, uncertainty about timing continues to hang over the market. Higher borrowing costs squeeze corporate profits and weigh on consumer spending. Trade tensions are another wildcard – the recent court ruling against Trump’s tariffs has stirred questions about future policy, and no one wins in trade wars. At the same time, heavyweight technology companies, which have powered much of this year’s gains, are showing bouts of volatility that could spill into broader markets.
Politics add another layer. Former President Trump has stepped up attacks on the Federal Reserve, questioning its independence and suggesting it should align with his agenda. The Fed is supposed to operate above politics to focus on inflation and stability, so when that independence is challenged, investors worry that rate decisions could be driven by politics rather than data. The same concern extends to agencies like the Bureau of Labor Statistics (BLS) where Trump recently fired the head of the agency after it delivered a report he didn’t like. The credibility of supposedly independent agencies is crucial for decisions driven by data rather than politically motivated.
Psychology matters too. Investors know September’s track record, and sometimes that very reputation makes traders more cautious, reinforcing the pattern. Still, nothing is set in stone – plenty of Septembers have surprised to the upside. While the month is known as the toughest stretch on average, history also shows that markets don’t always follow the script. Maybe this year will be one of those exceptions. Stay tuned. 😊
With that backdrop in mind, let’s take a look at how the markets moved this past week – and how my three portfolios held up…
Items that may only interest or educate me ….
Canadian Economic news, US Economic news, ….
Canadian Economic news
This past week’s key economic data that the Bank of Canada (BoC) considers when deciding whether to raise or lower the interest rate.
Labour Force Survey (LFS)
Statistics Canada reported that Canada’s job market weakened again in August, with the economy shedding 65,500 jobs after July’s loss of 40,800. That was a sharp miss from analysts’ expectations of a modest 10,000-job gain. Most of the losses came from service industries such as professional, scientific, technical, transportation, and warehousing. Construction was the lone bright spot, adding about 17,100 positions. Part-time workers and adults aged 25 to 54 bore the brunt of the decline.
The unemployment rate climbed to 7.1%, the highest level since May 2016 outside of the pandemic years, underscoring how much momentum has cooled. Wages, meanwhile, are still edging higher, with average hourly earnings up 3.2% year-over-year, a touch slower than July’s 3.3% pace.
Overall, the August labour report painted a picture of a job market losing steam: back-to-back employment declines, rising unemployment, and uneven wage growth. Analysts now see a 90% chance the BoC will cut interest rates at this month’s meeting, as BoC officials face growing pressure to pivot from fighting inflation to supporting growth.
Canadian Market Volatility
Canada’s volatility gauge, the S&P/TSX 60 Volatility Index (VIXC), opened the week at 14.3, nudged higher by the usual worries that September can be a choppier month for markets. But as the week unfolded, optimism around potential rate cuts in both Canada and the US helped calm nerves. The VIXC gradually eased, spending most of the week hovering between 11 and 10. By week’s end, after fresh labour data reinforced the cooling economy narrative, the index slipped to 9.96 – its lowest point of the week.
Think of the VIXC as a “fear gauge” for the Canadian stock market. When investors feel nervous, often due to uncertainty or sudden news, the index ticks higher. Lower numbers, like where it finished the week, signal calmer sentiment. For anyone new to investing, it’s a useful snapshot of how the market is feeling.
US Economic news
This past week’s key data points that the Federal Reserve (Fed) considers when deciding whether to raise or lower the interest rate.
Labour data
This week’s labour data from three major reports – the Job Openings and Labor Turnover Survey (JOLTS), the ADP Employment Report, and the Employment Situation Summary (ESS) – gives a full snapshot of the US job market. Each report looks at a different angle: JOLTS tracks demand for workers through openings, hires, and quits; ADP previews private-sector payroll growth; and the ESS, also known as the monthly jobs report, delivers the big picture with unemployment, job gains, and wage growth. Together, they show whether the job market is heating up or starting to cool.
JOLTS
The latest JOLTS report showed job openings slipped again, dropping to 7.18 million in July from a downwardly revised 7.36 million in June. That’s well below analysts’ forecast of 7.38 million and marks the lowest level in ten months, signaling a cooling job market.
For the first time since April 2021, there are more job seekers than available positions, with the unemployed-to-openings ratio falling just below 1 (0.99). Overall, the report points to easing labour demand and slower hiring momentum. While that’s tough news for job seekers, a softer job market boosts the case for the Fed to cut interest rates later this month.
ADP Employment Report
ADP’s latest report showed private-sector job growth slowing sharply in August, with just 54,000 new positions added – well short of the 65,000 new jobs economists had expected and only slightly more than half of July’s 104,000 gain.
Leisure and hospitality, along with construction, continued to add jobs, while sectors like manufacturing, education, healthcare, and transportation saw declines. Pay growth held steady: job-stayers earned 4.4% more than a year ago, while job-changers saw gains near 7.1%.
The report reinforces the story of a cooling labour market, mirroring the trends seen in JOLTS, and further strengthens expectations for a Fed rate cut later this month.
ESS
The BLS’s August ESS showed nonfarm payrolls rose by just 22,000, far below July’s upwardly revised gain of 73,000 and the expected 75,000. The unemployment rate ticked up to 4.3%, the highest since 2021, while annual wage growth slowed to 3.7%, down from 3.9% in July.
These three bits of data, taken together, signals a softening labour market. Investors are now pricing in a better than 90% chance of a Fed rate cut at the September 16–17 meeting, as Fed officials weigh slowing job growth against their ongoing fight against inflation.
Summary
With the JOLTS and ADP Employment Reports serving as appetizers, all eyes were on the BLS’s official jobs report. That’s the one markets watch most closely, since it gives the full picture of unemployment, job gains, and wage growth. The report confirmed the cooling trend we saw in JOLTS and ADP, all but sealing the case for a Fed rate cut later this month.
American Market Volatility
The CBOE Volatility Index (VIX), often called the “fear gauge” for US stocks, opened the week at 16.65 as September’s reputation for volatility spooked investors and concerns over President Trump’s influence on the Fed rattled confidence. Midweek, softer labour data and rising expectations for rate cuts helped calm nerves, and the VIX steadily drifted lower to close the week at 15.18.
For anyone new to the VIX, it’s a handy snapshot of how jittery, or calm, the US market feels. Readings between 12 and 20 indicate relatively calm conditions, while levels above 20 suggest traders are bracing for rougher waters. The higher it climbs, the more uncertainty is being priced into markets.
Weekly Market and Portfolio Review
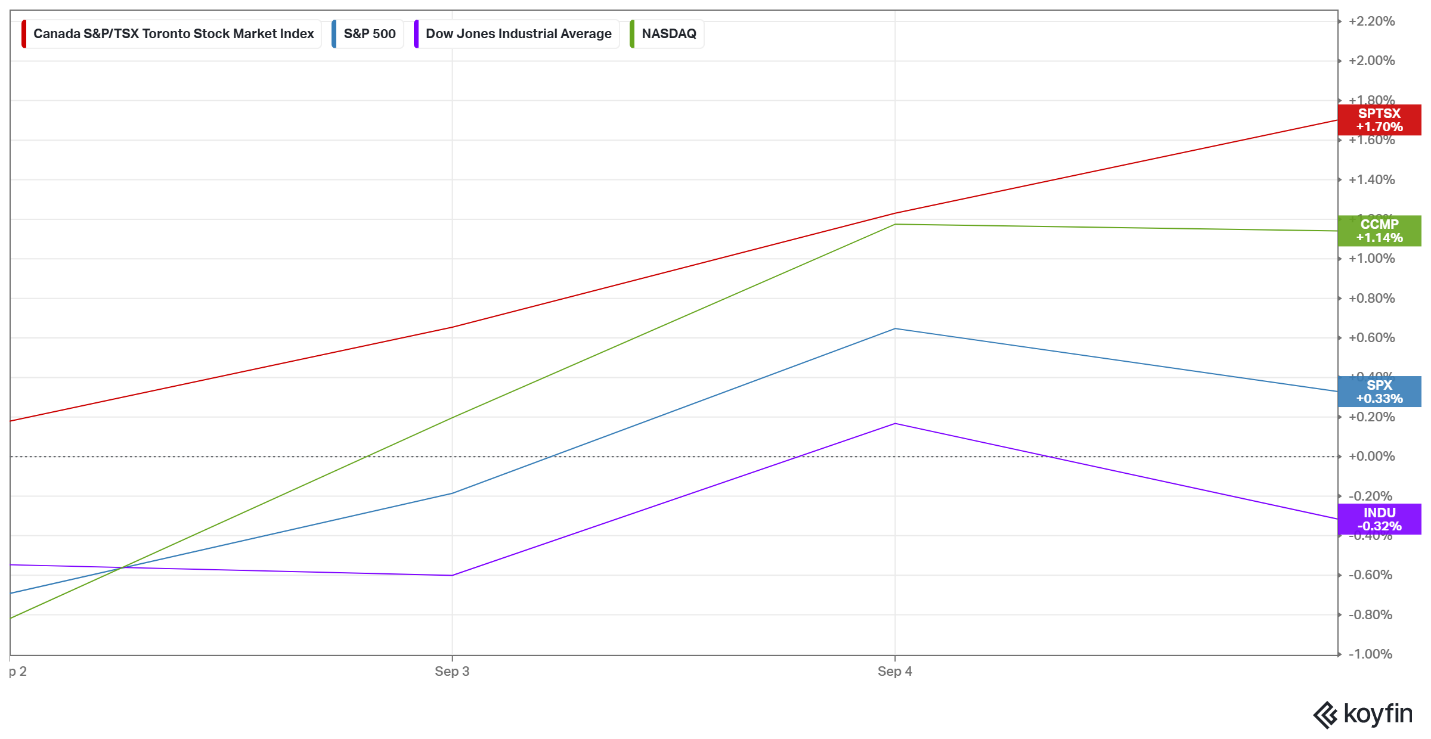
For the week, the TSX (SPTSX) rose 1.7%, the S&P 500 (SPX) advanced 0.3%, the DJIA (INDU) dropped 0.3% and the Nasdaq (CCMP) gained 1.1%.
| Index | Weekly Streak |
| TSX: | 5 – week winning streak |
| S&P: | 1 – week winning streak |
| DJIA: | 2 – week losing streak |
| Nasdaq: | 1 – week winning streak |
![]() The shortened week got off to a rocky start, kicking off what’s historically the toughest month for markets. A US Federal Appeals Court ruling against the legality of President Trump’s tariffs stirred fresh uncertainty and weighed on the S&P 500 (S&P), the Dow Jones Industrial Average (DJIA), and the Nasdaq Composite (Nasdaq). North of the border, the Toronto Stock Exchange Composite Index (TSX) marched to its own beat, setting another record high.
The shortened week got off to a rocky start, kicking off what’s historically the toughest month for markets. A US Federal Appeals Court ruling against the legality of President Trump’s tariffs stirred fresh uncertainty and weighed on the S&P 500 (S&P), the Dow Jones Industrial Average (DJIA), and the Nasdaq Composite (Nasdaq). North of the border, the Toronto Stock Exchange Composite Index (TSX) marched to its own beat, setting another record high.
The rebound came quickly. The S&P soon notched its own record, while the TSX extended its winning streak to eight straight sessions – its longest run since May, with new highs each day.
American markets had plenty on their plate. Concerns grew over Trump’s push to influence the Fed, raising questions about the central bank’s independence. On the economic front, the JOLTS, ADP, and BLS’s ESS all pointed to softer job growth. Of these, the BLS report carries the most weight since it captures the full picture of unemployment, job gains, and wage growth. August marked the fourth straight month of weak results, another sign the labour market is losing steam. With the BLS report coming in weaker than expected, it all but sealed the case for a Fed rate cut later this month.
On the trade front, negotiations and tariff questions kept global growth in focus, leaving investors wary of potential ripple effects. Trade policy remained a wildcard. If the Appeals Court ruling against Trump’s tariffs is upheld by the Supreme Court, Washington could be forced to return billions collected in tariff revenue while leaving Trump isolated from nearly all of the America’s trading partners.
There were also bright spots this past week. Alphabet’s (NASD: GOOGL) stock price jumped after a favourable court ruling ensured Google wouldn’t be forced to break up its search business. The decision also cleared the way for Google to keep paying Apple (NASD: AAPL) to remain the default search engine in Safari and Siri. The outcome fell well short of investors’ worst fears, sparking a surge in Alphabet’s stock and lifting heavyweight tech shares more broadly.
In Canada, the TSX spent the week setting record after record, now closing at all-time highs in 10 of the last 11 trading sessions, including its eighth straight record-setting day to end the week. The run has been powered by rising gold prices, optimism on trade negotiations, and growing expectations of rate cuts from both the BoC and the Fed. Gold prices climbed, drawing investors toward the safer asset. A shrinking trade deficit added an extra boost, as stronger export demand – especially for commodities – supported Canada’s resource-heavy market. Taken together, these forces gave investors plenty of reasons to keep pushing the TSX higher.
By week’s end, hopes for rate cuts and strength in heavyweight technology companies helped steady the market, even as politics and trade kept investors on edge. At the risk of jinxing September, if this is what a “bad” start looks like, we could be in for a pretty decent month. 😊
| Portfolio | Weekly Streak |
| Portfolio 1: | 1 – week winning streak |
| Portfolio 2: | 5– week winning streak |
| Portfolio 3: | 4 – week losing streak |
![]()
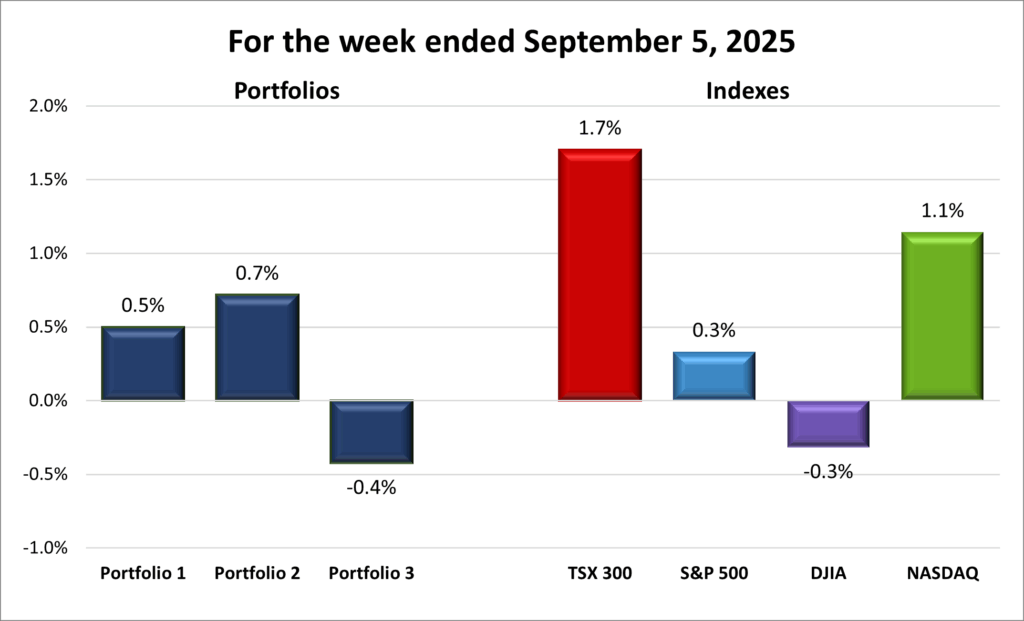
![]() With such a mixed backdrop in the markets, it’s no surprise my three portfolios delivered split results this week. Once again, the heavy weighting of Nvidia (NASD: NVDA) in Portfolios 1 and 3 acted as a drag on both portfolios.
With such a mixed backdrop in the markets, it’s no surprise my three portfolios delivered split results this week. Once again, the heavy weighting of Nvidia (NASD: NVDA) in Portfolios 1 and 3 acted as a drag on both portfolios.
Portfolio 1 still managed to climb 0.5%, with 56% of its holdings finishing higher. The standout was Celestica (TSE: CLS), which surged 17% to an all-time high. Alphabet also gave the portfolio a big lift, jumping 11% after US courts cleared the way for Google to avoid a breakup, keep its search dominance intact, and continue profiting from default deals with Apple. The ruling removed a major cloud hanging over the stock, unlocking new momentum and pushing shares to record levels.
Portfolio 2 was the week’s top performer, rising 0.7%. Just over half the holdings gained ground, led by a 10% jump in Alimentation Couche-Tard (TSE: ATD). iA Financial (TSE: IAG) also impressed, hitting a new high and adding to the portfolio’s strength.
Portfolio 3 lagged behind the other two portfolios, slipping 0.4% as only 45% of its companies finished positive. Nvidia’s pullback weighed heavily, though Shopify (TSE: SHOP) helped soften the blow with a strong week of gains.
Overall, two out of three in the green isn’t a bad way to wrap this week up. 😊
Companies on the Radar
 This past week, I started by trimming my radar list to make it more manageable. I removed Fiserv (NYSE: FI), the American fintech company, and Secure Energy Services (TSE: SES), a Canadian environmental and waste management firm serving energy and industrial clients. For Fiserv, I’m already invested in two of the top financial services companies – Visa (NYSE: V) and PayPal (NASD: PYPL) – so I don’t need another one. As for SES, with oil prices dropping, I don’t expect exploration or drilling to pick up in the next year or two. I’d rather put my money into a company in a growing sector, like Mainstreet Equity Corp. (TSE: MEQ), the housing company.
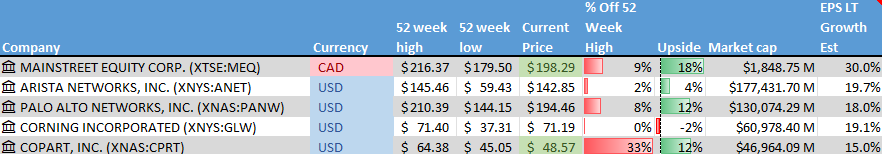
With those two gone, my radar list is now back down to five companies.
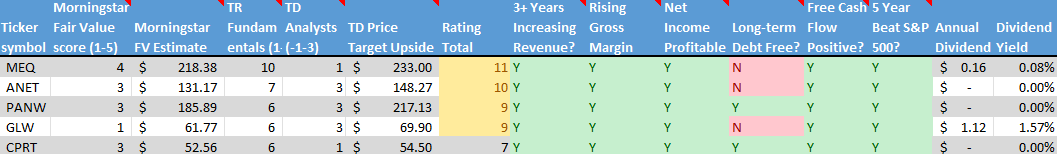
- Mainstreet Equity Corp.: a Calgary-based real estate company focused on mid-market apartment buildings – typically under 100 units – across Western Canada. It buys underperforming properties at below-market prices, renovates them, and increases rental income through improved operations. With strong demand for rental housing, a repeatable value-add strategy, and a solid balance sheet, Mainstreet offers a compelling mix of income and growth. Shares currently trade below net asset value, giving investors a margin of safety alongside steady cash flow and long-term upside.
- Arista Networks (NYSE: ANET): an American company that designs and sells advanced networking hardware and software, with a focus on high-speed, low-latency switches for its key markets: data centres, AI, cloud computing, and financial trading. The company has been riding the AI tailwind with solid demand from its core markets, especially in AI and cloud data centres. It also has a hefty share buyback program and increasing investments from some of the top institutional investment companies.
- Palo Alto Networks (NASD: PANW) is an American cybersecurity company, providing firewalls, cloud security, and AI-driven tools to companies around the world. It’s seen as a key play on AI-powered cybersecurity and is also benefitting from rising federal spending in this area. The stock can be volatile, but it’s been riding strong AI and cybersecurity tailwinds.
- Corning Incorporated (NYSE: GLW): a large cap American company that is a leader in specialty glass, optical fiber, environmental technology, life sciences, and other specialty glasses. They have been the supplier of the glass used in Apple’s iPhones since 2007, and they are riding the tailwind of an AI-driven fiber optic boom.
- Copart (NASD: CPRT): this American company runs one of the world’s largest online vehicle auction platforms, specializing in salvaging cars from accidents and natural disasters. It sells on behalf of insurers, dealerships, rental companies, and individuals. Copart earns revenue through transaction fees, storage, transportation, and listing services. Its digital model, global buyer network, and asset-light approach support strong margins and steady growth. With no long-term debt and rising tailwinds from vehicle values and insurance claims, it’s a steady growth story that’s earned a spot on my radar.
As always, these are not buy recommendations. Make sure to do your own research and choose investments that fit your personal financial goals.
The Radar Check was last updated September 5, 2025.
That’s a wrap for this week, thanks for reading – may your portfolio stay green and your dividends steady. See you next time!