
The Canada-US Trade War: What’s Really Going On?
The Canada- US trade war was back in the headlines this week, with Canada imposing tariffs in retaliation for US tariffs on Canadian goods. But while the headlines can make the dispute sound straightforward, the underlying issues are considerably more complicated. Before looking at what it means for investors, it’s worth stepping back and asking three basic questions.
First, how did we get here?
This isn’t a new dispute. During his first term as president, Donald Trump imposed tariffs on Canadian steel and aluminum in 2018, prompting Canada to retaliate with tariffs of its own. Those tariffs were eventually removed, but the protectionist approach returned when Trump took office again in 2025. The current trade war is therefore less a new development than an escalation of policies that began during his first administration.
Second, does the US really have a huge trade problem with Canada?
The US does run a substantial merchandise trade deficit with Canada, but the headline number doesn’t tell the whole story. A large part of Canada’s trade surplus comes from energy exports, particularly crude oil. Remove energy from the calculation and Canada actually runs a trade deficit with the US, something that often gets overlooked in the US trade-deficit argument. According to Trump, the US doesn’t need anything from Canada. If America simply stopped buying Canadian crude oil, which it supposedly doesn’t need, the US would run a trade surplus with Canada.
Population also matters. Canada has roughly 40 million people compared with more than 340 million in the US. Imagine every American bought a $1 hockey stick from Canada, while every Canadian bought a $2 baseball bat from the US. Canada would still have a huge trade surplus, even though each Canadian spent twice as much on American goods as each American spent on Canadian goods. The size of a trade balance tells us how much money is flowing between two countries, but not necessarily whether the relationship is fair or one-sided.
Finally, who actually pays for a trade war?
A tariff is technically paid by the importer in the country imposing it, not by the foreign government. But that doesn’t mean the foreign country escapes the cost. Businesses can absorb some of it, exporters may have to lower their prices to remain competitive, and consumers can end up paying more.
In other words, tariffs can hurt both sides. That’s particularly true when two economies are as closely connected as Canada and the US. A Canadian company may rely on American customers, while an American manufacturer may rely on Canadian raw materials or components. Add tariffs to that supply chain and costs can rise at multiple points before a finished product reaches the consumer.
For investors, this is where the trade war gets interesting. The lesson isn’t to simply avoid Canadian or American companies. It’s to understand how individual businesses are exposed and how well they can adapt. A company with little cross-border exposure may barely notice. Another may face higher costs, lost customers or a permanent change to its supply chain. Some may even benefit as customers look for alternatives to imported goods.
That’s why I think investors should look past the daily tariff headlines and focus on the businesses themselves. How dependent are they on the US market? Where do their inputs come from? Can they pass higher costs on to customers? And most importantly, does the trade war change the company’s long-term competitive advantage?
A trade war isn’t a contest where one country wins and the other loses. When two highly integrated economies make it more expensive to do business with each other, both sides pay a price. For investors, the challenge is figuring out which companies can absorb that price – and which can’t.
For now, let’s put the trade war aside and see how investors responded to this week’s developments, which way the winds were blowing across the markets, and how they affected my three portfolios.
Items that may only interest or educate me ….
Canadian Economic news, US Economic news, ….
Canadian Economic news
This past week’s key economic data that the Bank of Canada (BoC) considers when deciding whether to raise or lower the interest rate.
Canadian Market Volatility
Canada’s version of the market’s “fear gauge” is the S&P/TSX 60 VIX Index (VIXC). Like the US volatility index, it measures expected volatility in the Canadian stock market over the next 30 days. Higher readings indicate greater uncertainty, while lower readings point to calmer conditions.
The VIXC opened the week at 13.84, up from the previous week’s close of 13.33 after Canada imposed tariffs on select American goods in response to US tariffs on Canadian products. The fear gauge remained mostly between 14 and 15 but gradually moved higher as the week progressed. Concerns about possible rate hikes eventually pushed it above 15 before it settled at 14.21.
Overall, the VIXC remained relatively subdued, suggesting Canadian investors weren’t overly concerned about the risks facing the market. Even renewed trade tensions and the heightened tensions in the Middle East failed to push volatility significantly higher.
Note: The VIXC typically trades at lower levels than the VIX, partly because of the different makeup of the Canadian and US markets. The S&P 500 has a much larger weighting in technology, while the TSX has greater exposure to financials, energy and materials. Because these sectors respond differently to economic conditions and commodity prices, the two indexes can have different levels of expected volatility.
US Economic news
This past week’s key data points that the Federal Reserve (Fed) considers when deciding whether to raise or lower the interest rate.
Consumer Price Index (CPI)
The Labor Department’s Bureau of Labor Statistics August CPI report was mixed, with some signs of progress but enough inflation pressure to keep the Fed on its toes. Headline, or all items, CPI rose 0.4% in August after increasing 0.1% in July, while the annual rate held at 3.4%. Both figures matched analysts’ expectations.
Core CPI, which excludes the more volatile food and energy categories, was less encouraging. Core prices rose 0.3%, slightly above expectations and up from July’s 0.2% increase. It was the biggest monthly increase since April. However, the annual core rate continued to cool, easing to 2.4% from 2.5%.
Energy prices provided another reminder of how quickly geopolitical events can show up in inflation data. Fuel oil (heating oil) prices jumped 10.1% in August and were up 52.0% from a year earlier, reflecting higher global oil prices. Utility gas (natural gas supplied to homes and businesses) prices fell 1.1%, while medical care commodities posted the biggest annual decline, falling 2.7%.
Shelter costs, the largest component of CPI and a historically sticky source of inflation, rose 0.3% after increasing 0.1% in July. On an annual basis, shelter inflation continued to cool, easing to 3.0% from 3.3%, providing another encouraging sign.
The problem is that rising oil prices could make that progress against inflation harder to sustain. The Iran conflict and resulting surge in oil prices are now feeding directly into inflation, while higher energy costs can eventually spread to transportation and other goods and services.
For the Fed, the latest data makes a September rate hike more likely. The report didn’t show an inflation explosion, but rising energy prices and a pickup in monthly core inflation give the Fed another reason to be cautious while inflation remains above its 2% target.
Consumer Sentiment Index (CSI)
The University of Michigan’s preliminary CSI for September came in well below expectations at 47.8, down from August’s 51.7. That’s a 7.5% decline from the previous month and 13.2% from a year ago. Analysts had expected a reading of 51. If the reading holds, it would be the second-lowest level in the index’s decades-long history.
The Current Economic Conditions Index, which measures views of finances and the job market, fell to 50.9 from 51.9 in August and is down 15.7% from a year ago. The Expectations Index, which reflects the outlook for the next six months, fell sharply to 45.8 from 51.5 and is down 11.4% year over year.
Resurgent fuel prices and renewed trade tensions are weighing on consumer sentiment. There are also concerns that elevated inflation could become entrenched in consumers’ expectations, making future inflation harder to control. Workers may push for higher wages, while businesses may raise prices to offset rising costs.
Combined with this week’s CPI report, which showed inflation remaining above the Fed’s 2% target, the CSI presents an awkward situation for Fed officials. Consumers are becoming more pessimistic while their inflation expectations are rising. Weaker confidence could weigh on spending and growth, while rising inflation expectations make it harder for the Fed to cut rates.
American Market Volatility
The VIX, often called the market’s “fear gauge,” measures expected S&P 500 volatility over the next 30 days. Higher readings signal greater uncertainty, while levels above 20 are typically associated with elevated volatility.
The VIX opened the week at 15.56, up from the previous Friday’s close of 14.53, and gradually climbed above 18 as hostilities between the US and Iran intensified. Rising oil prices renewed concerns about inflation and the possibility of higher interest rates, while inflation data later in the week added to the uncertainty. However, lower oil prices at the end of the week eased investor concerns, sending the VIX down to 15.84, very close to where it started the week.
The VIX remained below 20, so volatility was still relatively contained. While the index ended only slightly higher than where it started, its move above 18 during the week showed that investors were becoming more uneasy. Rising oil prices, inflation and interest-rate uncertainty were clearly getting their attention.
Weekly Market and Portfolio Review
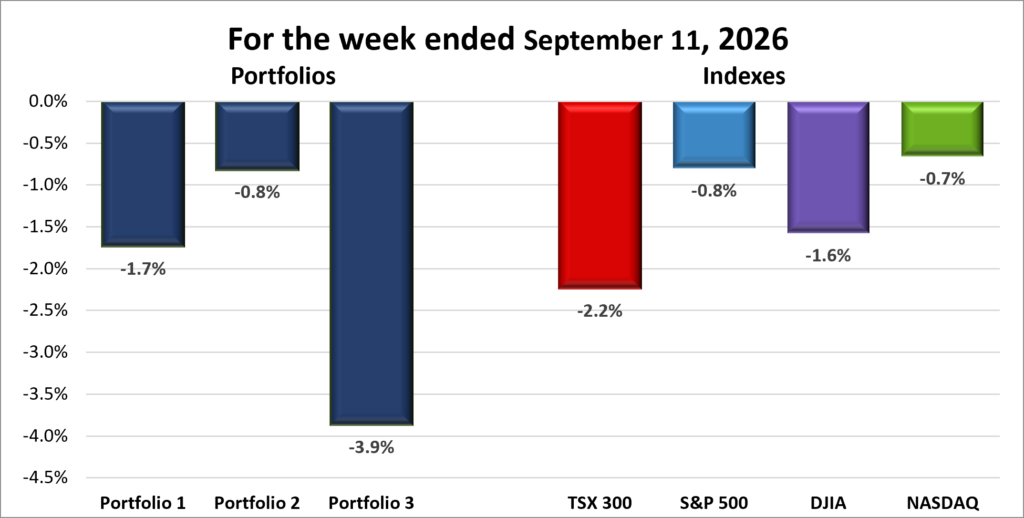
For the week, the TSX (SPTSX) plunged 2.2%, the S&P 500 (SPX) declined 0.8%, the DJIA (INDU) dropped 1.6% and the Nasdaq (CCMP) dipped 0.7%.
| Index | Weekly Streak |
| TSX: | 4 – week losing streak |
| S&P: | 1 – week losing streak |
| DJIA: | 2 – week losing streak |
| Nasdaq: | 1 – week losing streak |
 The Labour Day-shortened week got off to a rough start, with September already living up to its reputation as one of the weakest months for both Canadian and American stocks. All four major indexes, the Toronto Stock Exchange Composite Index (TSX), S&P 500 Index (S&P), Dow Jones Industrial Average (DJIA), and Nasdaq Composite Index (Nasdaq), stretched their respective daily losing streaks to four before finally snapping them at the end of the week. The TSX matched its longest losing streak since April 2026, while the S&P had its worst four-day stretch since June.
US stocks came under pressure as a sharp rise in oil prices revived inflation concerns and pushed US government bond yields higher. After spending much of August moving sideways near record highs, the market suddenly had a reason to pull back.
During the week, oil prices spiked above US$108 a barrel amid supply concerns and escalating tensions in the US /Israeli war with Iran, which has now stretched into its seventh month. Rising oil prices are adding to inflationary pressure at a time when investors are already questioning how much room the Fed has to lower interest rates. Oil prices cooled at the end of the week, but Brent crude remained above US$100.
That concern was reinforced later in the week when US wholesale prices accelerated and consumer prices climbed, although both came largely in line with expectations. With inflation continuing to move higher, the reports strengthened the case for a rate hike at next week’s Fed meeting. Investors appeared relieved that the Fed was likely to act against rising inflation rather than wait for further evidence that price pressures were becoming entrenched.
Bond markets reflected those concerns, with the 10-year Treasury yield climbing to about 4.95%, its highest level since 2023. Higher yields can make stocks less attractive by increasing the return investors can earn from relatively safer bonds, while also raising borrowing costs for companies and households. Technology and growth stocks were particularly vulnerable, although the weakness was broader than just the artificial intelligence (AI) trade.
In Canada, the TSX followed American markets lower for most of the week, but Canada’s heavy exposure to energy made the impact of higher oil prices more complicated. Energy stocks initially benefited as crude climbed above US$100 a barrel, but broader concerns about inflation and interest rates outweighed that support.
Canada’s retaliatory tariffs on US goods took effect first thing Tuesday morning, adding another layer of uncertainty for Canadian businesses. The tariffs, ranging from 15% to 50% on C$27.6 billion of US imports, followed the 50% tariffs the US imposed on C$27.6 billion of Canadian goods in August after several rounds of negotiations collapsed.
Financial stocks also came under pressure as bond yields rose and investors reassessed the interest-rate outlook. Gold and other commodity stocks added to the weakness as higher yields weighed on prices. Technology stocks provided some relief late in the week, helping the TSX recover part of its losses as oil prices cooled and the US CPI report came in as expected.
The market’s reaction suggests this week’s decline was driven by oil prices and changing expectations for inflation and interest rates. Cooler oil prices and an in-line CPI report helped stocks recover at the end of the week, but not enough to erase the earlier losses. The week’s action also showed how higher oil prices can provide a direct boost to the energy sector, but when those gains are accompanied by inflation and interest-rate concerns, they can become a broader headwind. This week, that broader pressure outweighed the benefit to energy stocks. The Fed’s decision next week should provide the clearest indication of whether investors are simply seeing a pullback after a strong summer or the beginning of something more significant.
| Portfolio | Weekly Streak |
| Portfolio 1: | 2 – week losing streak |
| Portfolio 2: | 2 – week losing streak |
| Portfolio 3: | 2 – week losing streak |
Last week’s performance, or should I say underperformance, wasn’t particularly good for any of my portfolios. After this week, though, I’d gladly take those results back. This was a difficult week across the board, with more than 70% of the holdings in each portfolio losing ground.
Even some of my oil companies fell despite the surge in crude prices, which initially surprised me. But it turns out that concerns about inflation and higher interest rates, and the resulting increase in borrowing costs, outweighed the benefit of higher oil prices. It also didn’t help that the largest holding in each portfolio finished lower: Nvidia (NASDAQ: NVDA) in Portfolios 1 and 3, and Bank of Nova Scotia (TSE: BNS) in Portfolio 2.
Portfolio 1 had a tough week, falling 1.7%. Losses were widespread, with only 28% of its holdings advancing, although that was still the best showing of the three portfolios. Celestica (TSE: CLS) was the standout, gaining 10%, while Celsius Holdings (NASDAQ: CELH) fell 13%, Grab Holdings (NASDAQ: GRAB) lost 11%, and Kraken Robotics (TSE: PNG) dropped 10%.
Shopify (TSE: SHOP) also took a hit, falling 11% as investors worried that AI could eventually become a competitor to some of the services it provides.
Portfolio 2 was the best of a bad lot, falling 0.8% as only 23% of its holdings finished higher. Its more balanced composition helped limit the damage. There were no big winners, but fortunately there were no big losers either. The only real positive, and I’m reaching here, was that it outperformed all four major indexes.
Portfolio 3 had the toughest week, plunging 3.9%. Like Portfolio 2, only 23% of its holdings advanced, but the weakness was particularly noticeable among its AI-related companies and two space holdings. With Shopify’s 11% decline the only individual loss exceeding 10%, the damage came from a broad-based slide rather than one or two companies dragging the portfolio lower.
There was at least one positive development. GE Aerospace (NYSE: GE) announced it was acquiring Consolidated Precision Products, an aircraft castings manufacturer, for nearly US$12 billion. The acquisition should improve GE’s access to critical manufacturing components and strengthen its position in an important part of the aerospace supply chain.
All in all, not a good week at all. Hopefully, all four indexes ending the week on a winning note is a sign of better things to come, and all three portfolios can get back on the winning track next week. Onward and upward!
Companies on the Radar
 Once again, no new companies made their way onto my stock radar this week. However, I decided it was time to remove TerraVest Industries (TSE: TVK) from the list. When it first caught my attention in late 2024, TerraVest was in an aggressive growth phase, expanding largely through acquisitions, and its share price was rising just as quickly. Since then, the growth story has lost some of its momentum, while the share price has been trending lower. After nearly two years on and off my radar, I think it makes sense to move on and make room for other opportunities.
With TerraVest’s removal, my radar list is now down to the four companies below.
- Mattr Corp. (TSE: MATR): A small cap Canadian industrial technology company that designs and manufactures specialized infrastructure products using advanced materials. The company may not be familiar to most investors, but its products support industries such as energy, electrification, communications, transportation, and water management. From composite pipes and underground storage tanks to specialized wire and cable solutions, Mattr creates products designed to be lighter, more durable, and resistant to harsh environments. Think of it as a behind-the-scenes supplier helping modern infrastructure operate more safely and efficiently, generating revenue by selling specialized products to industrial customers around the world.
- Capital Power Corporation (TSX: CPX): A mid cap Canadian power producer that generates electricity from a mix of natural gas, wind, solar and battery storage across North America. With electricity demand rising rapidly from AI data centres, industrial growth and electrification, Capital Power is expanding its natural-gas generation while adding renewable and storage capacity. Its recent agreement to supply 250 MW of power to a new Meta (NASDAQ: META) data centre in Alberta for more than 10 years highlights how the AI boom is creating opportunities beyond the technology companies building the data centres themselves.
- Emera Incorporated (TSX: EMA): A large cap Canadian energy company that owns regulated electric and natural gas utilities serving about 2.6 million customers across Canada, the US and the Caribbean. Its utilities provide a relatively stable source of revenue while Emera invests billions in expanding and modernizing its power networks. With electricity demand expected to grow as AI data centres, industrial activity and electrification increase, Emera could benefit from the long-term need for more reliable power.
- S&P Global (NYSE: SPGI): A large cap American company and one of the world’s most important financial information companies. Most investors know it for the S&P 500 Index, but the business also provides credit ratings, market data, analytics, and research used by banks, corporations, governments, and investors worldwide. Think of it as one of the key information providers that helps global financial markets function, generating revenue through subscriptions, licensing fees, and rating services.
As always, these are not buy recommendations. Make sure to do your own research and choose investments that fit your personal financial goals.
The Radar Check was last updated September 11, 2026.


Portfolio Update
Portfolio 2
Sold: Supremex (TSE: SXP) When I invested in Supremex in August 2023, my reasons were diversification, relatively low-risk and steady growth, a modest dividend and the expectation that its packaging business would benefit from the continued growth of e-commerce. Three years later, the investment thesis hasn’t played out as expected. Revenue, net income and free cash flow have all declined, while the share price has fallen almost 40%. More importantly, the business is no longer providing the combination of steady growth and relatively low risk that attracted me in the first place. With the original thesis weakened, I decided it was time to put my money to better use elsewhere.
That’s a wrap for this week, thanks for reading – may your portfolio stay green and your dividends steady. See you next time!