
The AI Revolution: Understanding the Technology Behind the Investment Boom
Part 5: What Are AI Capabilities?
Over the past four weeks, we’ve explored what artificial intelligence (AI) is, how AI models learn, the infrastructure required to build them, and why companies are spending hundreds of billions of dollars on the technology. But there’s an important question we haven’t answered yet: What can all this technology actually do?
The AI Revolution Series
- Part 1: What Is Artificial Intelligence? – What AI is, how it differs from human intelligence, and why today’s AI doesn’t think like people do.
- Part 2: What Is Artificial Intelligence? – What training means, how AI models learn from data, and why training requires enormous computing power.
- Part 3: What Does It Take to Build AI? – The chips, memory, networking, data centres, and electricity that make AI possible.
- Part 4: Why Does AI Cost So Much? – Why building and operating AI requires enormous investment, and why companies are willing to spend hundreds of billions to avoid falling behind.
- Part 5: What Are AI Capabilities? – The things AI can increasingly do, from understanding language and recognizing images to generating content, solving problems, and taking actions.
- Part 6: Why Are Companies Racing to Build AI? – How AI can improve productivity, reduce costs, create new revenue, and give companies a competitive advantage—and why businesses fear falling behind.
- Part 7: Investing in the AI Ecosystem – How investors can participate in the AI revolution, where companies fit into the ecosystem, and why AI exposure alone doesn’t make a stock a good investment.
This is where AI capabilities come in. Simply put, they are the things an AI system is able to do. Today’s AI can understand and generate language, recognize images, analyse information, create content, solve increasingly complex problems, and even take actions on our behalf.
One of the most familiar capabilities is understanding and generating language. AI can answer questions, summarize documents, translate languages, write and edit text, and carry on increasingly sophisticated conversations. This is the technology behind tools such as OpenAI’s ChatGPT, Alphabet’s (NASDAQ: GOOGL) Gemini, and Anthropic’s Claude. But the real value isn’t simply that AI can write an email or answer a question. It can process information at a scale and speed that would be difficult for a person to match.
Consider investment research. An investor could give an AI system a company’s annual report, earnings releases, investor presentations, and recent news. The AI could summarize financial performance, identify changes in revenue and margins, compare management’s latest comments with previous guidance, and highlight potential risks or opportunities. More advanced systems can also work with financial databases to calculate ratios and examine historical data.
That doesn’t mean AI can reliably tell an investor which stock to buy. Capability and accuracy are two different things. AI can process enormous amounts of information, but it can still misunderstand information, make factual errors, or draw incorrect conclusions. AI can be a powerful research assistant without replacing human judgment.
AI is also developing the ability to see and understand images. It can identify objects in photographs, read documents, interpret charts, and analyse video. A retailer, for example, could use AI to identify products that are out of stock, while a manufacturer could use it to inspect products for defects.
Another major capability is generating new content. Generative AI can create text, images, audio, video, and computer code based on instructions from a user. It’s important to remember that generative AI is only one part of AI. Other systems are designed to predict, classify, or detect things rather than create new content.
AI is also becoming better at solving problems and working through complex tasks. Newer models can break problems into multiple steps, analyse information, compare alternatives, solve mathematical problems, write and debug code, and assist with research. A company could, for example, ask AI to investigate why sales have fallen in a particular region. The system could compare product performance, examine customer behaviour, and identify possible explanations.
Perhaps the most significant development is AI’s growing ability to take action rather than simply provide an answer. These systems, often called AI agents, can increasingly use external tools, access information, interact with software, and carry out multiple steps to accomplish a goal.
Cybersecurity provides a good example. A human security analyst might need to investigate suspicious activity, determine whether it represents a genuine threat, and decide how to respond. An AI-powered security system can potentially monitor activity continuously, investigate suspicious behaviour, and take defensive action in seconds. Companies such as CrowdStrike (NASDAQ: CRWD) and Cloudflare (NYSE: NET) are developing increasingly automated security capabilities that can detect and respond to threats at machine speed.
This illustrates the difference between an AI system that simply answers a question and an AI agent that can observe, decide, and act.
For investors, that’s where AI capabilities become particularly important. The economic value of AI won’t come simply from how impressive a chatbot is. It will come from what businesses can do with these capabilities. If AI allows a company to serve more customers, develop products faster, automate routine work, reduce costs, or allow employees to accomplish more, AI becomes an economic tool rather than simply an interesting technology.
The more capable AI becomes, the greater its potential value – and the greater the competitive advantage for companies that learn how to use it effectively.
Next week, we’ll look at why companies are racing to build AI capabilities of their own, and why the fear of being left behind may be just as powerful a force behind today’s AI spending as the potential rewards. But AI isn’t the only thing moving markets. So, let’s see which way the winds were blowing this week and how they impacted my three portfolios.
Items that may only interest or educate me ….
Canadian Economic news, US Economic news, ….
Canadian Economic news
This past week’s key economic data that the Bank of Canada (BoC) considers when deciding whether to raise or lower the interest rate.
Consumer Price Index (CPI)
Statistics Canada released its July consumer inflation data, showing headline inflation accelerated during the month, largely because of higher gasoline prices. Monthly inflation rose 0.5% after falling 0.4% in June, while the annual inflation rate increased to 3.0% from 2.8%. That puts headline inflation right at the top of the Bank of Canada’s 1%–3% target range. Analysts had expected monthly inflation to rise 0.5% and the annual rate to reach 2.9%.
Looking beneath the headline number, clothing and footwear was the only major category to decline during July, falling 1.0%. At the other end of the spectrum, gasoline prices posted the largest monthly increase, rising 3.6%. Compared with a year earlier, gasoline prices were up a striking 25.7%. Household operations, furnishings and equipment had the smallest annual increase, rising just 0.4%. Shelter costs, which include rent and mortgage interest, continued to edge higher, increasing 0.1% during the month and 1.3% over the past year.
Core inflation, which excludes the more volatile food and energy categories to provide a clearer picture of underlying price pressures, remained relatively stable. Prices excluding food and energy rose 0.4% during July and were 1.9% higher than a year earlier. In other words, the headline number moved higher, but the underlying inflation trend didn’t really change.
That distinction is important. A 3.0% headline CPI reading isn’t what the Bank of Canada wants to see, particularly with inflation now at the upper end of its target range. But higher gasoline prices, rather than broad-based price increases, were largely responsible for July’s acceleration. For now, the underlying inflation picture remains much more reassuring.
The BoC has held its benchmark interest rate at 2.25% for six straight meetings, and analysts expect this latest inflation data to give them another reason to leave rates unchanged at their September meeting.
Retail Sales
Statistics Canada reported that Canadian retail sales rose a stronger-than-expected 0.6% in June, following a 1.0% gain in May. Analysts had expected an increase of 0.4%. It was the sixth consecutive monthly gain, with sales in March, April and May also revised slightly higher. Year over year, retail sales increased 5.2%, down from 5.9% in May.
Clothing, clothing accessories, shoes, jewellery, luggage and leather goods retailers led the monthly gains, with sales rising 3.1%. Gasoline stations and fuel vendors posted the largest decline, falling 4.1% as lower fuel prices reduced sales. Over the past year, however, gasoline sales were up 20.2%, largely because of higher prices rather than increased fuel consumption. Furniture, electronics and home furnishings stores remained the weakest major category, with sales falling 5.6%.
For a better picture of underlying consumer spending, analysts also look at core retail sales, which exclude the more volatile gasoline, motor vehicle and parts categories. Core sales rose 1.2% in June after climbing 0.9% in May, marking their third consecutive monthly gain. Year over year, core retail sales increased 3.9%, down from the pace of 4.3% in May.
Looking ahead, Statistics Canada’s advance estimate suggests retail sales fell 0.8% in July, considerably worse than the 0.5% decline analysts had expected. If confirmed, it would be the first monthly decline since the end of 2025, ending the six-month streak of growth.
Overall, Canadian consumers remained relatively resilient through the second quarter, although the preliminary July decline suggests higher prices, geopolitical tensions and ongoing trade uncertainty with the US may be starting to weigh on spending. Consumer spending is a major part of Canada’s economy, so a sustained slowdown would put pressure on businesses that depend on consumer demand and could give the BoC another reason to keep interest rates unchanged – or eventually consider cutting them. For now, June’s strong sales numbers suggest consumers are still holding up reasonably well, but the preliminary July decline is worth watching.
Canadian Market Volatility
Canada’s equivalent of the US’s VIX is the S&P/TSX 60 VIX Index (VIXC). Like its American counterpart, it measures how much volatility investors expect in the Canadian stock market over the next 30 days. Higher readings signal greater uncertainty, while lower readings suggest investors expect calmer market conditions.
The VIXC typically trades at lower levels than the VIX, partly because of the different makeup of the Canadian and US markets. The S&P 500 has a much larger weighting in technology companies, while the TSX has greater exposure to financials, energy and materials. These sectors tend to respond differently to economic conditions and commodity prices, resulting in different levels of expected volatility.
The VIXC opened the week at 14.05, up from the previous week’s close of 13.58, but quickly slipped toward 13 after Canada’s inflation report showed that higher oil prices were largely responsible for the increase in headline inflation. With little other economic or corporate news to unsettle investors, the fear gauge spent most of the week between 13 and 14. As the Saturday deadline for reaching a US trade agreement approached, however, uncertainty began to creep back in, pushing the VIXC up to 13.56 by Friday’s close.
Despite the late-week increase, Canada’s fear gauge remained relatively subdued, suggesting investors weren’t overly concerned about either inflation or the broader market. The approaching trade deadline, however, gives them something new to worry about.
US Economic news
This past week’s key data points that the Federal Reserve (Fed) considers when deciding whether to raise or lower the interest rate.
FOMC minutes
The Federal Open Market Committee (FOMC) released the minutes of its July 28–29 meeting this week, providing a look at how Fed officials were thinking about interest rates at the time. The Fed left its benchmark rate unchanged at 3.50%–3.75%, but the decision was more divided than usual, with three of the 12 voting members calling for a 0.25% rate hike.
The most important revelation was that support for higher rates extended beyond the three officials who formally dissented. Several officials argued that waiting too long to raise rates could eventually require larger and more disruptive increases. That is a decidedly hawkish message – meaning policymakers are more concerned about inflation and more inclined to keep interest rates high or raise them further.
Not everyone favoured higher rates immediately. Some officials preferred to wait for more economic data before changing policy, particularly because the effects of tariffs, energy prices and other supply shocks were difficult to assess.
It’s also important to remember that the minutes describe what policymakers thought at the time of the July meeting. Since then, the Fed has received additional inflation and economic data, including some relatively softer readings.
Overall, the July minutes revealed that the debate inside the Fed has shifted from when to cut rates to whether rates may need to remain high for longer – or even go higher – if inflation doesn’t continue to fall.
American Market Volatility
The VIX – often called the market’s “fear gauge” – measures how much volatility investors expect from the S&P 500 over the next 30 days. Higher readings generally indicate greater uncertainty and caution, while lower readings suggest a calmer market. Readings above 20 are typically associated with elevated volatility, while levels below 20 point to a relatively settled market.
The VIX opened the week at 14.98, up from the previous week’s close of 14.25, as the US-Iran MOU expired. Rising tensions in the Middle East, higher oil prices and rising US bond yields combined to unnerve investors, pushing the fear gauge as high as 16. Sentiment improved later in the week as the US government expanded its bond buyback programme and shifted toward economic measures aimed at ending the conflict with Iran. The VIX subsequently eased to 15.13 by Friday’s close.
Despite the mid-week spike, the VIX remained comfortably below 20 throughout the week, suggesting that while investors were becoming more cautious, they weren’t yet signalling widespread fear.
Weekly Market and Portfolio Review
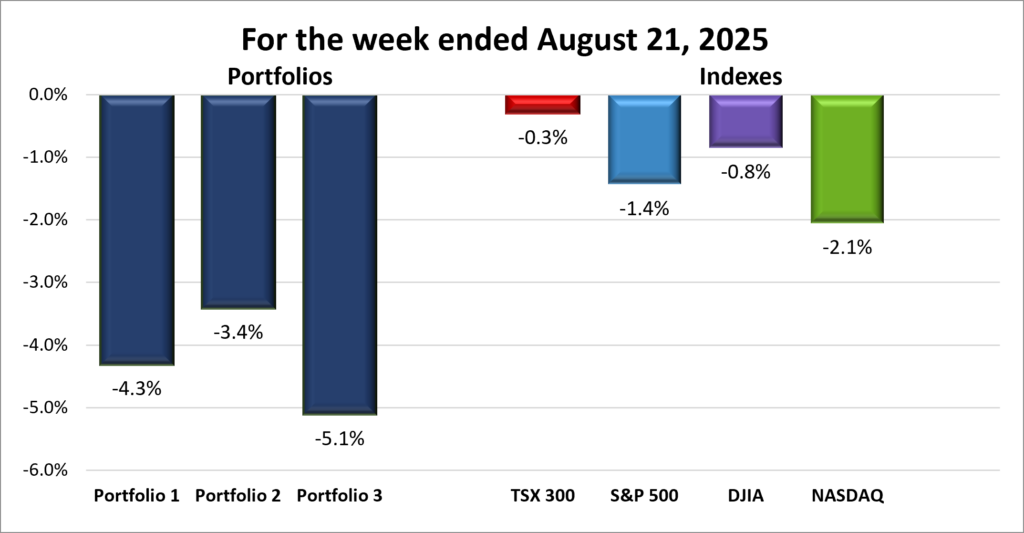
For the week, the TSX (SPTSX) slipped 0.3%, the S&P 500 (SPX) slid 1.4%, the DJIA (INDU) dropped 0.8% and the Nasdaq (CCMP) tumbled 2.1%.
| Index | Weekly Streak |
| TSX: | 1 – week losing streak |
| S&P: | 1 – week losing streak |
| DJIA: | 2 – week losing streak |
| Nasdaq: | 1 – week losing streak |
 Despite being a relatively quiet week for economic data, it was a difficult one for North America’s major stock indexes – the Toronto Stock Exchange Composite Index (TSX), the S&P 500 Index (S&P), the Dow Jones Industrial Average (DJIA), and the Nasdaq Composite Index (Nasdaq). After inflation concerns faded into the background the previous week following consumer and wholesale inflation data that came in as expected or better, they quickly returned to the forefront. The TSX, S&P and Nasdaq all saw their multi-week winning streaks snapped, while the DJIA extended its losing streak for another week. The good news was that all four indexes finished Friday higher, offering some relief after several days of selling.
Oil was the biggest catalyst. The expiration of the US-Iran Memorandum Of Understanding raised concerns about oil supplies and the continued closure of the Strait of Hormuz, pushing Brent crude higher for six straight days, ending the week above US$93 a barrel. Higher energy prices can feed into the broader cost of goods and services, making it harder for inflation to move lower and potentially limiting the Fed’s ability to cut interest rates. The potential for the US to impose 50% tariffs on selected Canadian goods added another inflation concern. While tariffs don’t necessarily create ongoing inflation, they can raise the prices of imported goods, providing another push in the wrong direction.
These inflation concerns pushed the 30-year US Treasury yield to its highest level since 2007. Higher yields make borrowing more expensive, and bonds relatively more attractive compared with stocks, putting pressure on stock prices, particularly technology companies whose share prices depend heavily on future growth.
The Fed added to the uncertainty when minutes from its July meeting showed a more divided and inflation-conscious central bank than investors had expected. Several officials had supported raising rates at the July meeting, while many indicated another increase could be necessary if inflation failed to move downwards towards the Fed’s 2% target. The minutes don’t mean a September rate hike is imminent, particularly given the softer inflation and employment data released since the meeting, but they reminded investors that further rate cuts are not guaranteed.
Canada faced the same inflation and interest-rate pressures, but the TSX had some very different forces at work. After reaching a record closing high the previous Friday, the index was pulled lower by hotter Canadian inflation which led to weakness in financial and technology stocks, and renewed trade uncertainty caused by the possibility of the US imposing 50% tariffs on another group of Canadian goods. Rising oil and gold prices provided some support.
Beneath the week’s volatility was a familiar tug-of-war: investors weighing continued economic strength against the risk of inflation and interest rates staying higher for longer. Looking ahead, all eyes will be on Nvidia’s second-quarter earnings next week, as investors look for signs that the AI boom still has room to run.
| Portfolio | Weekly Streak |
| Portfolio 1: | 1 – week losing streak |
| Portfolio 2: | 1 – week losing streak |
| Portfolio 3: | 1 – week losing streak |
It’s been a while since all three portfolios have had a week this rough. The last time I can remember anything comparable was probably during the 2022 bear market, when the three major US indexes were getting mauled and the TSX narrowly avoided bear-market territory. Even then, I don’t recall all three portfolios falling further than all four indexes in the same week. Unfortunately, this week managed to set that dubious record.
Portfolio 1 had a tough week, losing 4.3% of its value. It did have the highest percentage of weekly winners, but at just 37%, that isn’t saying much. Celsius Holdings (NASDAQ: CELH) provided the biggest bright spot, jumping 18%, while iShares S&P/TSX Global Gold Index ETF (TSE: XGD) gained 12% as gold prices climbed. But those gains weren’t enough to offset the damage elsewhere. Nvidia (NASDAQ: NVDA), the portfolio’s largest holding, fell 5%, while Celestica (TSE: CLS) dropped 13%, Navitas Semiconductor (NASDAQ: NVTS) fell 12%, and both Hammond Power Solutions (TSE: HPS.A) and Lattice Semiconductor (NASDAQ: LSCC) lost 10%.
Portfolio 2 was the best of the three, although “best” is doing some heavy lifting this week. It fell 3.4%, with losses spread across the portfolio as only 33% of the stocks managed a weekly win. Hammond Power Solutions was the notable exception, dropping 10%. Gains among the portfolio’s energy holdings helped cushion the broader weakness, once again showing the benefit of a more balanced portfolio with less exposure to the technology sector.
Portfolio 3 had the worst week, plunging 5.1%. That’s more than the combined 4.6% decline of the S&P, Nasdaq, DJIA and TSX. Even more remarkable, only 7% of its holdings finished the week higher, the lowest percentage since I began tracking weekly portfolio performance almost five years ago. That includes the 2022 bear market. Vertiv Holdings (NYSE: VRT) and MDA Space (TSE: MDA) both fell 12%, while Rocket Lab (NASDAQ: RKLB) and Corning (NYSE: GLW) dropped 11%. Unfortunately, there were no bright spots to report. ☹
No matter how you look at it, it was a week to forget. The good news is that one bad week doesn’t change the long-term picture. The potential for bad news next week is that Nvidia presents its second-quarter earnings. Given its importance to two of the portfolios and the broader technology sector, a disappointing report could make this week’s losses look downright respectable in hindsight.
Companies on the Radar
 This past week I trimmed my radar list with the departure of Perimeter Solutions (NYSE: PRM), the American specialty chemicals company best known for its wildfire retardants. There is certainly no shortage of demand for products that help fight a growing number of increasingly destructive wildfires. If the market continues to expand, however, it could attract larger chemical companies with much deeper pockets, potentially taking a bite out of Perimeter’s market share. If growing my wealth weren’t the goal of my investments, I’d be happy to be an owner of this mid-cap company, which has plenty of runway to grow. But since it is, I have to consider the risks as well as the opportunity.
With Perimeter Solutions off the list, the number of companies on my radar has now shrunk to five.
- Mattr Corp. (TSE: MATR): A Canadian industrial technology company that designs and manufactures specialized infrastructure products using advanced materials. The company may not be familiar to most investors, but its products support industries such as energy, electrification, communications, transportation, and water management. From composite pipes and underground storage tanks to specialized wire and cable solutions, Mattr creates products designed to be lighter, more durable, and resistant to harsh environments. Think of it as a behind-the-scenes supplier helping modern infrastructure operate more safely and efficiently, generating revenue by selling specialized products to industrial customers around the world.
- Capital Power Corporation (TSX: CPX): A mid cap Canadian power producer that generates electricity from a mix of natural gas, wind, solar and battery storage across North America. With electricity demand rising rapidly from AI data centres, industrial growth and electrification, Capital Power is expanding its natural-gas generation while adding renewable and storage capacity. Its recent agreement to supply 250 MW of power to a new Meta data centre in Alberta for more than 10 years highlights how the AI boom is creating opportunities beyond the technology companies building the data centres themselves.
- Emera Incorporated (TSX: EMA): A large cap Canadian energy company that owns regulated electric and natural gas utilities serving about 2.6 million customers across Canada, the US and the Caribbean. Its utilities provide a relatively stable source of revenue while Emera invests billions in expanding and modernizing its power networks. With electricity demand expected to grow as AI data centres, industrial activity and electrification increase, Emera could benefit from the long-term need for more reliable power.
- S&P Global (NYSE: SPGI): A large cap American company and one of the world’s most important financial information companies. Most investors know it for the S&P 500 Index, but the business also provides credit ratings, market data, analytics, and research used by banks, corporations, governments, and investors worldwide. Think of it as one of the key information providers that helps global financial markets function, generating revenue through subscriptions, licensing fees, and rating services.
- TerraVest Industries (TSE: TVK): A mid-cap Canadian industrial company that produces equipment for energy, storage, and transportation markets, including propane tanks, pressure vessels, and heating systems. It grows through a mix of organic expansion and acquisitions, serving steady, asset-heavy industrial niches across North America.
As always, these are not buy recommendations. Make sure to do your own research and choose investments that fit your personal financial goals.
The Radar Check was last updated August 21, 2026.


That’s a wrap for this week, thanks for reading – may your portfolio stay green and your dividends steady. See you next time!