
How to Look Beyond the Earnings Headline
Excerpt: Good earnings are one thing, but knowing how to read between the lines is another. This week, I look at how to compare results with expectations, assess management’s growth outlook and determine whether a stock’s share price already reflects an optimistic future. These three checks can help you look beyond the headlines and understand why even strong results don’t always lead to a rising share price.
Last week, I discussed why good earnings don’t always translate into a rising share price. A company can report higher revenue and profits yet see its shares fall if investors expected even better results, management signals slower growth ahead, or the stock price already reflects high expectations.
So how can you tell what investors expected, what management’s outlook says about future growth, and whether the share price already accounts for good news? Here are three things to look at before deciding what a company’s earnings really mean for investors.
1. How do results compare with expectations?
Rather than focusing only on whether revenue and earnings increased from the previous year, compare the results with analysts’ estimates. Financial websites such as Yahoo Finance often publish these estimates, although they can vary between providers and aren’t always available for smaller companies, particularly those listed in Canada.
Look at both revenue and earnings per share (EPS). A company can beat expectations on one and fall short on the other. The size of the difference matters, too. A small earnings beat is less impressive if revenue growth is slowing or profit margins are shrinking. Consider whether stronger sales and improved operations drove the results, or whether they benefited from a one-time gain or lower expenses.
If analysts’ estimates aren’t available, compare results with the same period last year, management’s previous guidance, if provided, and the company’s recent growth trends. These comparisons won’t reveal exactly what investors expected, but they can help you judge whether the business is gaining momentum or starting to slow.
2. What does management say about future growth?
Past results tell you what happened, but a stock’s price reflects expectations for what comes next. That’s why management’s outlook, often called guidance, can matter more than the latest earnings.
Read the earnings release and, if available, the earnings-call transcript. Look for forecasts for revenue, earnings, profit margins and demand. Is management raising, maintaining or lowering its outlook? Pay attention to why, whether it’s weaker customer demand, rising costs or delays in new products.
Don’t take optimism at face value. Strong sales pipelines, new contracts and growing customer demand can support expectations for future growth. Vague promises of better days ahead deserve more scrutiny. Forecasts are estimates, not guarantees.
3. Does the share price already reflect an optimistic outlook?
Even a company with strong results and promising growth prospects can be an expensive investment. A useful starting point is the price-to-earnings (P/E) ratio, which compares a company’s share price with its earnings per share. A higher P/E often signals that investors expect stronger future growth and are willing to pay more for each dollar of current earnings.
Compare the company’s P/E with its historical range and those of similar companies. A higher ratio may be justified by faster growth, stronger competitive advantages or more reliable earnings, but it can also leave less room for disappointment. If the stock has already climbed sharply ahead of an earnings report, investors may have priced in excellent results.
No single ratio tells you whether a stock is cheap or expensive. Growth prospects, profitability, debt and the reliability of future earnings all matter. The goal isn’t to find the lowest P/E, but to decide whether the share price is reasonable given what the company can realistically deliver.
Ultimately, you’re trying to look beyond the headline numbers and judge whether a company is performing well, has credible prospects for further growth and offers good value at its current price. Even when all three look promising, the share price may not rise. But understanding these factors can help you make a more informed decision about whether a stock deserves a closer look.
With that in mind, let’s look at what the central banks decided about interest rates, review this week’s economic reports, and see how the markets responded and what it all meant for my portfolios.
Items that may only interest or educate me ….
Canadian Economic news, US Economic news, ….
Canadian Economic news
This past week’s key economic data that the Bank of Canada (BoC) considers when deciding whether to raise or lower the interest rate.
Bank of Canada Rate Decision
The BoC raised its benchmark interest rate to 2.50% from 2.25%, citing the risk that higher energy costs could fuel broader inflation. The increase ended seven consecutive decisions to hold rates steady and marked the Bank’s first rate change since December 2025, when it last cut rates. It was also the first rate hike since July 2023.
The Bank’s main concern is that rising energy prices stemming from the Iran war could push up the cost of other goods and services. Governor Tiff Macklem warned that further rate increases may be necessary to prevent energy-driven inflation from becoming more widespread. Higher borrowing costs could also put additional pressure on Canada’s already struggling housing market.
The decision signals a shift in the Bank’s priorities. Despite a soft labour market and continued trade uncertainty, it judged that the risk of persistent inflation warranted action. The bigger concern now is whether inflation stays high enough to trigger further rate hikes, adding to the strain on an economy already facing headwinds.
For investors, the impact will depend on how higher borrowing costs affect individual companies’ earnings and growth prospects. Companies with manageable debt, reliable cash flow and the ability to pass higher costs on to customers may be better positioned to weather a prolonged period of elevated interest rates.
Gross Domestic Product (GDP)
Statistics Canada reported that Canada’s economy showed no growth for a second consecutive month in August, falling short of analysts’ expectations for a 0.2% increase. Preliminary data suggest the weakness continued into September, with GDP contracting by 0.1%. The figures point to a loss of economic momentum heading into the final quarter of the year.
Monthly results were mixed across industries. Goods-producing industries edged up 0.1%, led by manufacturing, which grew 0.3%, while Utilities fell 0.4%, the largest decline among the goods-producing sectors. Services-producing industries slipped 0.1%, as a 1.2% rebound in retail trade was outweighed by a 1.4% decline in wholesale trade.
Compared with a year earlier, services-producing industries grew 1.8%, led by a 5.5% increase in transportation and warehousing. Educational services declined 1.1%. Goods-producing industries expanded 1.0%, with Utilities leading the way at 3.8% growth, while agriculture, forestry, fishing and hunting contracted 5.5%.
The latest figures present a dilemma for the BoC. Weak economic growth gives BoC officials reason to be cautious about further rate increases, since higher borrowing costs can discourage spending, investment and economic activity. However, if higher energy prices spread to other goods and services, persistent inflation could still pressure the Bank to raise rates again, even as the economy struggles to grow.
Advance data suggest Canada’s economy grew 0.3% in the third quarter, equivalent to an annualized growth rate of approximately 1.3%. This marks a sharp slowdown from the 3.3% annualized growth recorded in the second quarter and falls short of the Bank’s 2% growth projection. These figures are preliminary, with official third-quarter GDP data due November 30.
Canadian Market Volatility
Canada’s version of the market’s “fear gauge,” the S&P/TSX 60 VIX Index (VIXC), measures expected volatility in Canadian stocks over the next 30 days. Higher readings signal greater uncertainty, while lower readings suggest calmer market conditions.
The VIXC opened the week at 14.85, matching the previous week’s close. It remained just below 15 for most of the week before briefly dipping below 14.50 after the BoC raised rates as expected and the Fed held steady. However, concerns about artificial intelligence (AI) spending soon spread to Canadian markets, pushing the fear gauge above 16.50 before it pulled back to close Friday at 16.03.
Note: The VIXC typically trades at lower levels than the VIX, partly because of the different makeup of the Canadian and US markets. The S&P 500 has a much larger weighting in technology, while the TSX has greater exposure to financials, energy, and materials. Because these sectors respond differently to economic conditions and commodity prices, the two indexes can have different levels of expected volatility.
US Economic news
This past week’s key data points that the Federal Reserve (Fed) considers when deciding whether to raise or lower the interest rate.
Consumer Confidence Index (CCI)
The Conference Board’s October report delivered a welcome surprise, with consumer confidence rising to 91.7 from an upwardly revised 84.2 in September. The 7.5-point gain was the largest monthly increase in several months, comfortably beating economists’ expectations of around 81.0 and bringing confidence to its highest level since June.
Both components of the index improved. The Present Situation Index, which measures consumers’ views of current business conditions and the labour market, climbed to 120.4 from an upwardly revised 111.8. The Expectations Index, which reflects the outlook for the next six months, rose to 72.6, partially reversing three consecutive monthly declines. While encouraging, it is still below 80, a level historically associated with increased recession risk when sustained.
Easing gasoline prices helped lift confidence, while consumers also became less pessimistic about business conditions and job prospects. However, concerns about living costs persist, and spending plans weakened for certain goods and services. In other words, consumers felt better about the economy but weren’t necessarily ready to open their wallets wider.
That matters because consumer spending is a major driver of US economic growth. If households remain cautious, improving confidence may not translate into stronger retail sales or corporate earnings.
October’s rebound is encouraging, but it doesn’t yet signal an all-clear for the US economy. With future expectations still weak and spending plans softening, the key question is whether confidence will continue to recover or this month’s improvement proves temporary.
Federal Reserve Open Markets Committee (FOMC) Rate Decision
As expected, the Fed held its benchmark interest rate steady at 3.75%–4.00%, pausing after September’s increase, the first in more than three years. The decision gives Fed officials more time to assess inflation before deciding on their next move.
The 10–2 vote revealed a divide among officials. Two members favoured another quarter-point increase, reflecting concern that current rates may not be enough to bring inflation back to the Fed’s 2% target.
The Fed upgraded its assessment of economic activity from solid to strong, citing resilient consumer spending, robust investment and strong productivity growth. Job gains have kept pace with the workforce, while unemployment has changed little. However, inflation remains elevated, leaving officials balancing a resilient economy against persistent price pressures.
Although the pause was widely expected, the possibility of another rate hike remains in focus. Some analysts anticipate an increase in December if inflation remains elevated and energy prices stay high. The Fed has made no commitment to that move, leaving its next decision dependent on incoming data.
For us Canadian investors, the Fed’s decision is important because US interest rates influence global bond yields, investor sentiment and the Canadian dollar. If US rates stay higher for longer, borrowing costs could stay elevated, putting additional pressure on interest-sensitive stocks on both sides of the border.
Inflation and Economic Growth
Personal Consumption Expenditures (PCE)
The Commerce Department’s Bureau of Economic Analysis (BEA) reported that the PCE Price Index, the Fed’s preferred measure of inflation, rose 0.5% in September, following a 0.3% increase in August. On an annual basis, inflation accelerated to 3.6% from 3.4%. Both figures matched analysts’ expectations.
The core PCE Price Index, which excludes the often-volatile food and energy categories to provide a clearer picture of underlying inflation, rose 0.3% in September, up from 0.2% in August. Its annual rate edged up to 3.1% from 3.0%, also matching analysts’ expectations.
While headline PCE captures overall price changes, core PCE helps show whether inflation pressures extend beyond food and energy. Both measures are still well above the Fed’s 2% inflation target.
Gross Domestic Product (GDP)
The BEA’s advance estimate for the third quarter of 2026 showed that real GDP grew at an annualized rate of 3.4%, accelerating from 2.2% in the second quarter and exceeding analysts’ expectations of 3.2%.
Consumer spending, business investment and government spending drove the acceleration. The AI build-out was a key driver of business investment, while declining exports and rising imports partly offset those gains. Since imports are subtracted when calculating GDP, higher imports reduce measured growth, even when they reflect strong domestic demand for foreign goods and equipment.
Analysis
Together, the reports paint a mixed picture of the American economy. Growth accelerated more than expected, but inflation continued to rise, while inflation-adjusted consumer spending stalled and real disposable income declined.
This creates a challenge for the Fed and consumers alike. Strong economic growth and persistent inflation could push the Fed to consider raising interest rates rather than cutting them, adding to borrowing costs and putting pressure on stock prices. Consumers, meanwhile, continue to face price increases that erode their purchasing power. For investors, the key question is whether inflation will ease without a significant slowdown in economic activity, giving the Fed room to hold rates steady or eventually cut them rather than raise them further.
American Market Volatility
The VIX, often called the market’s “fear gauge,” measures expected volatility in the S&P 500 over the next 30 days. Higher readings signal greater uncertainty, while levels above 20 are typically associated with heightened market volatility.
The VIX opened the week at 19.70, slightly above the previous Friday’s close of 19.45, but steadily declined as lower oil prices and bond yields eased inflation concerns. Optimism surrounding Anthropic’s IPO lifted investor sentiment further, bringing the fear gauge close to 16. However, concerns about AI spending resurfaced following disappointing earnings reports from some of the biggest technology companies, pushing the VIX above 22.4, touching its highest level since April. It ultimately closed Friday at 19.76.
Despite spending much of the week in decline, the VIX ended slightly higher than the previous week’s close, suggesting investor anxiety had increased marginally over the week. The late-week rebound also served as a reminder that optimism can quickly give way to renewed uncertainty.
Weekly Market and Portfolio Review
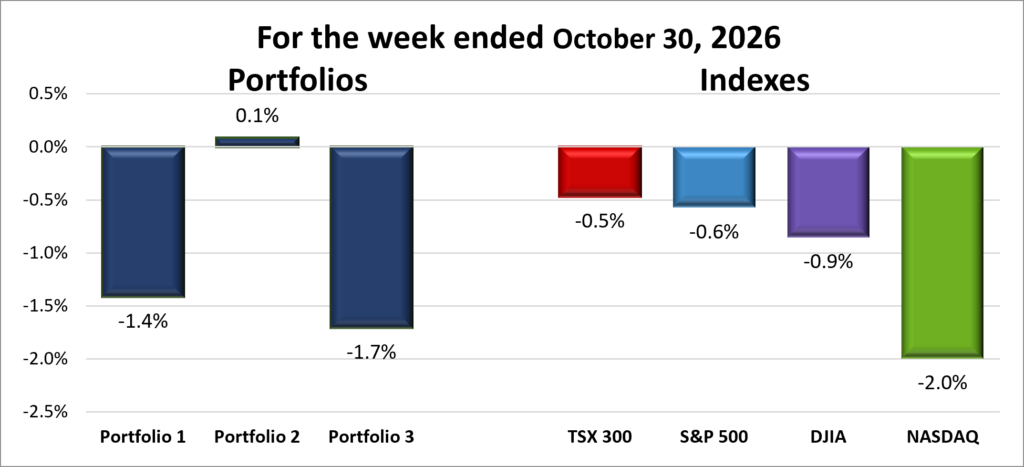
For the week, the TSX (SPTSX) dropped 0.5%, the S&P 500 (SPX) shed 0.6%, the DJIA (INDU) fell 0.9% and the Nasdaq (CCMP) plunged 2.0%.
| Index | Weekly Streak |
| TSX: | 2 – week losing streak |
| S&P: | 3 – week losing streak |
| DJIA: | 1 – week losing streak |
| Nasdaq: | 3 – week losing streak |
 It was a tale of two halves this week. The major indexes got off to a strong start, advancing for three consecutive days before reversing course late in the week. The selling gathered momentum, wiping out the earlier gains and leaving all four major North American indexes – the Toronto Stock Exchange Composite Index (TSX), the S&P 500 Index (S&P), the Dow Jones Industrial Average (DJIA) and the Nasdaq Composite Index (Nasdaq) – lower for the week.
US stocks initially gained momentum after Anthropic’s blockbuster IPO filing renewed enthusiasm for AI. The company’s extraordinary growth prospects highlighted the technology’s potential but also raised questions about the enormous spending needed to develop it. The filing helped reignite the AI rally, lifting technology shares, particularly semiconductor and data centre-related stocks. That optimism proved short-lived as investors shifted their focus to whether the billions being poured into AI infrastructure would generate sufficient returns.
Those concerns resurfaced as major technology companies reported earnings. Alphabet (NASDAQ: GOOGL) suffered its worst single-day decline on record, falling almost 13% after its results disappointed investors. Amazon (NASDAQ: AMZN) faced a similar reaction after its Thursday earnings report triggered a steep drop in its share price. Together, the sell-offs highlighted a growing divide between enthusiasm for AI’s potential and concern about the cost of realizing it. Investors increasingly want proof that companies can turn their AI investments into meaningful cash flow and profits.
Inflation and interest rates added to the pressure. The Fed held rates steady on Wednesday, although two officials favoured an immediate increase. Stronger-than-expected third-quarter GDP growth and elevated inflation reinforced expectations that the Fed is more likely to raise or hold rates than cut them. Oil prices climbing above US$112 a barrel added to inflation concerns, making near-term rate cuts increasingly unlikely. Despite broadly encouraging corporate earnings, renewed selling in major technology stocks weighed on the broader market.
In Canada, the BoC’s interest-rate decision, falling gold prices and weakness in mining and technology stocks shaped the week’s trading. The Bank raised its policy rate by 0.25% to 2.50%, its first increase since July 2023, as higher energy prices threatened to keep inflation elevated. The decision came as the economy continued to struggle, with GDP essentially unchanged for a second consecutive month. Persistent inflation pressures and weak economic growth leave the Bank facing a difficult balancing act.
Gold and mining stocks were another significant drag on the TSX. Gold prices fell as persistent inflation and expectations of higher US interest rates weighed on the metal. Technology stocks also weakened as concerns about AI spending spread to Canadian-listed companies following disappointing reactions to major US technology earnings. Energy stocks benefited from rising oil prices amid renewed concerns about supply disruptions in the Middle East, but gains weren’t enough to offset losses elsewhere. Higher oil prices may support energy producers, but they also add to inflation pressures and complicate the outlook for interest rates.
The week’s developments highlighted how quickly market sentiment can change. Investors haven’t abandoned the AI opportunity, but they are becoming more demanding about the financial returns needed to justify the enormous spending. At the same time, stronger US economic and inflation data, combined with surging oil prices, have increased concerns that interest rates could stay higher for longer. That combination left investors balancing the promise of AI and economic growth against the risks of rising costs and persistent inflation.
| Portfolio | Weekly Streak |
| Portfolio 1: | 3 – week losing streak |
| Portfolio 2: | 2 – week winning streak |
| Portfolio 3: | 3 – week losing streak |
 The week started so well. Markets were rising on a wave of AI optimism, and all three portfolios were on track for strong gains. Then the mood changed faster than you can say Alphabet. Concerns about AI spending dragged down AI-related stocks before spreading across the technology sector and weighing on the broader market.
Alphabet was the first major blow. As one of the market’s largest companies, its share price carries considerable weight. Following a disappointing earnings report, the stock plunged more than 13% at its worst, finishing the week almost 13% lower. The sell-off marked its worst single-day decline on record and brought the early-week rally to an abrupt halt.
Amazon was next. Its earnings missed expectations for both revenue and net income, sending the stock down almost 10% before it recovered most of the decline to finish the week down 3.8%. Together, the sell-offs reignited concerns about the enormous sums technology companies are pouring into AI and whether those investments will generate sufficient returns.
Microsoft (NASDAQ: MSFT) offered a brighter spot. It reported better-than-expected earnings, stronger-than-expected cloud growth, lower-than-expected capital spending and an upbeat outlook. Its share price initially jumped 10%, but the gains didn’t last. By the end of the week, it was down 0.9%, caught up in the broader technology sell-off.
There was a silver lining, though. Technology and communication services were the only sectors to decline in October, suggesting investors were rotating away from these areas rather than abandoning the stock market altogether. While the sell-off hurt my technology-heavy holdings, exposure to other sectors helped cushion the losses.
Portfolio 1 had a difficult week, falling 1.4% after a strong start. Alphabet’s and Amazon’s were the main culprits, while Cloudflare (NYSE: NET) fell 15% and Datadog (NASDAQ: DDOG) dropped 10%, adding to the downward pressure. With only 40% of its holdings finishing the week higher, gains elsewhere weren’t enough to offset the losses among its major technology holdings.
Portfolio 2 was the week’s best performer, edging up 0.1%. Half of its holdings finished higher, with rising oil prices helping its energy stocks. Its more diversified holdings and lower concentration in technology helped it weather the sell-off and finish in positive territory.
Portfolio 3, with its heavy exposure to AI-related companies, had the steepest decline, falling 1.7%. Although half its holdings finished higher, those gains weren’t enough to offset losses elsewhere. Cloudflare was a notable drag, falling 15%. Like Portfolio 1, Portfolio 3 was vulnerable to the reversal in technology stocks despite its strong start to the week.
All three portfolios were in positive territory heading into Friday, but the late-week sell-off changed the picture. Portfolio 2 managed to hold on for a small gain, while Portfolios 1 and 3 ended lower. It wasn’t the finish I’d hoped for after such a promising start, but that’s investing. You never know how the week will turn out. I’ll take my lumps and move on. 😊 Here’s hoping November brings less volatility and a return to steadier gains.
Companies on the Radar
 In what might be a first for me, a healthcare company has caught my attention: BioSyent (TSXV: RX). This relatively small Canadian company acquires or licenses established healthcare products and markets and distributes them, rather than spending heavily on developing new drugs. The business model has delivered an impressive track record of 64 consecutive profitable quarters through Q2 2026. In 2025, revenue grew 23%.
Beyond its consistent profitability, BioSyent has an established portfolio of pharmaceutical and healthcare products, growing earnings and management with a meaningful ownership stake. The company also repurchases shares and introduced a quarterly dividend in late 2022, both investor friendly actions. Its expansion into oral health offers another avenue for growth beyond its traditional pharmaceutical business.
BioSyent’s established business and track record make it an interesting candidate for further research, particularly compared with speculative drug-development companies. I’ll be taking a closer look to determine whether its growth prospects and rising dividend make it an attractive investment at today’s share price.
With this latest addition, my radar list now stands at six companies.
- Mattr Corp. (TSE: MATR): A small cap Canadian industrial technology company that designs and manufactures specialized infrastructure products using advanced materials. The company may not be familiar to most investors, but its products support industries such as energy, electrification, communications, transportation, and water management. From composite pipes and underground storage tanks to specialized wire and cable solutions, Mattr creates products designed to be lighter, more durable, and resistant to harsh environments. Think of it as a behind-the-scenes supplier helping modern infrastructure operate more safely and efficiently, generating revenue by selling specialized products to industrial customers around the world.
- Capital Power Corporation (TSX: CPX): A mid cap Canadian power producer that generates electricity from a mix of natural gas, wind, solar and battery storage across North America. With electricity demand rising rapidly from AI data centres, industrial growth and electrification, Capital Power is expanding its natural-gas generation while adding renewable and storage capacity. Its recent agreement to supply 250 MW of power to a new Meta (NASDAQ: META) data centre in Alberta for more than 10 years highlights how the AI boom is creating opportunities beyond the technology companies building the data centres themselves.
- Ingredion (NYSE: INGR): A mid-cap American ingredient manufacturer that turns plant-based raw materials into starches, sweeteners, fibres, and specialty ingredients used in thousands of everyday products. Its customers span food and beverage, animal nutrition, brewing, and industrial markets. With 10 consecutive years of dividend growth, Ingredion could provide an interesting counterbalance to the more growth-oriented companies in my portfolios.
- S&P Global (NYSE: SPGI): A large cap American company and one of the world’s most important financial information companies. Most investors know it for the S&P 500 Index, but the business also provides credit ratings, market data, analytics, and research used by banks, corporations, governments, and investors worldwide. Think of it as one of the key information providers that helps global financial markets function, generating revenue through subscriptions, licensing fees, and rating services.
- Domino’s Pizza (NASDAQ: DPZ): One of the world’s largest pizza chains, with more than 22,000 locations across over 90 markets. Most are independently owned franchises, generating recurring royalties and fees, while Domino’s also sells food and supplies to franchisees. Its strong brand, digital ordering and efficient delivery model support growth. With more than 13 consecutive years of dividend increases, a high double-digit dividend growth rate and a payout ratio below 50%, Domino’s could offer a relatively stable, cash-generating business to balance the higher-growth companies already in the portfolios.
As always, these are not buy recommendations. Make sure to do your own research and choose investments that fit your personal financial goals.
The Radar Check was last updated October 30, 2026.


That’s a wrap for this week, thanks for reading – may your portfolio stay green and your dividends steady. See you next time!