During the May 31 Weekly Update post, I mentioned my preference for direct ownership of stock in a company rather than indirect ownership through Depositary Receipts. When I got back into investing in 2016, I was not familiar with depository receipts. My guess is that if you are new to investing you are not familiar with them. So, let’s take a closer look at them.
What are Depositary Receipts?
Depository receipts (DRs) are a popular way for investors to gain exposure to foreign companies without dealing with the complexities of international markets. These financial instruments represent shares in a foreign company and trade on domestic stock exchanges, making them accessible to domestic investors.
Here’s how they work: A depository bank purchases shares of a foreign company and holds them in custody. In return, the bank issues depository receipts, which are traded on local exchanges like any other stock. This allows investors to buy shares in international companies through familiar domestic channels.
One of the key benefits of depository receipts is convenience. Investors can diversify their portfolios internationally without needing to open foreign brokerage accounts or navigate foreign regulations. Additionally, depository receipts are often denominated in the investor’s local currency, reducing the complexities of currency conversion.
However, it’s important to be aware of the potential downsides. While DRs simplify international investing, they still carry risks. These include political and economic instability in the foreign company’s home country, currency fluctuations, and potential differences in accounting and regulatory standards. Furthermore, depository banks may charge fees for their services, which can impact overall returns.
In summary, depository receipts offer a practical and accessible way for investors to gain international exposure, providing the benefits of global diversification while trading in familiar local markets. As always, it’s crucial to understand the specific risks and costs involved, and consulting with a financial advisor can help ensure that depository receipts align with your investment goals.
What types of DR are available to purchase?
There are two main types of depository receipts: American Depository Receipts (ADRs) and Global Depository Receipts (GDRs). ADRs are issued by US banks and traded on US exchanges, such as the NYSE or NASDAQ, while GDRs are typically listed on European exchanges and can be traded in multiple markets.
American Depository Receipts
ADRs are issued by banks in the United States and represent ownership in a foreign company’s shares that are traded on a US stock exchange. The first American Depositary Receipt (ADR) was created in 1927 by the predecessor of JPMorgan Chase & Co. (NYSE: JPM), Guaranty Trust. This innovation allowed American investors to buy shares of a British retailer, Selfridges, on the New York Curb Exchange (an earlier version of the American Stock Exchange), opening up easier access to foreign companies for American investors.
The concept of Global Depositary Receipts (GDRs) emerged as a broader term encompassing depositary receipts used globally, following the success of ADRs. While a specific date for the first GDR is not available, it was after 1927 and likely coincided with the rise of depositary receipts in other financial centers around the world.
GDRs are issued by banks outside the United States and represent ownership in a foreign company’s shares that are traded on a stock exchange outside the US.
Examples of global depositary receipts (GDRs):
Tata Motors Limited (NYSE: TTM): A prominent Indian multinational automotive manufacturing company.
Petrobras (NYSE: PBR) is a Brazilian multinational corporation in the petroleum industry
When an investor buys a DR, they are effectively purchasing a certificate that represents a certain number of shares in the foreign company. The bank or financial institution that issues the DR holds the actual shares in custody and pays any dividends or other payments to the DR holders. DRs are typically denominated in US dollars or Euros, making it easier for investors to track their investments and receive payments without worrying about currency exchange rates.
While ADRs and GDRs sound the same, there are some key differences:
Geography: ADRs are issued in the United States, while GDRs are issued outside of the United States. ADRs represent ownership of foreign company shares that are held in US banks, while GDRs represent ownership of foreign company shares that are held in banks outside the United States.
Regulation: ADRs are regulated by the US Securities and Exchange Commission (SEC), while GDRs are typically regulated by the financial regulators in the country where they are issued.
Denomination: ADRs are denominated in US dollars, while GDRs are denominated in a variety of currencies, such as Euros or British pounds.
Trading: ADRs are listed on US stock exchanges, while GDRs are typically listed on foreign stock exchanges.
Liquidity: ADRs generally offer more liquidity due to their listing on US exchanges and compliance with US market regulations.
Cost: ADRs tend to be less expensive than GDRs due to their larger market size and greater liquidity.
It is worth noting that not all foreign companies have ADRs or GDRs, and even those that do may not have them available on all stock exchanges. Additionally, ADRs and GDRs may not necessarily trade at the same price as the underlying shares in the foreign company, influenced by factors such as currency fluctuations and demand for the DRs themselves.
Not all ADRs are created equal
There are different types of ADRs, such as sponsored and unsponsored. In a nutshell, a sponsored ADR is created with the foreign company’s involvement and a single depositary bank to issue the ADRs, subject to stricter regulations and disclosure, can be listed on major US exchanges. On the other hand, an unsponsored ADR is issued without the foreign company’s involvement, is subject to less stringent regulations, and typically traded on the Over-the-Counter Market (OTCM). Sponsored ADRs are typically more liquid and have lower trading costs than unsponsored ADRs.
How to identify an ADR
While some ADRs are not obvious, such as Toyota Motor Corporation, a Japanese company, which is traded as an American ADR on the New York Stock Exchange (NYSE). This makes it easier for Canadian and American investors to purchase shares without having to deal with foreign stock exchanges.
Other ADRs are easier to spot due to a ‘Y’ or an ‘F’ at the end of a ticker. For instance, China’s BYD Company Limited, a manufacturer of automobiles and rechargeable batteries, trades on the OTCM under the tickers OTCM: BYDDY and OTCM: BYDDF.
BYDDY: This represents the ADRs that trade on the OTCM. Each BYDDY ADR typically represents 10 underlying BYD shares.
BYDDF: This also trades on the OTC market, but each ADR represents 1 underlying share of BYD.
Both BYDDY and BYDDF allow North American investors to invest in the BYD Company without having to directly invest in the Chinese market.
What does the letter ‘Y’ or ‘F’ at the end of the ticker indicate?
When comparing ADRs (tickers ending with ‘Y’) and foreign ordinary shares trading on the OTCM (tickers ending with ‘F’), it’s important to consider several factors that affect the risk level of each. The letters ‘Y’ and ‘F’ at the end of a ticker symbol reveal crucial information about the type of security and its listing:
‘Y’ at the end of the ticker (e.g., BYDDY):
Indicates that the security is an American Depositary Receipt (ADR).
ADRs simplify international investing by allowing trades in US dollars, avoiding the complexities of direct international trading and currency conversion.
Generally, have higher liquidity since they are traded on major US exchanges. Higher liquidity means it is easier to buy and sell shares without significantly affecting the price.
Companies issuing ADRs typically provide more comprehensive financial information and disclosures in English, making it easier for North American investors to access and understand relevant information.
These securities are subject to stringent regulatory oversight from US exchanges (e.g., NYSE, NASDAQ) and the Securities and Exchange Commission (SEC), ensuring transparency and reduced fraud risk.
Are more widely recognized and accessible to Canadian and American investors, which can contribute to a perception of lower risk.
‘F’ at the end of the ticker (e.g., BYDDF):
Indicates that the security is a Foreign Ordinary Share, traded on the OTCM.
Tend to have lower liquidity because they are not traded on major exchanges. Lower liquidity can lead to larger bid-ask spreads and more price volatility.
Information may be less readily available, and what is available might not be as thorough or in English, making it harder for investors to make informed decisions.
Unlike ADRs, Foreign Ordinary Shares are not registered with the SEC. They trade on the OTCM, which generally has less regulatory oversight compared to major US exchanges.
Generally less accessible and less well-known, which can contribute to a perception of higher risk
In summary:
BYDDY is an ADR of BYD Company Ltd, allowing Canadian and American investors to trade it on US exchanges.
BYDDF represents the foreign ordinary shares of BYD Company Ltd, trading on the OTCM.
While both types of securities involve risks associated with investing in foreign companies, OTCM foreign ordinary shares (tickers ending with ‘F’) are generally considered riskier than ADRs (tickers ending with ‘Y’) due to lower regulatory oversight, lower liquidity, less information availability, and less market accessibility.
Canadian DRs
Let’s get more specific and explore a type of DR specifically designed for Canadian investors: The Canadian Depositary Receipt (CDR). While ADRs and GDRs have long been familiar, CDRs represent a newer option for investors. Managed by the Canadian Imperial Bank of Commerce (TSE: CM) and exclusively traded on the Cboe Canada Exchange (formerly Neo Exchange, now part of Cboe Global Markets since 2022), CDRs open up access to international companies listed on major US exchanges like the NYSE and Nasdaq for Canadian investors. You can trade CDRs through brokerage accounts that provide access to the Cboe Canada Exchange platform. Introduced in the summer of 2021, CDRs provide Canadian investors with a straightforward path to international investments, minus the complexities of currency conversions. Here’s how they work:
Investing in Global Companies: CDRs mirror shares of foreign companies typically listed on major US exchanges such as the NYSE or Nasdaq. By purchasing CDRs, investors gain exposure to foreign companies while trading in Canadian dollars on a Canadian exchange.
Convenience of trading in Canadian dollars: A major perk of CDRs is the ability to trade them in Canadian dollars. This eliminates the need for currency conversions, saving on foreign exchange fees and simplifying the investment process.
Built-in Currency Hedge: CDRs come with a built-in currency hedge, minimizing the impact of fluctuations between the Canadian dollar and the foreign currency (often US Dollars). This safeguard helps shield investments from currency volatility.
Fractional Shares: CDRs often represent fractions of a share of the foreign company, making it easier and more affordable for Canadian investors to buy into large-cap companies.
Trading Like Regular Stocks: CDRs are traded on Canadian exchanges just like conventional stocks and ETFs. They can be bought and sold through standard investment platforms.
Examples of CDRs include well-known companies like Apple (NEO: AAPL.NE), Nvidia, Berkshire Hathaway (NEO: BRK.NE), Walmart (NEO: WMT.NE), and Coca-Cola (NE: KO.NE). If you click on any of these links to the CDRs you will notice the CDR is much less than a share of the actual company. For example, compare the price of the Apple CDR with Apple stock (NASD: AAPL). You will see a significant difference. For an up-to-date list of available CDRs on Cboe Canada, consult their platform.
As with any investment, consider potential downsides to CDRs such as lower trading volumes leading to increased volatility, management fees impacting returns, and limited access to shareholder benefits like dividends and voting rights. Additionally, dividends paid to CDR holders may be subject to withholding tax, affecting net returns.
For Canadian investors seeking exposure to leading global companies while managing currency risks and transaction costs, CDRs offer a convenient and cost-effective avenue. Unlike buying shares on a US exchange, CDRs provide favorable currency conversion rates, trade at fractions of their US-listed counterparts, and minimizes the impact of currency fluctuations.
If you are interested in CDRs, check with your online broker or a financial planner to see if they are right for you.
Since I have been doing this investing blog, I have often read of various central banks’ target of a 2% rate of inflation. This is the figure that the Bank of Canada, the US Federal Reserve, European Central Bank, and other central banks often site. It got me to wondering why 2%? Was it arbitrary or was there some logical rationale? So, I decided to investigate it.
The 2% inflation target became widely adopted by central banks in the 1990s and early 2000s for several reasons:
Stable Prices: Aiming for a 2% inflation rate helps keep prices rising moderately. This stability is crucial because it allows businesses and consumers to plan for the future without worrying about sudden price increases (inflation) or decreases (deflation).
Economic Predictability: When inflation is around 2%, it signals a healthy economy where businesses can invest and grow, and consumers can confidently spend. This predictability reduces uncertainty, which is beneficial for long-term investment planning.
Impact on Interest Rates: Central banks such as the Bank of Canada and the US Federal Reserve adjust interest rates based on inflation. If inflation is too low (close to or below 0%), it can lead to deflation, where prices fall, and economic activity slows down. To prevent this, central banks might lower interest rates to encourage borrowing and spending. On the other hand, if inflation is too high, they might raise interest rates to cool down the economy and prevent excessive price increases.
Investment Strategy: Knowing that central banks target 2% inflation can help investors make informed decisions. For example, during periods of low inflation, interest rates might be lower, making borrowing cheaper and potentially encouraging investment in assets like stocks and real estate. During high inflation, investors might look for assets that historically perform well during inflationary periods, such as commodities or inflation-protected bonds.
Global Consensus: The fact that major central banks worldwide aim for a 2% inflation target creates a framework that investors can rely on. It fosters stability in financial markets and encourages global economic cooperation, which can impact international investments and trade.
Understanding why central banks target 2% inflation can really help you see how economic policies shape market conditions and investment opportunities. It highlights why keeping an eye on inflation trends and central bank actions is key to a solid investment strategy. That is why these ‘Weekly Update’ posts kick off with Canadian and US economic conditions – even if they seem a bit dry 😊 – to give you insight into what central banks watch as they work to maintain that 2% inflation target.
Since we are talking about economic news, let’s see what happened this past week….
Items that may only interest or educate me ….
Canadian Economic news, US Economic news, How do I get started investing in publicly traded companies? …
Canadian Economic news
This past week’s key economic data that the Bank of Canada (BoC) considers when deciding whether to raise or lower the interest rate.
BoC Monetary Policy meeting minutes
With inflation remaining a top concern, the Bank of Canada’s Governing Council met on June 5th to decide the fate of Canada’s interest rate. The minutes revealed that after four consecutive months of easing core inflation (a measure of inflation that excludes food and energy prices), the Bank opted for a rate cut. April’s data showed headline inflation at 2.7%, staying below the upper end of the Bank’s target range for the fourth month.
The global economy also factored into the decision. While overall growth was healthy at nearly 3%, a slowing American economy was balanced by increased growth in Europe and China. Inflation concerns remain globally, with core inflation measures rising in both the US and the Euro zone despite expectations of a gradual decrease. Back in Canada, the economy grew at a solid pace of 1.7% in the first quarter of 2024, but employment indicators showed easing pressures. Annual wage growth, however, remained around 4%, a potential future risk for inflation but also a sign of a healthy economy.
The higher interest rates appear to have dampened inflation, with both the overall and core inflation rates dipping in April. The Bank is aware of the potential for future inflation spikes due to factors like wage growth, but also recognizes the benefits of a strong labour market.
Overall, the Bank of Canada remains cautious, emphasizing a data-driven approach to future rate decisions. Officials agreed that any further rate cuts would be gradual and based on incoming data, with the next announcement scheduled for July 24th.
Canadian market volatility
Canada’s Volatility Index, the VIXC, tracked by the TSX 60, jumped 18% this week, rising from 9.56 to 11.31. This is a noteworthy increase, but despite the VIXC’s rise, the markets remain relatively stable overall, likely due to the lack of major economic news this past week. Investors are still hoping for another BoC rate cut in July and a potential follow-up by the US Federal Reserve in September.
The VIXC reflects anticipated market volatility, with lower values indicating less uncertainty and a calmer investor mood.
Retail Sales
Statistics Canada reported that in April, retail sales in Canada increased 0.7%, bouncing back from a 0.2% decline in March. This marks the largest increase since September 2023. Here are some of the highlights:
Sector Highlights:
Gasoline Stations and Fuel Vendors had the biggest gain with a 4.5% increase, primarily driven by higher fuel prices.
Motor Vehicle and Parts Dealers faced the biggest drop, down by 2.2%.
Yearly Performance:
Retail sales climbed by 1.8% compared to last year.
Health and Personal Care Retailers led all sectors with a 6.2% rise.
Sporting Goods, Hobby, Musical Instrument, Book, and Miscellaneous Retailers experienced the steepest decline, down by 3.7%.
Core Retail Sales: Excluding gasoline stations, fuel vendors, motor vehicle, and parts dealers:
Monthly Growth was up by 1.4%.
Annual Growth Increased by 1.5%.
Food and Beverage Retailers (which accounts for 19% of total retail sales) was up by 1.9%.
Building Material and Garden Equipment and Supplies Dealers recorded the biggest monthly drop, down by 1.4%.
The report highlights ongoing cautious consumer spending, influenced by rising inflation and higher interest rates, reducing disposable income. Until these economic pressures ease, consumer spending is expected to remain cautious.
Preliminary data for May indicates a potential 0.6% drop in retail sales, which, if confirmed, would be the steepest decline since January. This could offset much of April’s gains.
In summary, while April brought a welcome boost in retail sales, the outlook remains uncertain as consumers navigate inflation and higher interest rates.
US Economic news
This past week’s key data points that the Federal Reserve (Fed) considers when deciding whether to raise or lower the interest rate.
American market volatility
he CBOE Volatility Index (VIX), known as the market’s fear gauge, ticked up to 13.20 from last week’s 12.66. This rise likely reflects recent economic data showing a slowdown in consumer spending and a cooling economy. Despite the increase, the VIX remains below the 20 threshold, which generally indicates market calmness. This suggests that investors are still relatively relaxed about near-term market conditions.
Retail Sales
The Commerce Department’s May retail sales report showed that retail sales grew by a lower-than-expected 0.1% in May, following a revised decline of 0.2% in April. Analysts had anticipated a growth rate of 0.2%. Annually, retail sales rose at a pace of 2.3%.
The biggest monthly increase was recorded in ‘Sporting goods, hobby, musical instrument, & bookstores,’ which were up 2.8%, while the largest decline occurred in ‘Gasoline stations,’ which fell by 2.2%. Annually, the most significant increase was in ‘Miscellaneous store retailers,’ up 7.3%, whereas ‘Furniture & home furnishing stores’ experienced the biggest drop, down 6.8%.
Excluding ‘motor vehicle & parts dealers’ and ‘gasoline stations,’ retail sales still grew by 0.1% in May, meeting expectations. On a year-over-year basis, core retail sales grew by 2.6%.
This latest report indicates that consumer spending has slowed as persistent inflation and high interest rates continue to affect consumer behavior. This week’s report is yet another sign of a decelerating economy. Analysts and, more importantly, the Fed, will be watching future retail sales reports to see if this slowdown persists. For those hoping for a cut to interest rates, this slowdown is a positive indicator. 😊
How do I get started investing in publicly traded companies?
After reading in last week’s Weekly Update that now is the best time to start investing, you are ready to start. Great! You have made the decision to start investing to meet your financial goals. Now you are wondering, “How do I get started?” Well, let us see if we can help you navigate the process.
First, ensure you have the basics covered: set aside an emergency fund, pay off high-interest debt, create an investment plan, and consult with a certified financial planner to ensure everything is in order. Once these steps are completed, you are ready to dive into investing! The first step is to open an investment account, which allows you to buy and sell shares, effectively making you a part-owner of those companies. 😊 Investment accounts can hold cash and a variety of investment products, including stocks, bonds, mutual funds, and exchange-traded funds (ETFs). This gives you the flexibility to choose investments that align with your risk tolerance and financial goals.
Step 1: Open an Investment Account Consider using a no-cost trading app like TD Easy Trade or Wealthsimple. For Canadians, you will receive both a Cash account and a Tax-Free Savings Account (TFSA), each with Canadian and US dollar subaccounts. TFSAs are a great way to grow your wealth tax free because any interest, dividends, or capital gains earned in a TFSA are not subject to Canadian income tax. Additionally, withdrawals from a TFSA are not taxed, offering flexibility as you can access your funds without worrying about additional tax implications. Remember, there is an annual contribution limit for TFSAs, so check with a financial advisor or the Canada Revenue Agency (CRA).
Step 2: Choose Your Platform Back in the early 90s, investing meant calling a stockbroker, buying shares in lots of 100, and paying a $50 transaction fee. Today, online trading is much more accessible. Fees are minimal, if not free, and you can buy as little as one share, or a fraction of a share in some cases. All you need is either a computer with secure, fast internet access or a smartphone with an appropriate app. Here are some well-known online brokers:
Big 5 Canadian Banks: RBC Direct Investing, Scotia i-Trade, TD Direct Investing, BMO InvestorLine, CIBC Investors Edge
Many banks require a minimum balance to avoid maintenance fees, but these fees are often waived if you or your household have a substantial financial relationship with the bank (e.g., mortgage, savings account, etc.). Using your financial institution for your trading account simplifies money transfers and usually they offer comprehensive financial planning services to assist with overall wealth management. In addition to cash, and TFSA accounts, many financial institutions can also provide tax sheltered Registered Retirement Savings Plan (RRSP) or Registered Income Fund (RIF) accounts in both Canadian and US currencies. Additionally, you can buy and sell on major Canadian and US exchanges, as well as secondary exchanges like the Canadian Securities Exchange (CSE) and the Over-the-Counter Market (OTCM) in the US. If you are opening your first direct trading account, consider starting with your financial institution for these conveniences.
Step 3: Determine Your Needs If you do not meet the bank’s fee waiver criteria, explore other trading platforms. Consider what is important to you:
Research capabilities to look for investments or perform your own due diligence on companies
Low transaction fees
Access to all North American stock markets and stocks
Educational resources to help you understand this investing thing
Customer support and the ability to easily talk to someone if you have any questions
Assess your investing knowledge, experience, and desired features, then choose the platform that fits you best.
Happy investing! Remember, the key is to understand what you are investing in and make decisions that align with your financial goals and ability to take on risk.
Weekly Market Review
Monday: it was a tale of two countries as far as the indexes go. Canada’ Toronto Stock Exchange Composite Index (TSX) ended lower, while the S&P 500 Index (S&P), the Nasdaq Composite Index (Nasdaq) and the Dow Jones Industrial Average (DJIA) ended higher. Oil prices rose on the prospects of increased demand during the summer.
In Canada, the TSX fell to a three-month low as investors rotate away from resource-oriented stocks in favour of high-flying technology companies. In trading, Industrials, Consumer Cyclicals and Consumer Staples were the only Canadian sectors to advance, while Technology and Utilities suffered the biggest declines.
In the US, the rally in artificial intelligence (AI) companies propelled the Nasdaq to its sixth consecutive record high, and the S&P reached a record high for the 30th time this year. In trading, Consumer Cyclicals and Technology were the big gainers, while Utilities and Healthcare dropped the most.
Tuesday: it was a good day in the markets, with all four indexes ending in the green. Weaker US retail sales has investors hoping this opens the door for the Fed to lower interest rates sooner rather than late. Oil prices rose on supply concerns due to rising tensions in the Middle East region.
In Canada, higher oil and commodity prices pushed the TSX into positive territory. In trading, Basic Materials (miners and fertilizer manufacturers) and Energy posted the biggest sectoral gains, while Technology and Telecommunications were the biggest losers in the Canadian sectors.
In the US, technology companies associated with AI continue to extend the current bull run, sending the Nasdaq to its seventh straight record close, and the S&P to its 31st record high close of 2024. A surge in share price by Nvidia (NASD: NVDA) has pushed Nvidia into the number 1 spot as the world’s most valuable company, as measured by market capitalization (number of shares outstanding X share price). In trading, Energy and Financials were the top performers, while Consumer Cyclicals and healthcare were the only two sectors to end lower.
Wednesday: the TSX was dragged lower by seasonally weak commodity prices, while the US stock markets were closed for the American national holiday Juneteenth. The price of oil moved higher, however, all ten Canadian sectors lost ground today. The steepest declines were in the Healthcare and Industrials sectors, while Basic Materials and Utilities declined the least.
Thursday: a mixed day for the indexes with the TSX and DJIA advancing. Despite hitting record highs during today’s session, the Nasdaq and S&P ended lower when investors took some money off the table after the recent rally in AI stocks. Oil prices continued to climb as investors anticipate lower interest rates in time for the busy summer travel season.
In Canada, higher commodity prices lifted the TSX off an almost four month low. In trading, buoyed by higher commodity prices, Basic Materials was the best performing sector, while Utilities performed the worst.
In the US, the Nasdaq’s streak of record high closings ended at seven when the Nvidia rally stalled and then the share price fell 3%. In trading, Energy posted the biggest gain while Technology had the biggest drop.
Friday: the markets fluctuated throughout the day as the AI-fueled rally lost momentum. Consequently, the DJIA was the only index to end in positive territory, with investors seemingly booking profits after the AI surge. Oil prices retreated on concerns of lower-than-expected demand.
In Canada, lower commodity prices caused by oversupply and lower demand weighed on the TSX. In trading, The Technology sector gained the most while Basic Materials suffered the biggest drop.
In the US, Nvidia stock pulled back another 3%, dragging the Nasdaq and S&P into the red. In trading, Consumer Cyclicals advanced the most, while Energy fell the furthest.
Weekly Market and Portfolio Review
For the week, the TSX (SPTSX) fell 0.4%, the S&P 500 (SPX) grew 0.6%, the DJIA (INDU) rose 1.5% and the Nasdaq (CCMP) was essentially flat, adding 0.003%.
Index
Weekly Streak
TSX:
5 – week losing streak
S&P:
3 – week winning streak
DJIA:
1 – week winning streak
Nasdaq:
3 – week winning streak
The past week saw mixed results for the four major North American indexes. While the American indexes recorded modest gains, the TSX ended lower. The American trading week was interrupted by the Juneteenth national holiday, which fell in the middle of the week.
Nvidia and the AI-fueled rally were the main drivers for the American markets, initially lifting the S&P and Nasdaq to record highs. However, after the midweek holiday, the rally lost steam, causing the S&P and Nasdaq to give back some of their earlier gains. The DJIA didn’t get the same boost from the AI rally, but managed to maintain its upward momentum since technology companies make up a smaller portion (20%) of this index and have less influence overall. Despite the technology sector’s wobble, the three US indexes managed to eke out modest gains for the week.
In Canada, the resource-driven TSX was influenced by fluctuating commodity prices, which ultimately saw the TSX trend downward throughout the week, as you can see in the chart above.
Overall, the week started strong but lost momentum towards the end, with three of the indexes heading downward. This week reminds us that markets can be unpredictable, even after strong starts. This is not a great sign for next week, but there is plenty of economic news on the horizon. Let us hope the latest inflation and productivity reports from Canada and the US bring positive news for consumers and investors alike. 😊
Portfolio
Weekly Streak
Portfolio 1:
1 – week losing streak
Portfolio 2:
2 – week losing streak
Portfolio 3:
1 – week losing streak
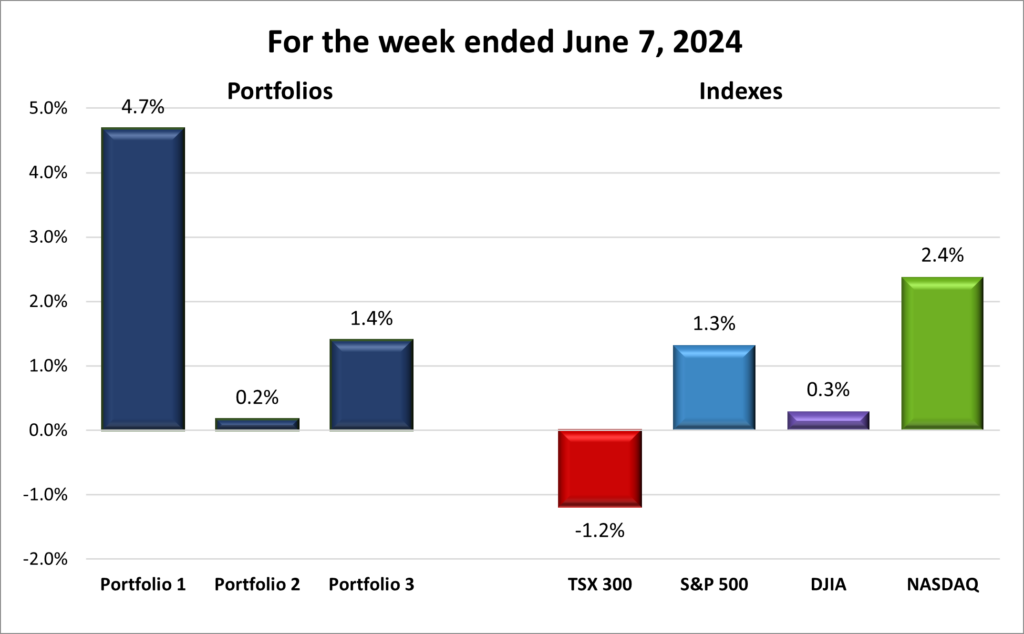
It’s not often that a good week for the indexes translates to a tough week for portfolios, but that’s exactly what happened this past week. All three portfolios experienced losses greater than the worst-performing index, as illustrated in the chart below.
Portfolio 1 had the toughest week among the three. Despite over half the companies in this portfolio recording gains, the overall value still dropped. This was largely due to Nvidia, the portfolio’s largest holding at 38%, falling by 6%. Additionally, significant losses from Nano-X Imaging Ltd (NASD: NNOX) and indie Semiconductor Inc. (NASD: INDI), both down 11%, added to the portfolio’s woes.
Portfolio 2 saw a majority (56%) of its companies posting weekly gains, with no significant individual gains or losses. Microsoft (NASD: MSFT) and MongoDB (NASD: MDB), the second and third largest holdings, both recorded weekly gains. However, the largest holding, the Bank of Nova Scotia (TSE: BNS), registered a loss. Despite these mixed results, the portfolio fell for a second straight week.
Portfolio 3’s decline was straightforward: more than 66% of its companies posted weekly losses. When that many companies in a portfolio decline, it’s tough to achieve a weekly gain. The situation was exacerbated by Unity Software (NYSE: U) and Lithium Americas (Argentina) (TSE: LAAC), both hitting 52-week lows.
Overall, it was a challenging week for all three portfolios. No one said investing was always sunshine and rainbows. 😊 With fingers crossed, let us hope for a significantly better performance next week.
Weekly Portfolio & Index performance for the week ended June 21, 2024.
Companies on the Radar
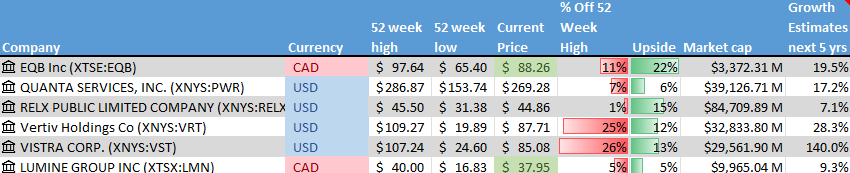
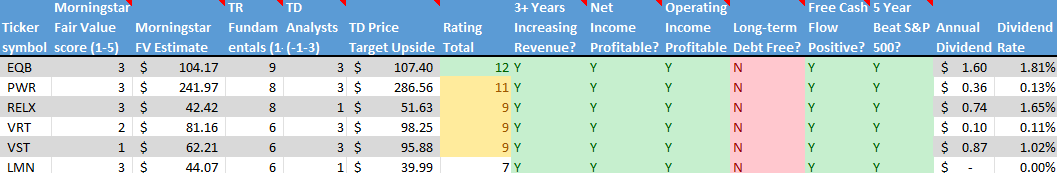
No new companies caught my eye this past week, but I did manage to shorten my watchlist by removing RELX PLC (NYSE: RELX). With a growth estimate of 7.1% over the next five years, RELX seemed the least promising compared to the other five companies on my list, which all appeared to have better upside potential. So, I decided to drop it from consideration.
The radar list now comprises these five companies listed below.
Equitable Bank (TSE: EQB), a mid sized Canadian bank, considered Canada’s 7th bank, that provides financial services to consumers and businesses.
Quanta Services, Ltd. (NYSE: PWR), a large-cap American company offering a wide range of specialty infrastructure solutions throughout the world
Vertiv Holdings (NYSE: VRT), an American company that designs and builds infrastructure and continuity solutions to businesses around the world.
Vistra Corp (NYSE: VST), an American company operating in the integrated retail electricity and power generation sector.
Lumine Group (TSE: LMN), a young Canadian mid sized company that acquires communications and media software companies, and then strengthens and grows those companies.
Please keep in mind that these are only companies that have piqued my interest. This is not a recommendation or financial advice. You should do your own research or contact a professional before making any investment decisions.
The Radar Check was last updated June 21, 2024.
Stock on the Radar List. 1 of 2.Stock on the Radar List. 2 of 2.
Portfolio Update
Portfolio 1
Portfolio 1 for the week ended June 21, 2024: DOWN
Apple (NASD: AAPL) announced they were shutting down their ‘Buy now, pay later’ (BNPL) service in the US as the company transitions to a successor program that uses third party BNPL companies. Existing users of Apple’s BNPL service will still be able to manage and pay outstanding loans via Apple’s Wallet app.
The Trade Desk (NASD: TTD) announced they had expanded their partnership with Fox Corporation (NASD: FOX) to help advertisers reach their target audiences and measure the success of those campaigns.
Amazon (NASD: AMZN) plans to overhaul its Alexa voice assistant service into two levels with a monthly fee to utilize the higher AI integrated tier.
Activity
No significant activity to report this week.
Dividends
Dividends Received this week for the following companies:
Companies followed by DRIP (Dividend Re-Investment Plan) indicate additional shares were purchased with the dividend. Any cash leftover was added to the cash balance.
Portfolio 2 for the week ended June 21, 2024: DOWN
Alimentation Couche-Tard (TSE: ATD) subsidiary Circle K has been quietly selling stores that do not fit their business model. Despite actively purchasing convenience stores, they recently sold 110 stores across Canada and the US and are currently in the process of unloading 68 more stores.
Activity
No significant activity to report this week.
Dividends
Dividends Received this week for the following companies:
Companies followed by DRIP (Dividend Re-Investment Plan) indicate additional shares were purchased with the dividend. Any cash leftover was added to the cash balance.
Canadian $
iA Financial Corporation Inc. (TSE: IAG)
Dream Industrial Real Estate Investment Trust (TSE: DIR.UN) DRIP
Supremex Inc. (TSE: SXP)
iA Financial Corporation Inc (TSE: IAG)
US $
No US$ dividends this past week.
Quarterly Reports
No quarterly reports this past week.
Portfolio 3
Portfolio 3 for the week ended June 21, 2024: DOWN
TD Bank (TSE: TD) has started a new business unit, called TD Innovations Partners, focused on providing banking and financial services to Canadian technology companies. The new unit will provide a full suite of services, from setting up bank accounts for new startups through to connecting companies to potential investors, board members, customers, and vendors.
Magnite (NASD: MGNI) announced their SpringServe ad serving technology is being used by Japan’s Yomiuri Telecasting Corporation to provide video advertising for their on-demand services.
GDI Integrated Facility Services (TSE: GDI) announced their Chief Financial Officer will retire in September, however he will serve as an advisor for the following twelve months. Charles-Etienne Girouard was promoted to senior vice president of finance operations, effective immediately. Mr. Girouard has been with GDI for the past six years.
Activity
No significant activity to report this week.
Dividends
Dividends Received this week for the following companies:
Companies followed by DRIP (Dividend Re-Investment Plan) indicate additional shares were purchased with the dividend. Any cash leftover was added to the cash balance.
Canadian $
SmartCentres Real Estate Investment Trust (TSE: SRU.UN) DRIP
Over the last few weeks, I have been writing about common questions people ask when they first start investing. From ‘What is Investing?’ to today’s topic of ‘When should I start investing?’ with a few more questions to come in the next few weeks. While answering these questions, it occurred to me: before people even start asking questions (which is a good place to start), what else is preventing people from starting to invest? Here are a few common barriers that I’ve either encountered myself or heard other people cite:
Lack of knowledge: Many people feel they do not have enough knowledge about the financial markets or investing strategies, making them hesitant to start.
Limited financial resources: Investing often requires some initial capital, which can be a barrier for those with limited savings.
Risk Aversion: Fear of losing money often holds people back from investing, as the potential for financial loss can seem overwhelming.
Investment complexity: The vast array of investment options and complex financial jargon can be intimidating for new investors.
Time constraints: Investing requires research and ongoing monitoring, which can be challenging for busy individuals.
Debt: Debt payments can limit available funds for investing and create financial pressure.
Life events: Major life events like starting a family or buying a home can impact your financial situation and risk tolerance, potentially affecting investment decisions.
Inertia: Even with knowledge and resources, you need to avoid procrastination and take the first step.
Do any of them look familiar to you? I have faced them all at one time or another. The first step to overcoming these barriers is to acknowledge them, then make a plan to address them head-on.
Do not be discouraged by the initial complexity. Do not overthink it, avoid paralysis by analysis. It becomes easier once you overcome the initial inertia and get started. Open a free trading account and deposit a bit of cash. There, you have made your first investment. 😊 Keep adding money to your investing account while you learn and decide what to invest in. When you find an investment that fits your plan and risk tolerance, you will have already put some money aside.
I hope these weekly updates help you with some of the questions you may have and will provide you with some knowledge and confidence to take control of your financial future. With that said, let’s see what happened this past week….
Items that may only interest or educate me ….
Canadian Economic news, US Economic news, When should I start investing?, What I learned this week?, ….
Canadian Economic news
This past week’s key economic data that the Bank of Canada (BoC) considers when deciding whether to raise or lower the interest rate.
Canadian market volatility
Canada’s Volatility Index (VIXC), tracked by the TSX 60, dipped to 9.56 over the past week, down from 9.73. This slight decline occurred amid a generally stable market environment but was influenced by a few factors. Speculation about potential rate cuts by the BoC in July and the US Federal Reserve’s decision to maintain US interest rates at 5.5% likely played roles in this movement.
The VIXC, often dubbed Canada’s ‘fear gauge,’ offers insights into expected market volatility. When the VIXC trends lower, it suggests reduced uncertainty and a calmer market sentiment among investors.
US Economic news
This past week’s key data points that the Federal Reserve (Fed) considers when deciding whether to raise or lower the interest rate.
Federal Open Market Committee monetary policy meeting
The Federal Open Market Committee (FOMC), which is responsible for setting the benchmark interest rate, decided to hold the benchmark interest rate steady at their current range of 5.25% – 5.5%. While investors were hoping for a September rate cut, the FOMC hinted at a delay until December. They also revised their forecast from three cuts to just one in 2024. Looking ahead, they project four rate cuts in 2025, maintaining a policy of “higher for longer” interest rates as inflation continues to cool. (For those unfamiliar, “higher for longer” refers to keeping rates elevated for a sustained period to combat inflation.)
Although inflation has moderated, it remains above the Fed’s 2% target. With a robust labour market and strong economy, the FOMC plans to keep rates steady until clear evidence of sustained inflation reduction, such as significant price declines or increased unemployment, emerges. Fed Chair Jerome Powell described the decision to hold rates as a close call, reflecting the Fed’s willingness to accept a gradual decline toward the 2% target amidst ongoing economic strength.
Recent data on both headline (all items) and core CPI indicates a slowdown in inflation on a monthly and annual basis, aligning with the Fed’s objectives. Further reports showing continued inflation slowdown could pave the way for anticipated rate cuts. And lower rates would be welcomed by consumers and businesses in the US, Canada, and globally.
Consumer price Index (CPI)
As expected, the May CPI was unchanged (0.0%), down from a 0.3% gain in April. Year over year, the CPI slowed to 3.3%, slightly below April’s 3.4% growth. The biggest monthly increase was in ‘Tobacco and smoking products,’ which rose by 1.6%, while the largest decline was in ‘Energy commodities,’ including fuel and oil products, which dropped by 3.5%. Annually, ‘Transportation services’ saw the most significant increase, up 10.5% due to higher fuel costs. This rise in ‘Transportation services’ was partly driven by a 3.6% year-over-year increase in fuel prices, despite some cooling in recent months. Meanwhile, ‘Used cars and trucks’ experienced the biggest annual decline, falling by 9.3%.
Core CPI, which excludes the volatile food and energy components, grew 0.2% in May, slightly below April’s 0.3% increase. On an annual basis, core CPI slowed to 3.4% in May from 3.6% in April, marking the slowest pace in three years. Analysts had predicted an increase of 3.5%.
The May CPI report was a sign the Fed had been waiting for: both the pace of headline (all items) and core inflation were slowing down, both monthly and year over year. While the Fed was likely pleased to see inflation cooling, they still considered it too high to start lowering the benchmark rate. However, this report was a step in the right direction. If future reports indicate that inflation continues to move towards the Fed’s 2% target, we could see a rate cut as early as September, with the possibility of a second cut later in the year.
American market volatility
The CBOE Volatility Index (VIX), often referred to as the market’s fear gauge, edged up to 12.66 from the previous week’s 12.22. This slight increase likely stems from the Fed’s decision to maintain the current interest rate of 5.5%, reduce the anticipated rate cuts from three to one, and delay a potential rate cut towards the end of the year. With the VIX remaining below the 20 threshold, which typically indicates market calmness, investors appear to be less apprehensive in the near term.
Consumer Sentiment Index (CSI)
The University of Michigan’s preliminary reading on the overall index of consumer sentiment, a gauge of consumer confidence, fell to 65.6 in June, marking a 5.1% drop from 69.1 in May. This was the third consecutive monthly decrease and the lowest reading in seven months. Analysts had predicted a higher reading of 72. Despite the monthly decline, the CSI was up 2.2% year-over-year.
The lower reading likely reflects consumer concerns about persistent inflation, which is causing interest rates to remain higher for longer, and slowing wage growth.
When should I start investing?
If you are not already investing your money, the best time to start is now! However, before diving in, make sure you have a stable financial foundation. This means having an emergency fund, being free of high-interest debt, and understanding your financial goals and risk tolerance. Once you are financially stable, the best time to start investing is as early as possible. Now, let us take a look at why starting early is so crucial:
Compound Interest: The earlier you start, the more time your investments have to grow. Compound interest can significantly boost your wealth over time, as you earn returns on your returns.
Learning Curve: Investing is a skill that improves with experience. Starting early allows you to learn from mistakes and successes, refine your strategies, and build confidence.
Risk Tolerance: Younger investors typically have a higher risk tolerance because they have more time to recover from potential losses. This allows for more aggressive investment strategies that can lead to higher returns.
Financial Goals: Early investing helps you work towards long-term financial goals, such as retirement, buying a home, or funding education.
Habit Formation: Starting early helps you develop good financial habits, such as regular saving and investing, budgeting, and financial planning.
To illustrate the power of early investing, consider the following example:
Marie starts investing at age 20, investing $2,400 annually at the beginning of each year. Life starts to ‘happen’ at 30, so she stops contributing at age 30. Meanwhile, John starts to ‘enjoy life’ at 20 but when he turns 40, he starts to think he should plan for his future, so he invests $4,800 at the start of every year until he reaches 65. Both assume an 8% annual growth rate (The historical average growth rate of the S&P 500 is around 10.26% but let us be conservative). Who will have the larger retirement nest egg at 65?
Marie
John
Age
Amt invested
YE Value
Age
Amt invested
YE Value
20
$ 2,400
$ 2,592
40
$ 4,800
$ 5,184
21
$ 2,400
$ 5,391
41
$ 4,800
$ 10,783
22
$ 2,400
$ 8,415
42
$ 4,800
$ 16,829
23
$ 2,400
$ 11,680
43
$ 4,800
$ 23,360
24
$ 2,400
$ 15,206
44
$ 4,800
$ 30,412
25
$ 2,400
$ 19,015
45
$ 4,800
$ 38,029
26
$ 2,400
$ 23,128
46
$ 4,800
$ 46,256
27
$ 2,400
$ 27,570
47
$ 4,800
$ 55,140
28
$ 2,400
$ 32,368
48
$ 4,800
$ 64,735
29
$ 2,400
$ 37,549
49
$ 4,800
$ 75,098
30
$ 2,400
$ 43,145
50
$ 4,800
$ 86,290
Stops contributing at 30
Contributes for another 15 years
65
$ –
$ 637,915
65
$ 4,800
$ 414,484
Over 11 years, Marie invests a total of $26,400 (11 x $2,400) and ends up with a nest egg of $637,915. John, on the other hand, invests a total of $124,800 over 26 years (26 x $4,800) and accumulates $414,484. Despite investing more than twice as much, John’s nest egg is almost 54% less than Marie’s, highlighting the power of compounding.
It is pretty obvious that the earlier you jump into investing, the better. Think of it like laying the foundation for a sturdy financial future. By starting early, you give your money more time to grow and multiply. So, do not wait around—get started as soon as you can, and let your money start doing the heavy lifting for your financial goals! 😊
Cautionary note: The downside of compound interest
Just as compound interest can grow your savings, it can also work against you when paying off debt. Some credit cards compound interest daily on your balance, leading to higher interest amounts if you carry a balance month-to-month. Therefore, it is essential to pay off debt as quickly as possible.
What I learned this week
When I decided to increase my investment in Shopify, I found myself short on Canadian dollars in my TFSA Canadian dollar account, which I intended to use for purchasing shares on the Toronto Stock Exchange (TSE). To proceed, I transferred funds from my US dollar TFSA account into the Canadian dollar TFSA account. Although the transfer itself incurred no fees, I did experience a minor loss due to currency exchange between the US and Canadian dollars.However, given that Shopify is listed on both the TSE and the Nasdaq Stock Exchange, I could have alternatively purchased the Shopify shares on the Nasdaq exchange. This would have allowed me to sidestep any losses stemming from currency exchange fluctuations. While the loss was not significant, I will keep this in mind for future investments in companies listed in both Canada and the US. Every little bit helps. 😊
Something else I learned about was brand value, which refers to the financial worth attributed to a brand itself, such as Apple (NASD: AAPL). Factors contributing to brand value include:
Brand recognition and reputation: How well-known and respected the brand is.
Customer loyalty: The degree to which customers prefer a particular brand over competitors.
Perceived quality and value: How consumers perceive the quality and value of the brand’s products or services.
Brand associations: The positive attributes and associations that consumers connect with the brand.
Intellectual property: Trademarks, logos, and other brand-specific elements.
I think it would be fair to say Apple meets all five of these points. 😊
Brand valuation differs from market valuation (also known as market capitalization). Market valuation refers to the total market value of a publicly traded company’s outstanding shares of stock. It is calculated by multiplying the current share price by the total number of outstanding shares. Whereas brand value is a component of a company’s overall worth, typically listed as Intangible Assets, that captures the power and influence of the brand itself, while market valuation provides a broader picture of the company’s financial standing and investor confidence.
Weekly Market Review
Monday: the week got off to a good start with the four major North American indexes – the Toronto Stock Exchange Composite Index (TSX), the S&P 500 Index (S&P), the Dow Jones Industrial Average (DJIA), and the Nasdaq Composite Index (Nasdaq) – all ending higher. The price of oil joined the rally, finishing higher thanks to prospects of increased demand this summer.
In Canada, higher oil and commodity prices helped the TSX get in and stay in positive territory. In trading, Technology and Basic Materials (miners and fertilizer manufacturers) advanced the most of the Canadian sectors, while Telecommunications Services and Consumer Staples declined the most.
In the US, the S&P and Nasdaq set record highs, again, as investors prepare for Wednesday’s double whammy of the latest inflation report and an update from the Fed on interest rates. In trading, Utilities and Energy posted the biggest gains in the US sectors, while Telecommunications Services and Consumer Staples were the only sectors to end lower.
Tuesday: it was mixed day with the TSX and the DJIA ending in the red. All eyes turned towards tomorrow’s announcement from the Fed. Not so much for their interest rate decision, but more for clues they provide on when the rates might be lowered.
In Canada, the TSX slipped on shrinking commodities prices, concerns about a slowing global economy, and fears of a hawkish stance taken by the Fed regarding interest rates remaining higher for longer. In trading, Technology and Healthcare advanced the most while Utilities and Consumer Cyclicals fell the farthest.
In the US, once again the S&P and Nasdaq closed at record highs thanks in part to Apple jumping 7%. In trading, Technology and Financials were the top performers, while Telecommunications Services and Consumer Staples incurred the biggest drops.
Wednesday: another mixed bag day for the four indexes, this time the DJIA ended barely in the red. Otherwise, the indexes ended higher thanks to the May CPI report that showed inflation had slowed, and the Fed maintained their pause in interest rates. The price of oil rose on supply concerns from increasing tensions in the Middle East.
In Canada, lower US inflation and a merger of two Canadian banks – National Bank of Canada (TSE: NA) acquired Canadian Western Bank (TSE: CWB) – helped get the TSX back into positive territory. In trading, Technology and Healthcare posted the biggest gains while Consumer Cyclicals and Utilities were the only sectors to end lower.
In the USA, the S&P and Nasdaq set record closes for the third straight session on news of slowing inflation. In trading, Technology and Industrials gained the most, while Telecommunications Services and Consumer Staples lost the most.
Thursday: after a bullish day on Wednesday, the markets were mixed, with the Nasdaq and S&P closing higher while the DJIA and TSX edged lower. Investors were processing the likelihood that the Fed would postpone US rate cuts until year-end, at the same time reducing the number of cuts from three to one. Oil prices bounced around most of the day before finally falling into the red at the end of the day.
In Canada, the TSX fell to a two-month low as investors’ concerns about higher for longer interest rates south of the border weighed on the TSX. In trading, all sectors ended lower. Consumer Staples and Consumer Cyclicals dropped the least, while Energy and Basic Materials suffered the biggest losses.
In the US, the Nasdaq and S&P both set record closes for the fourth straight day as stocks of Technology companies continue to rally. In trading, technology, Consumer Staples, and Utilities were the only sectors to climb higher, while Energy and Financials slid the farthest.
Friday: the week ended on a down note as only the Nasdaq was able to finish above the flatline. The price of oil fell today but oil still had its best week since April due to forecasts of growing demand.
In Canada, the TSX fell to a three-month low as lower oil prices weighed on the TSX. In trading, Technology was the only sector to advance while Telecommunications Services and Energy suffered the biggest losses.
In the US, the Nasdaq set a record high close for the fifth straight day. Lower wholesale prices provided more evidence that inflation was slowing. In trading, Technology was the only one of the American sectors to end higher, while Energy and Industrials fell the farthest into the red.
Weekly Market and Portfolio Review
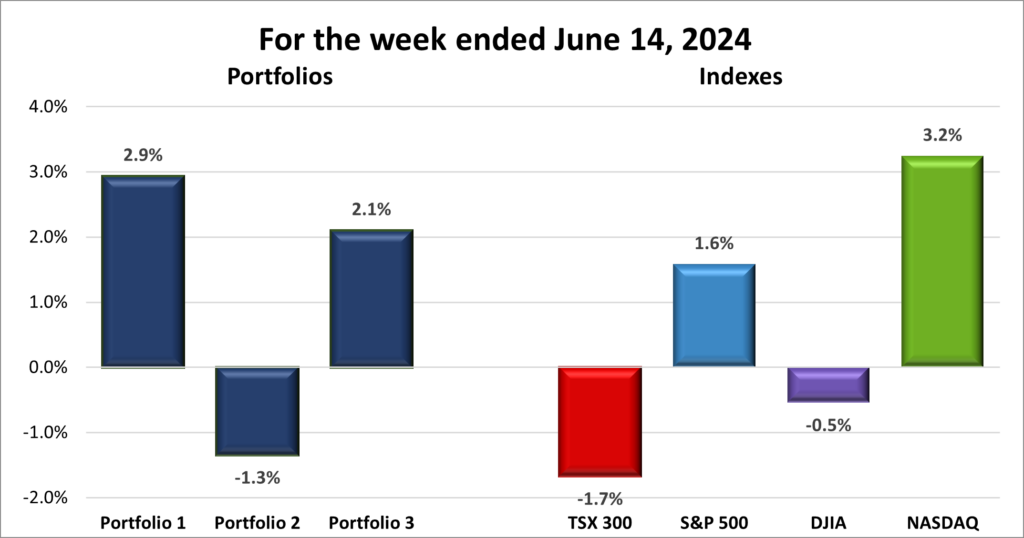
For the week, the TSX (SPTSX) slumped 1.7%, the S&P 500 (SPX) rose 1.6%, the DJIA (INDU) slid 0.5% and the Nasdaq (CCMP) jumped 3.2%.
Index
Weekly Streak
TSX:
4 – week losing streak
S&P:
2 – week winning streak
DJIA:
1 – week losing streak
Nasdaq:
2 – week winning streak
An impressive performance from the Technology sector helped counterbalance the impact of a hawkish Fed, allowing the S&P and Nasdaq to extend their weekly winning streaks, as illustrated in the chart above. Meanwhile, the DJIA lost ground, and the TSX continued its losing streak.
It was an eventful week on the economic front in the US. The May CPI report and other economic indicators showed signs of continued slowing inflation. At the FOMC meeting, Fed Chair Powell acknowledged this significant easing but emphasized that inflation remains too high. The Fed seeks more consistent data to ensure inflation is on track to hit their 2% target. As expected, the Fed stuck with its higher-for-longer rate strategy, stating they expect only one rate cut in 2024, rather than the three initially forecasted at the beginning of the year. Despite the Fed’s stance, investors seemed to believe otherwise.
The combination of positive economic data and investors’ belief that rates might drop more than once, and possibly as soon as September, seemed to ignite the S&P and Nasdaq. The S&P enjoyed a four-day streak of record closing highs, while the Nasdaq set new record highs each day of the week. However, the TSX and DJIA did not share in the tech-driven rally. The technology sector’s lighter weight in these indices meant they did not benefit as much from the surge in technology stocks.
The Fed’s news about fewer rate was also felt in the Canadian markets. As the old saying goes, ‘when the US sneezes, Canada catches a cold.’ ☹ The TSX recorded its fourth consecutive weekly decline and its biggest weekly decline since October 2023. Many are speculating that if the BoC cuts the rate in July while the Fed holds steady, the Canadian dollar is likely to weaken against the US dollar. This would make imports from the US more expensive, possibly triggering another round of high prices.
Looking forward, I will be keeping an eye for further signs of falling inflation that could lead to lower interest rates, both in Canada and the US. While it is great that the technology sector continues to outperform, it would be even better if the current rally could broaden. A broader rally implies increased investor confidence and economic strength, which in turn reduces risks and improves the sustainability of market gains. A more balanced rally benefits a larger portion of the economy and us investors alike. 😊
Portfolio
Weekly Streak
Portfolio 1:
2 – week winning streak
Portfolio 2:
1 – week losing streak
Portfolio 3:
2 – week winning streak
As illustrated in the chart below, it was a mixed week for the portfolios with two of the three increasing in value.
Portfolio 1 continues to shine, even with more than half the holdings losing ground. Despite a significant (more than 10%) drop of 14% in Celsius Holdings (NASD: CELH), the portfolio was buoyed by a stellar 15% surge in Skyworks Solutions Inc (NASD: SWKS) and strong performances from tech titans Nvidia and Apple. Talk about resilience!
Portfolio 2 hit a bit of a rough patch, extending its losing streak to two weeks. Over half the holdings took a dip, but there were no dramatic swings. The silver lining? MongoDB, which had taken a steep dive the previous week, seems to have found its footing and is inching upward, posting a slight weekly gain.
Portfolio 3 joined the winner’s circle this week. Despite more than half of its holdings slipping, there were no major price swings. Shopify, however, came through with a notable dollar value increase, pushing the portfolio into the green.
Overall, not a bad week! Sure, I would love to see all three portfolios on the rise, but as Mick Jagger wisely sings, “You can’t always get what you want.” 😊
Weekly Portfolio & Index performance for the week ended June 14, 2024.
Companies on the Radar
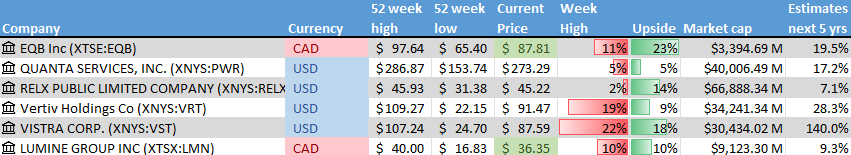
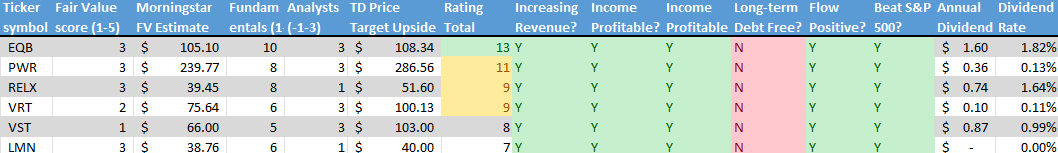
No new companies came across my radar this past week, leaving my list with the six companies listed below.
Equitable Bank (TSE: EQB), a mid sized Canadian bank, considered Canada’s 7th bank, that provides financial services to consumers and businesses.
Quanta Services, Ltd. (NYSE: PWR), a large-cap American company offering a wide range of specialty infrastructure solutions throughout the world
RELX PLC (NYSE: RELX), provides information-based analytics and decision tools for professional and business customers worldwide.
Vertiv Holdings (NYSE: VRT), an American company that designs and builds infrastructure and continuity solutions to businesses around the world.
Vistra Corp (NYSE: VST), an American company operating in the integrated retail electricity and power generation sector.
Lumine Group (TSE: LMN), a young Canadian mid sized company that acquires communications and media software companies, and then strengthens and grows those companies.
Please keep in mind that these are only companies that have piqued my interest. This is not a recommendation or financial advice. You should do your own research or contact a professional before making any investment decisions.
The Radar Check was last updated June 14, 2024.
Stock on the Radar List. 1 of 2.Stock on the Radar List. 2 of 2.
Portfolio Update
Portfolio 1
Portfolio 1 for the week ended June 14, 2024: UP
At Apple’s annual developer conference, the company unveiled their artificial intelligence (AI) strategy and their latest software, complete with its new integrated ‘Apple Intelligence.’ Apple also announced a deal with leading AI developer OpenAI that will allow Apple to integrate ChatGPT with their voice assistant Siri and other Apple software.
Following the recent surge in Apple’s share price, the company regained the title of world’s most valuable company. They also became the first brand to surpass the US$ 1 billion in brand value, up 15% from a year ago.
In other Apple news, the company was served a possible class action lawsuit that claims Apple underpays women performing the same or comparable jobs as men.
CrowdStrike (NASD: CRWD) has been added to the S&P 500 index list of companies. Any mutual or index fund that tracks the S&P will have to purchase an appropriate number of CrowdStrike shares, which should raise the share price.
Following, Nvidia’s (NASD: NVDA) recent 10 for 1 stock split, there is talk Nvidia could possibly replace fellow chipmaker Intel (NASD: INTC) in the DJIA. That would mean any fund that tracks the DJIA would have to purchase shares in Nvidia, which would likely give the share price a nice little bump. 😊
Amazon (NASD: AMZN) announced they have partnered with South American telecom company Vrio to beam broadband internet down over the actual Amazon. The deal will see Amazon’s Project Kuiper satellite internet business unit provide internet access across even the remotest parts of the Amazon, which spans Argentina, Brazil, Chile, Uruguay, Peru, Ecuador, and Colombia.
A federal judge has ruled that Alphabet’s (NASD: GOOGL) Google must face trial on antitrust claims by the US Department of Justice (DOJ) who claim the company illegally dominates the online advertising market.
Activity
Bought: Shopify (TSE: SHOP) This is my second investment in Shopify, but the first for this portfolio. Shopify had performed exceptionally well in Portfolio 3, so I decided to add more shares, this time in Portfolio 1. This also aligns with my strategy of re-investing in companies that have proven they can grow their business and share price.
Shopify is a major player in the e-commerce industry, providing a user-friendly platform for businesses to set up and manage their online stores. With a large and growing merchant base, Shopify benefits from a strong network effect. The more merchants that join Shopify, the more valuable the platform becomes for everyone involved. Given the expected continued growth of the e-commerce market, Shopify is well-positioned to thrive. Their recurring revenue from subscription fees offers stability and predictability to its cash flow. Moreover, Shopify is an innovative company, constantly expanding its product offerings, including payments, fulfillment services, and marketing tools.
Of course, there are some risks to consider. The e-commerce industry is highly competitive, and Shopify faces significant competition. Economic slowdowns could also impact Shopify as businesses might cut back on e-commerce spending. Additionally, the current environment of high inflation and high interest rates could pose challenges to Shopify’s business.
Despite these risks, Shopify is considered one of the best, if not the best, all-in-one e-commerce, and retail platform. They continue to innovate with new tools and are integrating AI features into their existing products. They continue to expand globally and are constantly acquiring more customers while driving down their customer acquisition costs and improving operational efficiency.
Overall, Shopify holds a strong position in a growing industry and should make a great addition to the portfolio.
Dividends
Dividends Received this week for the following companies:
Companies followed by DRIP (Dividend Re-Investment Plan) indicate additional shares were purchased with the dividend. Any cash leftover was added to the cash balance.
Canadian $
Dream Industrial Real Estate Investment Trust (TSE: DIR.UN) US $
Home Depot, Inc. (NYSE: HD)
Skyworks Solutions Inc (NASD: SWKS)
Quarterly Reports
No quarterly reports this past week.
Portfolio 2
Portfolio 2 for the week ended June 14, 2024: DOWN
At Microsoft’s (NASD: MSFT) Xbox Games Showcase, the company announced their all-digital Xbox console, and a host of new video games.
In other Microsoft news, the company announced they have cancelled the rollout of their new AI powered feature ‘Recall’ which tracks computer usage. ‘Recall’ allows users to search their computers browsing and web chat histories for something they did previously, even months earlier. The downside is anyone accessing the computer could also see another user’s history. The feature will be available only to those with new CoPilot+ enhanced computers and enrolled in Microsoft’s Windows Insider Program.
The company announced they plan to invest over US$ 7 billion to develop datacentres in northeastern Spain.
Canadian Natural Resources Limited (TSX: CNQ) executed a 2-for-1 split basis on Tuesday, June 11, 2024. While stock splits change the number of outstanding shares in circulation, they do not change a company’s market capitalization (outstanding shares X share price), nor underlying fundamentals.
MongoDB partnered with Bendigo and Adelaide Bank (ASX: BEN), a leading Australian bank, to update BEN’s core banking technology using MongoDB Atlas with AI as the underlying platform of the modernization. As a result of using MongoDB Atlas with AI, BEN cut the migration time by up to 90%, completing the task in three months, and doing it at 10% of the cost of a typical legacy system to cloud migration. Very impressive!
Activity
No significant activity to report this week.
Dividends
Dividends Received this week for the following companies:
Companies followed by DRIP (Dividend Re-Investment Plan) indicate additional shares were purchased with the dividend. Any cash leftover was added to the cash balance.
Shopify was on quite the winning streak, reaching 13 straight days before the shares ended lower on June 13. Its previous longest winning streak was 10 days ending May 6, 2024.
Activity
No significant activity to report this week.
Dividends
Dividends Received this week for the following companies:
Companies followed by DRIP (Dividend Re-Investment Plan) indicate additional shares were purchased with the dividend. Any cash leftover was added to the cash balance.
This week’s update kicks off with some promising news that could impact your future investments and for borrowers across the board, whether they are individuals with mortgages, personal loans, or businesses with loans. As anticipated, the Bank of Canada trimmed the Canadian benchmark interest rate by 0.25%. While it may seem like a small adjustment, it is a step in the right direction. Additionally, positive developments emerged on the US economic front, indicating a cooling job market, which often signals a slowdown in the US economy. This shift raises the possibility of a rate cut in the US later this fall.
In addition to the economic updates, we will continue our series addressing frequent questions from those new to investing, along with insights gained from my personal experiences. This week, while researching our question of the week, I stumbled upon something new of which I was not previously aware. Once again, the process of writing this blog proves to be a learning experience for me. 😊 Let’s take a look at other highlights from this past week….
Items that may only interest or educate me ….
Canadian Economic news, US Economic news, What about fractional shares?, What I learned this week, ….
Canadian Economic news
This past week’s key economic data that the Bank of Canada (BoC) considers when deciding whether to raise or lower the interest rate.
Interest rate update
As expected, the Bank of Canada (BoC) reduced the Canadian benchmark interest rate by 0.25%, bringing it down to 4.75%. This move marked the first rate cut in over four years and positioned Canada’s central bank as the first among the G7 nations (Canada, France, Germany, Italy, Japan, United Kingdom, and the USA) to take such action. The rate had remained steady at 5.0% for eleven consecutive months prior to this adjustment.
The rate cut was prompted by inflation dropping below 3.0%, putting it within the BoC’s target range of 1.0% – 3.0%. BoC officials expressed confidence in the direction of inflation, anticipating reaching the 2% target sometime in 2025. However, they also noted concerns about a slowdown in the Canadian economy. The BoC is attempting to achieve a ‘soft landing,’ where inflation returns to 2% without stalling economic growth entirely. Additionally, they pointed out that the US economy is starting to slow, which could lead to decreased demand for Canadian products.
The modest 0.25% rate cut suggests the BoC is taking a gradual approach to adjusting interest rates while carefully monitoring the impact of their actions on inflation and economic growth. BoC Governor Tiff Macklem hinted at further cuts in the future but cautioned against expecting a return to pre-pandemic levels. For those who believe high rates have been a drag on stocks for the last two years, lower rates cannot come soon enough.
Lowering interest rates carries the risk of widening the gap between the Canadian and US benchmark rates. With US Federal Reserve officials signaling no imminent cuts to the US rate, such a gap could weaken the Canadian dollar against the US dollar, making imports more expensive for Canadians. Following the announcement, the Canadian dollar only experienced a slight decline. However, if the BoC follows through on its indications to lower the Canadian rate further, the disparity with the US rate could widen, potentially resulting in a more pronounced drop in the Canadian dollar’s value.
Labour Force Survey (LFS)
Statistics Canada’s May Labour Force Survey (LFS) presented a mixed picture of the job market, with jobs, unemployment and wages all higher. The Canadian economy added 27,000 jobs in May, surpassing analysts’ expectations of 22,500 jobs. This follows an unexpected surge of 90,400 jobs in April. The increase was mainly due to a 1.7% rise in part-time employment, while full-time employment dipped by 0.2%.
The unemployment rate matched analysts’ predictions, coming in at 6.2% in May, slightly up from 6.1% in April. Unemployment has been on the rise since April 2023, climbing by 1.1% over that period.
Wage growth, a key concern for the BoC, also picked up pace, accelerating to an annual rate of 5.1%, compared to 4.7% in April.
Following April’s unexpected surge of 90,400 jobs, the lower number of jobs in May suggests the Canadian economy is cooling. However, the job numbers were still higher than expected. Of more concern to the BoC would be the increased wage growth. Yet, as far as the BoC is concerned, the rise in unemployment might offset the impact of higher jobs and wages.
After the BoC’s recent decision to lower the benchmark rate by 0.25% to 4.75%, many analysts anticipated another 0.25% cut in July. However, this mixed report has reduced the likelihood of a July cut.
Canadian market volatility
During the past week, Canada’s Volatility Index (VIXC), measured by the TSX 60, experienced a slight uptick, closing at 9.73, up from 8.30, amidst an otherwise stable period. This rise could be attributed to investor optimism stemming from the BoC’s interest rate cut and mixed US labour reports, which have fueled expectations of a potential rate cuts by the US Federal Reserve.
Often referred to as Canada’s ‘fear gauge,’ the VIXC offers insights into expected volatility within the Canadian stock markets. Readings above 20 typically indicate high volatility, while those below 20 suggest lower levels.
US Economic news
This past week’s key data points that the Federal Reserve (Fed) considers when deciding whether to raise or lower the interest rate.
Labour data
Each month, three labour market reports provide a snapshot of the current state of the American economy. Analyzing the latest data from the Job Openings and Labor Turnover Survey (JOLTS), ADP National Employment Report, and the Employment Situation Summary (ESS) provides a comprehensive view of the US labour market and reveals key trends in employment, and wage growth that can influence future economic policy.
Labor Department’s Job Openings and Labor Turnover Survey (JOLTS)
The Labor Department’s April JOLTS report revealed fewer job openings than expected, with 8.1 million available positions on the last business day of April. Analysts had been anticipating 8.340 million. This represents a 4% drop from the 8.488 million openings in March and an 18% decrease from the 9.9 million openings a year ago. These April numbers are the lowest since June 2021. Additionally, the ratio of job openings to each unemployed person fell to 1.24 from 1.3 in March.
When we look at the year-over-year data, ‘Private education and health services’ saw the largest increase in job openings, rising by 6.2%. In contrast, the ‘Information’ industry had the smallest increase at 3.5%. On a month-to-month basis, ‘Professional business services’ led the way with a 0.5% increase, while the ‘Information’ sector again underperformed, dropping by 1.3%. This decline in information sector jobs aligns with recent news that Alphabet (NASD: GOOGL) and Microsoft (NASD: MSFT) are planning to lay off hundreds of employees in the coming weeks.
The reduced number of job openings suggests that the labour market is continuing to cool down and is heading towards a more balanced state between labour supply and demand. This cooling labour market could help ease upward pressure on prices and continue to reduce inflation. However, with 1.24 job openings per unemployed person, the labour market remains relatively tight, indicating that there are still more job openings than unemployed individuals available to fill them.
ADP Employment Report
The May ADP Employment Report showed private payrolls growing by 152,000, a noticeable drop from the revised 188,000 in April and well below the analysts’ forecast of 175,000. Annual pay growth held steady at 5.0% for those who stayed in the same job. However, for job switchers, pay growth continued its decline, slipping to 7.8% from a revised 8.0% in April.
These lower hiring numbers and slower wage growth hint at a cooling job market, suggesting the possibility of a broader economic slowdown.
Bureau of Labor Statistics’ Employment Situation Summary (ESS).
The Labor Department’s ESS for May brought some surprises to the table. Nonfarm payroll employment saw a significant uptick, surging to 272,000 jobs, compared to a gain of 175,000 jobs in April. Analysts, who were expecting an increase of 185,000, were caught off guard by the robust numbers following a slowdown in April. Meanwhile, the unemployment rate saw a slight increase, coming in at 4.0% in May, contrary to analysts’ predictions of it remaining unchanged at 3.9%. This marked the first time in 27 months that it was not below 4.0%. Additionally, average hourly earnings rose 0.4% in May, up slightly from April’s 0.2% gain. On a year over year basis, the pace of wage growth accelerated to 4.1% from April’s 3.9% increase. Both number came in higher than analysts’ expectations of increases of 0.3% and 3.9%, respectively.
Despite April’s data showing signs of a slowing labour market, the May report paints a different picture. With more people joining the workforce and wages showing steady growth, the labour market remains robust. However, this unexpected surge in employment and wages does little to advance the case for the Fed to lower the interest rate.
Conclusion
Taken together, these reports paint a somewhat complex picture of the US labour market. The JOLTS report suggests a potential cooling down with fewer job openings compared to recent months. Similarly, the ADP report shows a decrease in hiring activity. However, the robust job growth and continued wage gains in the latest Employment Situation Summary (ESS) contradict this notion.
This discrepancy highlights the importance of considering multiple data points to understand the labour market’s true condition. While there might be signs of a slowdown in some sectors (like the ADP report suggesting), the overall picture from the ESS indicates a resilient job market.
The Fed will likely closely monitor these trends as they decide on future interest rate decisions. It will be crucial to see if the robust job market numbers from the ESS are sustained in the coming months, or if they were simply an anomaly.
American market volatility
The CBOE Volatility Index (VIX), known as the market’s fear gauge, dipped to 12.22 after reaching 12.91 the previous week. This decline could be attributed to mixed labour data and increasing speculation regarding potential rate cuts by the Fed later this year. With the VIX below the 20 threshold, commonly linked with market calmness, investors are feeling less apprehensive in the short term.
What about fractional shares?
Fractional shares are a revolutionary way to invest, allowing you to own a piece of even the most expensive companies without needing a huge amount of money upfront. The ease of buying fractional shares makes it super simple to start investing in some of the top companies. Think of investing in Constellation Software (TSE: CSU) for just $50 instead of needing thousands! While this feature is more common in the US at brokers such as Robinhood, Fidelity, and Charles Schwab, Canadian options are limited. Fortunately, a few Canadian brokerages such as Wealthsimple and Interactive Brokers offer fractional share purchases allowing you to invest in expensive companies with smaller amounts. Unfortunately, trading accounts with most Canadian banks do not support this capability (at least my TD Direct Investing account does not).
If the companies you are interested in are very expensive, buying a fraction of share might be an effective way to become an owner. Fractional shares offer several advantages over whole shares, especially for beginning investors or those on a budget:
Lower barrier to entry: This is the biggest perk. Fractional shares allow you to invest in companies with high share prices that might otherwise be out of reach. For instance, if a stock trades at $1,000 per share, you can still invest in the company with a smaller amount, say $200, which would buy you a fraction of a share.
Improved diversification: A core tenet of investing is diversification, which means spreading your money across various investments to reduce risk. Fractional shares allow you to include more companies in your portfolio without a significant upfront investment. This helps you achieve better diversification even with limited capital.
Dollar-cost averaging: This strategy involves investing a fixed amount of money at regular intervals. Fractional shares can be particularly useful for dollar-cost averaging because you can invest your set amount regardless of the stock price. This allows for consistent participation in the market.
Invest leftover cash: If you have small amounts of money leftover after other investments, fractional shares enable you to put that money to work rather than letting it sit idle.
Potentially faster returns: With fractional shares, you can start benefiting from potential growth and dividends sooner rather than waiting to save enough for a whole share.
Remember, while there are advantages, there are also some things to consider with fractional shares:
Voting rights: Generally, only holders of whole shares get voting rights on company matters. Fractional share ownership typically does not come with voting rights.
Dividend distribution: Dividends are typically paid per share. With a fractional share, you might receive a very small fraction of a dividend, which some brokerages may round down to zero.
Potential fees: Some brokers may have minimum fees per trade. With fractional shares, this could eat into a smaller investment more proportionally than with a whole share purchase.
Psychology: Some investors may prefer the simplicity of owning whole shares. It can be easier to track and understand your portfolio holdings when dealing in whole numbers.
If you are interested in buying fractional shares, check with your broker to confirm they offer this service and understand any potential transaction fees, as policies can vary. To optimize your investment, consider using an online broker that does not charge transaction fees. After all, buying a $100 fractional share only to lose $10 in fees each time you purchase a fractional share would almost defeat the purpose.
What I learned this week
The group of five mega-cap tech companies – Nvidia (NASD: NVDA), Microsoft, Amazon.com (NASD: AMZN), Meta (NASD: META), and Alphabet – have been given the nickname “Fab Five” due to their outstanding returns over the last two years. All five have seen their share price rise on strong earnings because of high demand for artificial intelligence (AI) products and services.
The big question is, can that high demand continue? Many analysts believe it can. Companies need to invest in AI to stay competitive. When times are good and cash is flowing, companies invest in AI to keep up with their rivals. When times are tough, AI can help companies’ lower costs by reducing expenses.
Here is something else I discovered: you can buy stocks in fractional units in Canada. Who knew? There is always something to learn in investing. 😊
Weekly Market Review
Monday: the markets got off to a shaky start this month with the Toronto Stock Exchange Composite Index (TSX) and the Dow Jones Industrial Average (DJIA) ending in the red while the S&P 500 Index (S&P), and the Nasdaq Composite Index (Nasdaq) ended in the green. Oil prices dropped sharply on demand concerns, despite OPEC+ members (Organization of the Petroleum Exporting Countries and allies) extending their oil production cuts until the end of 2025.
In Canada, lower oil prices acted as a lead weight for the TSX, offsetting gains in Consumer Staples and Utilities, the top two performers in the Canadian sectors. The biggest drops were in the Energy and Healthcare sectors.
In the US, a glitch at the NYSE caused many of the NYSE listed stocks to be halted due to massive price swings. Lower manufacturing data weighed on the markets for the second month in a row, giving investors hope the Fed could start lowering rates in September. In trading, Technology, Healthcare and Consumer Staples were the only American sectors to post a daily gain. At the other end of the spectrum, Energy and Utilities posted the biggest daily drops.
Tuesday: in a choppy day of trading, the American indexes ended higher, while the TSX ended lower. Oil prices have fallen to their lowest price in over four months on concerns of oversupply.
In Canada, signs of a slowdown in the global economy has led to a drop in commodity prices which in turn has weighed on the resource heavy TSX. investors await tomorrow’s rate decision by the BoC. In trading, Consumer Staples and Industrials sported the biggest wins while Basic Materials (miners and fertilizer manufacturers) and Energy lost the most.
In the USA, a weaker than expected job openings report provided further evidence that the US economy is slowing. For those wanting a rate cut this is good news. For those looking for work, not so good news. In trading, Telecommunications Services and Consumer Staples advanced the most while Basic Materials and Energy suffered the biggest decline.
Wednesday: a cut to Canadian interest rates and US economic data suggesting a cooling US economy propelled all four indexes solidly into positive territory for the day. The price of oil rose on optimism the Fed will cut interest rates later this year.
In Canada, the BoC lowered the benchmark rate to 4.75% and suggested more rate cuts were likely. The expectations of a US rate cut later in the year led to a rise in commodity prices, adding to the TSX’s gains. All Canadian sectors ended higher, led by Basic Materials and Technology, with Telecommunications Services and Financials bringing up the rear.
In the US, the S&P and Nasdaq closed at record highs as the job market continues to slow, causing investors to believe the Fed will lower rates later this year. In trading, it was a day of broad-based gains, led by Technology and Industrials. Utilities was the only sector to end lower.
Thursday: the indexes ended with mixed results as investors await tomorrow’s US labour report, looking for further signs of a slowing US economy. The TSX and DJIA ended in the green while the S&P and the Nasdaq ended in the red. The European Union’s European Central Bank joined Canada and lowered its benchmark rate for the first time since 2019, dropping the rate 0.25% to 3.75%. Oil prices continued to rally on speculation the Fed will lower interest rates in the fall.
In Canada, commodity prices rose, boosting the resource oriented TSX higher. Investors are waiting for the latest employment number from Canada and the US, due Friday. In trading, Basic Materials and Energy led all Canadian sectors, while Consumer Cyclicals and Telecommunications Services suffered the biggest declines.
In the USA, this week’s softer than expected labour reports have investors once again believing the Fed will lower rates this year. In trading, Basic Materials and Consumer Cyclicals gained the most, while Utilities and Industrials lost the most.
Friday: all four indexes ended the session lower after a stronger-than-expected US labour report pushed back expectations of an interest rate cut by the Fed until this fall at the earliest. Oil was down on lowered expectations of a rate cut, offsetting news Saudi Arabia and Russia were prepared to halt or reverse output increases scheduled for this fall if there was an oversupply of oil.
In Canada, stronger than expected Canadian labour data may have pushed back the timing of the next cut to Canadian rates. As well, concerns that the Fed will hold interest rates higher for longer weighed on the TSX. In trading, Technology and Consumer Cyclicals were the only sectors to record a gain. Basic Materials and Industrials had the biggest declines.
In the US, all three indexes were bouncing up and down throughout the session as investors were uncertain about the mixed messages from the labour report. On one hand, it indicated a strong economy. While on the other, it likely delayed a possible rate cut. The mixed messages resulted in a sector wide decline during trading. Technology and Healthcare had the smallest drop, while Basic Materials and Telecommunications Services had the steepest drops.
Weekly Market and Portfolio Review
For the week, the TSX (SPTSX) slipped 1.2%, the S&P 500 (SPX) rose 1.3%, the DJIA (INDU) inched higher 0.3% and the Nasdaq (CCMP) gained 2.4%.
Index
Weekly Streak
TSX:
3 – week losing streak
S&P:
1 – week winning streak
DJIA:
1 – week winning streak
Nasdaq:
1 – week winning streak
June started off on a positive note with the Nasdaq and S&P posting solid gains, and the DJIA also finishing in the win column. Unfortunately, the TSX slid lower, as illustrated in the chart above.
In Canada, the BoC became the first G7 central bank to lower its interest rate, giving the TSX a mid week boost. Later in the week, the European Union’s central bank followed suit. Canadian and American labour reports also played a significant role. On Friday, stronger-than-expected Canadian labour data possibly postponed a second interest rate cut in July. On the same day, mixed US jobs data weighed on the TSX, reversing gains from earlier in the week and ensuring a weekly loss.
In the US, the three major indexes carried over the previous week’s momentum and moved into positive territory early following two favorable labour reports. They maintained this upward trend until Friday’s third labour report of the week, which showed more jobs and accelerating wage gains but also higher unemployment, stalling their progress. This has led many investors to believe this has increased the chances the Fed could leave the rate at 5.5% for the next several months.
The price of oil continued its downward trend that began in early April. However, analysts predict it should rebound later this summer, which is encouraging news for the energy sector and those investors holding oil stocks.
Overall, it was a decent week in the North American markets and a good way to start the new month. The interest rate cuts in Canada and the European Union, along with signs of a slowing US economy, provided mostly positive news. Next week, all eyes will be on the Fed’s Federal Open Market Committee meeting to get a sense of when and how much the Fed plans to lower interest rates over the next six months. Hopefully, we will get favourable news and see the markets respond positively. 😊
Portfolio
Weekly Streak
Portfolio 1:
1 – week winning streak
Portfolio 2:
1 – week winning streak
Portfolio 3:
1 – week winning streak
It was great to see all three portfolios rebound this week after they all ended lower last week. As shown in the chart below, all three posted weekly gains, with Portfolio 1 leading the pack with an impressive 4.7% increase.
Portfolio 1 was the standout performer, surpassing not only the other two portfolios but also all four major indexes. While no stocks experienced significant (more than 10%) gains or losses, the majority advanced. Nvidia gave the portfolio a sizable boost, rising over $75.08 per share, and Costco (NASD: COST) added over $34 per share. To top it off, Nvidia executed a 10-for-1 stock split following Friday’s close.
Portfolio 2 lagged well behind the other two but still outperformed the TSX. Although MongoDB (NASD: MDB) continued its downward trend, its descent was not as steep as the previous week.
Portfolio 3 had a much better week compared to last. Most stocks in this portfolio gained value, although Lithium Americas (TSE: LAC) did drop by 10%.
Overall, it is great to see all three portfolios bouncing back into the weekly win column. Fingers crossed that the Fed leaves the door open for a September rate cut next week, so we can look forward to two-week winning streaks! 😊
Weekly Portfolio & Index performance for the week ended June 7, 2024.
Companies on the Radar
This past week, Vistra Corp (NYSE: VST) caught my attention. Vistra is an American Fortune 500 company operating in the integrated retail electricity and power generation sector. They provide reliable and affordable electricity to customers in several US states, and they own and operate numerous power generation facilities across the country. On top of that, the company is making significant strides towards a cleaner energy future with growing investments in renewables.
What makes Vistra particularly interesting is their dual advantage. Not only can they benefit from the shift to renewable energy, but they can also capitalize on the huge demand for clean power driven by the growth of data centers providing AI services.
Vistra joins the five other companies, listed below, on my radar list.
Equitable Bank (TSE: EQB), a mid sized Canadian bank, considered Canada’s 7th bank, that provides financial services to consumers and businesses.
Quanta Services, Ltd. (NYSE: PWR), a large-cap American company offering a wide range of specialty infrastructure solutions throughout the world
RELX PLC (NYSE: RELX), provides information-based analytics and decision tools for professional and business customers worldwide.
Vertiv Holdings (NYSE: VRT), an American company that designs and builds infrastructure and continuity solutions to businesses around the world.
Lumine Group (TSE: LMN), a young Canadian mid sized company that acquires communications and media software companies, and then strengthens and grows those companies.
Please keep in mind that these are only companies that have piqued my interest. This is not a recommendation or financial advice. You should do your own research or contact a professional before making any investment decisions.
The Radar Check was last updated June 7, 2024.
Stock on the Radar List. 1 of 2.Stock on the Radar List. 2 of 2.
Portfolio Update
Portfolio 1
Portfolio 1 for the week ended June 7, 2024: UP
Alphabet’s Google unit plans to layoff over 100 employees across several roles in their cloud computing unit.
In other Google news, the United Kingdom’s (UK) Competition Appeal Tribunal (CAT) ruled the company must face a mass lawsuit that accuses it of abusing its dominant position in online advertising. The lawsuit is seeking damages worth up to US$ 17.4 billion for website and app publishers in the UK. Naturally, Google rejects the claim.
In the US, Google was able to convince a US judge to dismiss a proposed class action lawsuit claiming the company misused personal and copyrighted information to train its chatbots.
Alphabet has a new Chief Financial Officer (CFO). Anat Ashkenazi joins Alphabet from Eli Lilly (NYSE: LLY) where she was the CFO. Alphabet’s previous CFO has moved over to the role of Chief Investment Officer.
Berkshire Hathaway’s (NYSE: BRK.B) power utility company PacifiCorp has agreed to pay US$ 178 million to resolve the claims that resulted from wildfires in Oregon in 2020.
Elsewhere in the Berkshire universe, their BHE Renewables unit has entered into a joint venture with Occidental Petroleum (NYSE: OXY) to extract lithium. Occidental would extract the lithium from the earth and BHE Renewables would produce high grade lithium at their geothermal facility in California. Side note: Berkshire Hathaway, the parent of BHE, owns 27% of Occidental.
Nvidia continues its climb to become the most valuable company in the world. The rise in share price has lifted the company over the US$ 3 trillion mark and past #2 Apple (NASD: AAPL).
Amazon.com’s robotaxi unit Zoox announced they plan to start testing their autonomous vehicles in Austin, TX and Miami, FL. Zoox uses customized Toyota Highlanders with human safety drivers. They will be used in small areas near the business and entertainment areas of each city. This follows ongoing tests in California and Nevada.
In other Amazon news, the company is being sued for US$ 1.3 billion by the British Independent Retailers Association (BIRA), claiming Amazon misused BIRA members data to further their own profits.
Walmart (NYSE: WMT) is replacing all of its paper shelf price labels with digital shelf labels. Weekly updates that took an employee two days to complete will now be done in two minutes
Activity
Bought:TD Investment Savings Account (TSE: TDB8150) (ISA) I initially planned to purchase a 1-year cashable Guaranteed Income Certificate (GIC) with a 3.55% interest rate to hold some excess cash for potential short-term needs. However, when I called TD Direct Investing, the rep informed me about TD Investment Savings Accounts (ISA) offering an interest rate of 4.55%.
The rep explained that ISAs are similar to mutual funds in that they can be bought and sold online through TD Direct Investing, but they have no management fees, no back or front-loaded fees, and no penalties for early withdrawal. In my case, the ISA not only provided a higher return but also offered more flexibility since I could sell anytime without penalty. Plus, my investment would be insured by the Canada Deposit Insurance Corporation (CDIC) in case of bank failure.
I repeatedly asked about any hidden catches, but the rep assured me there were none. The only potential downside is the variable interest rate, which could change with the BoC’s benchmark rate. However, even if the rate drops by 0.25%, matching the recent cut by the BoC, the return would still be 4.30%, still better than the GIC I was considering. Moreover, I could always move the cash if a better option came along.
With this information, I decided to park the cash in an ISA, where it would work harder for me than in a GIC.
Note that TD’s ISA tickers do not show up on Yahoo! Finance or MSN Money but are available on TD Direct Investing’s WebBroker. For more details on TD ISAs, click here. If you do not use TD Direct Investing, other Canadian banks likely offer comparable products. If you have a third-party trading account, check with them to see if they provide access to these or similar products.
Dividends
Dividends Received this week for the following companies:
Companies followed by DRIP (Dividend Re-Investment Plan) indicate additional shares were purchased with the dividend. Any cash leftover was added to the cash balance.
Microsoft is joining Google in trimming hundreds of employees in their Azure cloud computing division.
The US Department of Justice (DOJ) and the Federal Trade Commission (FTC) have struck a deal that will see them to initiate antitrust investigations into Microsoft, OpenAI and Nvidia regarding their dominant roles in the rapidly growing AI industry. The DOJ will take the lead against Nvidia, while the FTC will have the lead against Microsoft and OpenAI.
MongoDB hit its lowest close in over a year this past week. Along the way the stock set a number of records, including longest losing streak on record (Based on available data back to Oct. 19, 2017), and worst 11 day stretch on record (Based on available data back to Oct. 19, 2017). Those are records I would rather not hold. ☹
TC Energy (TSE: TRP) shareholders voted to split off the company’s liquids pipeline business. The new company will be called South Bow Corp, and their assets include the Keystone oil pipeline that moves crude oil from Alberta to the US Midwest and South. The spin off will allow TC Energy to reduce its debt and focus on shipping natural gas.
Activity
No significant activity to report this week.
Dividends
Dividends Received this week for the following companies:
Companies followed by DRIP (Dividend Re-Investment Plan) indicate additional shares were purchased with the dividend. Any cash leftover was added to the cash balance.
Canadian $
Fortis (TSE: FTS)
US $
No US$ dividends this past week.
Quarterly Reports
No quarterly reports this past week.
Portfolio 3
Portfolio 3 for the week ended June 7, 2024: UP
goeasy (TSE: GSY) announced their loan portfolios has surpassed C$ 4 billion in gross balances and they anticipate successfully meeting their goal of a $4.55 billion loan portfolio by the end of the year.
TD Bank (TSE: TD) was in the news again. Once again, not for a good reason. A branch employee in Florida has been accused of accepting bribes to move millions of dollars to Columbia. This is another instance of where TD’s anti money laundering practises fell short.
Activity
No significant activity to report this week.
Dividends
Dividends Received this week for the following companies:
Companies followed by DRIP (Dividend Re-Investment Plan) indicate additional shares were purchased with the dividend. Any cash leftover was added to the cash balance.
This past week, as I reviewed my three portfolios, I was surprised by the number of trades I had made in the past few months – a total of 21 across all portfolios. Unfortunately, all but one were on my TD Direct Investing account, costing me almost $200. While not a significant amount in the grand scheme, it is still $200 less available for investment. ☹️
Starting out in investing, transaction fees may not be top of mind. However, they quietly chip away at your returns and hinder your long-term goals. Even seemingly insignificant fees can pile up, especially with frequent trading, ultimately cutting into profits. For those with limited cash for investment, these fees can represent a significant portion of their investment, making portfolio growth more challenging.
Moreover, high transaction fees can discourage diversification. If you are charged every time you buy a different stock or fund, you might opt for fewer investments to avoid fees, thus increasing your risk. Additionally, these fees can complicate cost calculations, particularly during tax season, making it harder to track actual investment costs and profitability.
The psychological impact of knowing each trade incurs a fee can create a barrier, leading to hesitation and potentially causing missed opportunities. This frustration is compounded when compared to fee-free trading platforms, which offer the same services without extra costs. Overall, transaction fees are a tangible cost that can hinder your investment strategy and returns, proving to be a persistent annoyance for many investors.
However, it is important to remember that while some brokers offer commission-free trades, they may provide fewer features or research resources. Higher fees might be justified if they provide valuable services that enhance your investment decisions.
Ultimately, transaction fees are an inevitable aspect of investing. Striking a balance between fees and the features and services provided by your broker is key to successful investing.
This week, alongside our regular economic news update and market recap, we will explore the advantages of commission-free online brokers and delve into why opting for a trading platform with a nominal transaction fee might be advantageous. So, in the spirit of Daenerys Targaryen, ‘Let’s begin.'”
Items that may only interest or educate me ….
Canadian Economic news, US Economic news, Transaction fees, What I learned ….
Canadian Economic news
This past week’s key economic data that the Bank of Canada (BoC) considers when deciding whether to raise or lower the interest rate.
Gross Domestic Product (GDP)
Statistics Canada reported that the Canadian economy, as measured by GDP, grew at an annual rate of 1.7% in the first quarter, up from 1.0% in the fourth quarter. However, this growth fell short of analysts’ expectations of 2.2% and was well below the BoC’s forecast of 2.8%. On a quarterly basis, GDP rose by 0.4% in the first quarter of 2024, with consumer spending being a major driver of this growth.
On a monthly basis, GDP remained unchanged in March after a 0.2% increase in February. Both the ‘Goods producing industries’ and ‘Services producing industries’ sectors saw no growth for the month. The ‘Construction’ subsector was the best performer with a 1.1% increase, offset by a 0.8% decline in the ‘Manufacturing’ subsector. In the ‘Services producing industries,’ ‘Educational services’ grew the most at 0.5%, while ‘Management of companies and enterprises’ fell by 3.4%.
While it is good to see economic growth, the rate was slower than expected. Considering Canada’s growing population, GDP per capita has now fallen six times in the past seven quarters. The lower GDP data suggests the higher rates have cooled Canada’s economy. Analysts and investors believe this latest data clears the way for the BoC to lower Canada’s benchmark interest rate and increases the likelihood they reduce the rate. However, the BoC has made no signals they will lower the rate when they meet next week, so the decision to hold or cut the rate could go either way.
Canadian market volatility
Over the past week, Canada’s Volatility Index (VIXC), measured by the TSX 60, continued its downward journey, ending the week at 8.30 (down from 9.88) despite fluctuations throughout the week. The decrease in could be the result of the slowing Canadian economy, as indicated by the latest GDP report, which increases the BoC’s likelihood of lowering interest rates in June. Additionally, there has been a cooling off of inflation in the US, which may lead the US Federal Reserve to take similar action with their rates.
Often referred to as Canada’s “fear gauge,” the VIXC provides insights into expected volatility within the Canadian stock markets. Typically, readings above 20 signify high volatility, while those below 20 indicate lower levels.
US Economic news
This past week’s key data points that the US Federal Reserve (Fed) considers when deciding whether to raise or lower the interest rate.
Personal Consumption Expenditures (PCE)
The Department of Commerce’s Bureau of Economic Analysis reported that the PCE price index rose 0.3% in April, the same as in March. Year over year, the index increased by 2.7%, again matching March’s rise. Both numbers met analysts’ expectations.
The Fed’s favorite measure of inflation, core PCE, which leaves out the volatile food and energy components, went up 0.2% in April. This was a bit slower than the 0.3% growth rate in March, indicating that inflation eased slightly in April. However, on a year-over-year basis, core PCE increased by 2.8%, keeping pace with March.
Overall, the latest data shows that inflation is not rising and remains below 3% for both headline PCE and core PCE. Plus, core PCE declined on a monthly basis. While this suggests inflation might be falling, one month’s data is not enough to call it a trend. The Fed will need to see a few more months of cooling inflation before considering a cut to the US benchmark interest rate. If this downward trend continues, analysts believe the Fed might lower the rate as soon as their September meeting.
While the PCE data offers valuable insights into the Fed’s potential actions on interest rates, it is only one piece of the puzzle. The Fed will also consider a wide range of other economic indicators before deciding whether to maintain or lower interest rates.
Gross Domestic Product (GDP)
The Commerce Department’s Bureau of Economic Analysis released its “second” estimate for the first-quarter GDP, showing the economy grew at an annual rate of 1.3%. This matched analysts’ predictions but was slightly down from the initial, or “advance,” estimate of 1.6%. It is clear the economy has slowed considerably, especially compared to the 3.4% growth rate of the fourth quarter, marking the smallest increase in two years.
Several factors helped boost the GDP, including increases in consumer spending, residential and non-residential fixed investment, and state and local government spending. However, this growth was tempered by a decline in private inventory investment. This latest report suggests that the Fed’s higher-for-longer interest rates are indeed cooling the economy.
The second estimate is based on more complete data than what was available for the initial estimate released last month.
American market volatility
The CBOE Volatility Index (VIX), often regarded as the market’s fear gauge, jumped as high as 14.86 before ending the week at 12.91, up 8% from last week’s 11.93. This increase likely resulted from a slowing economy, uncertainty around when and how deep interest rates are likely to fall after the latest PCE inflation report showed inflation remained steady, just under 3%. With the VIX below the 20 threshold, typically associated with market calmness, investors remain less apprehensive in the short term.
Consumer Confidence Index (CCI)
The Conference Board reported that the CCI rose to 102.0 in May, up from an upwardly revised 97.5 in April. This higher reading was unexpected, especially since the CCI had declined for the past three months, and analysts had predicted a reading of 96.0.
The boost was driven by a more positive view of current business conditions. Of the two components of the CCI, the Present Situation Index increased to 143.1 in May from 140.6 in April, indicating that consumers are feeling slightly better about the current state of the economy. Meanwhile, the Expectations Index rose to 74.6 in May from 68.8 in April. Although this is an improvement, it still falls short of the 80 threshold that typically signals a healthy economy.
Overall, the report paints a mixed picture for consumer confidence. While there is a slight uptick in current sentiment, concerns about the future remain.
The Consumer Confidence Index (CCI) represents a sample of American households’ views on their current economic situation and their expectations for the next six months. The CCI has two main components.
The Present Situation Index measures consumers’ views on current business conditions, including employment, income, and overall economic activity. On the other hand, the Expectations Index looks at consumers’ outlook for the next six months, covering factors like job prospects, income expectations, and business conditions.
The overall CCI score (combining these indexes) reflects consumer optimism (above 100) or pessimism (below 100). The Expectations Index is particularly important, as a reading below 80 can signal a potential economic slowdown.
What about transaction fees?
Every dollar counts in the world of investing, and transaction fees can add up faster than you might realize and eat away at your investment returns. If you are just getting started investing, understanding the ins and outs of transaction fees is essential for maximizing your investment gains.
A few years ago, there were TV ads where folks blamed transaction fees for missed investment opportunities. But they are not telling the whole story. The full picture involves various factors such as stock selection, investment duration, and trading frequency. Success in investing depends on a combination of factors, however, eliminating transaction fees puts more money to work for you
If advanced features are not a priority, opting for a commission-free online broker can significantly reduce transaction costs, especially for frequent traders. In Canada, platforms like Wealthsimple Trade, Questrade, and TD Easy Trade offer commission-free trading, while in the US, Robinhood, E*TRADE, and Charles Schwab are popular choices. This is particularly beneficial for day traders and frequent traders, where transaction fees can accumulate rapidly.
However, if you are a “buy and hold” investor, paying $10 per transaction on 25 different companies amounts to $250 in fees. Even with a no-fee platform, would that $250 really make a difference in your long-term goals, like saving for a home or retirement? Probably not. Those fees often provide access to valuable features like advanced charting tools, price alerts, in-depth research reports, professional broker assistance, and phone support for trading or platform help. Brokers such as TD Direct Investing, Scotia iTRADE, and BMO InvestorLine provide these features alongside competitive fee structures.
In addition to fees, it is crucial to assess the security and customer service reputation of the brokerage. Some commission-free brokers have faced scrutiny over data security and trade execution quality, highlighting the importance of due diligence.
While transaction fees are a consideration, investing is about more than just minimizing costs. Your choice of brokerage should align with your investment goals, strategy, and comfort level with trading. Take the time to evaluate your needs and compare the features, fees, and services of different brokers to make an informed decision.
What I (re)learned
This past week, I got a reminder about after-hours trading on the American exchanges. On Thursday, following the release of MongoDB’s (NASD: MDB) quarterly earnings, I saw the company warned of lower revenues and lowered their forward guidance. This news caused the share price to drop about 10% in after-hours trading. The next day, the stock price fell even further, ending the week down 32%. I had been considering selling my MongoDB shares, and if I had acted immediately when I first heard the news and used the after-hours market, I could have saved some money.
This significant drop also reminded me that I do not have to sell all my shares of a company at once. When I first thought of selling MongDB a few weeks ago, I could have sold half or some other portion of my holdings. While I still would not have been happy with the big drop, at least the drop would not have been as painful.
Weekly Market Review
Monday: it was a slow day in the North American markets with the American exchanges – the S&P 500 Index (S&P), the Dow Jones Industrial Average (DJIA), and the Nasdaq Composite Index (Nasdaq) – closed for Memorial Day.
In Canada, higher commodity prices boosted the Toronto Stock Exchange Composite Index (TSX) into positive territory. In trading, Basic Materials (miners and fertilizer companies) and Financials posted the largest gains while Telecommunications Services was the only sector to end in the red.
Tuesday: A mixed bag for the indexes, with the S&P and Nasdaq rising and the TSX and DJIA falling. Investors concerns about persistent inflation is once again weighing on the markets as yet another Fed member expects US rates to remain higher for longer. Oil prices rose on expectations that OPEC+ countries will extend supply cutbacks through the summer.
In Canada, concerns about the timing and extent of US interest rate cuts acted as drag on the TSX. In trading, Basic Materials, Energy and Technology were the only sectors to rise, while Industrials and Consumer Staples led decliners.
In the US, rejuvenated by the long weekend, traders pushed the Nasdaq to another record high when it closed above 17,000, largely on the strength of a surging Nvidia (NASD: NVDA) which hit an all time high itself. In trading, Energy, Technology and Consumer Cyclicals were the only sectors to advance, while Industrials and Consumer Staples had the biggest declines.
Wednesday: hawkish comments from a Fed official and a spike in US bond yields to over 4.5% caused all four indexes to tumble into the red. Fears of higher interest rates combined with concerns of lower demand for gasoline in the US led to a drop in oil prices.
In Canada, US interest rate concerns were a drag on the TSX. A weaker than expected earnings report from the Bank of Montreal (TSE: BMO), caused by higher loan loss provisions, also weighed on the index. In trading, only the Consumer Staples sectors was able to avoid falling into negative territory. Financials and Basic Materials fell the deepest into the red.
In the US, concerns of higher for longer interest rates has led to rising US bond yields which has overshadowed and offset the run in AI related companies. In trading, all American sectors lost ground. Technology and Telecommunications Services dropped the least while Energy and Basic Materials fell the hardest.
Thursday: fears of higher for longer interest rates and signs of a slowing US economy caused the American indexes to spend the day in the red, while the TSX index was able to remain in the green all day. Investors now await the latest update on inflation in the US, due tomorrow morning.
In Canada, the TSX got a boost from a better-than-expected earnings report from the Royal Bank (TSE: RY). News of a slowing US economy was also well received. In trading, Financials and Telecommunications Services led a broad rally that had only the Technology sector failing to post a gain.
In the USA, the first quarter GDP report showed the economy grew less than expected suggesting the economy is starting to slowdown. In trading, despite all three indexes ending lower most of the American sectors ended higher, led by Consumer Staples and Energy. However, the bigger Technology and Telecommunications Services sectors fell hard, overwhelming the other sectors.
Friday: the week ended on a mostly positive note as only the Nasdaq failed to post a daily gain. All four indexes moved sharply upward at the end of the day as many professional portfolio managers repositioned their portfolios to align with the investment objectives of the portfolios. Oil prices fell as investors worried production cuts might not be extended at a meeting of OPEC countries this weekend, thereby increasing the supply of oil.
In Canada, the latest GDP data showed the Canadian economy was slowing, increasing the chances the BoC will cut the rate at their June meeting. In trading, it was a day of broad-based advances for the Canadian sectors, led by Consumer Cyclicals and Energy. Basic Materials was the only sector to come up short.
In the US, the core PCE reading showed the pace of inflation growth in April had slowed since the previous month. In trading on Wall Street, Energy and Telecommunications Services posted the biggest gains, while Technology was the only sector to end lower.
Weekly Market and Portfolio Review
For the week, the TSX (SPTSX) slipped 0.2%, the S&P 500 (SPX) dropped 0.5%, the DJIA (INDU) fell 1.0% and the Nasdaq (CCMP) sank 1.1%.
Index
Weekly Streak
TSX:
2 – week losing streak
S&P:
1 – week losing streak
DJIA:
2 – week losing streak
Nasdaq:
1 – week losing streak
This past week was a tough one for the markets, with all four major North American indexes ending lower, as shown in the chart above.
In the US, the week began on a positive note, pushing the Nasdaq above 17,000 for the first time. The momentum from a rally sparked by Nvidia’s earnings report carried over into this week. However, comments from various Fed officials suggesting that interest rates are likely to remain high for longer than expected quickly dampened the rally, pushing the indexes into negative territory. On the economic front, the latest US GDP report showed the American economy slowing down, which reignited investor hopes that the Fed could start cutting rates as early as September. One other piece of good news was that the core PCE data showed the pace of inflation had slowed.
In Canada, the TSX started strong as rising commodity prices continued to boost the index. However, similar concerns about prolonged higher US interest rates weighed on the TSX as well. Additionally, a weaker-than-expected Canadian GDP report increased investor belief that the BoC might start lowering interest rates at their June meeting.
Overall, it was not the best week to close out an otherwise good month. Looking ahead, investors will be focusing on the US job market next week for signs of whether the American economy is continuing to slow down.
Portfolio
Weekly Streak
Portfolio 1:
1 – week losing streak
Portfolio 2:
2 – week losing streak
Portfolio 3:
2 – week losing streak
With the indexes having a rough week, it was no surpise that all three portfolios decreased in value this past week, as illustrated in the chart below.
Portfolio 1 fared the best among the portfolios, thanks to significant gains from Pulse Seismic (TSE: PSD), which rose by 10%, and Decisive Dividend (TSE: DE), which increased by 12%. It also got a substantial boost from Nvidia’s US$50 per share increase. Unfortunately, these gains were not enough to counterbalance declines in half of the stocks in the portfolio, including a 14% drop by Hammond Power Solutions (TSE.V: HPS.A) and a 13% fall by Celsius Holdings (NASD: CELH).
Portfolio 2 had a particularly tough week. In addition to Hammond Power Solutions’ drop, MongoDB fell by a staggering 32%. Around 66% of the holdings either declined or remained flat this past week, which didn’t help its performance.
Portfolio 3 didn’t have a good week either. While Lithium Americas (TSE: LAC) was the only company that saw a significant drop, losing 13% of its value, nearly 80% of the companies in the portfolio were either down or flat. It’s tough to post a weekly gain when so many companies are losing ground. ☹
Overall, it was a challenging week for the portfolios, mirroring the broader market’s decline. Let us hope for better performance in the coming weeks. With earnings season winding down, investors will now turn their eyes to next week’s labour data in Canada and the US.
Weekly Portfolio & Index performance for the week ended May 31, 2024.
Monthly Market Review
For the month, the TSX (SPTSX) rose 2.6%, the S&P 500 (SPX) gained 4.8%, the DJIA (INDU) increased 2.3% and the Nasdaq (CCMP) jumped 6.9%.
Despite a tough final week, May ended on a positive note with all four major North American indexes making gains, ashown in the chart above.
The month started strong. The TSX, S&P, and Nasdaq, which had all set record highs earlier this year, were joined by the DJIA hitting a milestone, closing above 40,000. Strong earnings reports, especially from the tech sector, boosted investor confidence. However, by late May, the mood began to shift. Comments from Fed officials about potentially keeping interest rates high to fight inflation dampened enthusiasm and led to a market pullback.
In the US, uncertainty grew with the latest GDP report showing a slowdown in economic growth. While this hinted at possible rate cuts in the future, it clashed with the Fed’s message of rates remaing high for longer, leaving investors with mixed signals. On a brighter note, inflation data provided some relief, with core PCE figures indicating slowing price increases. Sector performance also played a key role. Tech stocks, initially strong, faced pressure due to fears that higher interest rates would impact their future earnings. However, a strong earnings report and forward guidance from Nvidia sparked a rally in AI related companies before a rotation out of technology companies caused the Nasdaq to lose some steam.
Meanwhile, in Canada, the TSX was bolstered by rising commodity prices, which climbed throughout most of the month. The US economic slowdown, concerns of prolonged high US interest rates, and Canadian economic data showing a cooling economy also influenced the TSX. Many analysts and investors now expect that the BoC will cut interest rates at their June meeting.
The energy sectors in both countries felt the impact of the ongoing conflict in the Middle East, possible lower demand, and concerns over prolonged high interest rates.
As the month drew to a close, fund managers in Canada and the US made their usual end-of-month portfolio adjustments, likely adding some last-minute upward momentum to the markets.
In the end, May wrapped up with all three major American indexes achieving their sixth monthly gain out of the last seven.
May presented a mixed bag for the three portfolios, with each experiencing its own set of challenges amidst a generally positive market backdrop. As indicated in the chart below, Portfolio 1 stood out as the top performer, even surpassing all the indexes in the process – but hey, we are not keeping score here! 😊
Portfolio 1 owes its success to standout performances from tech giants like Nvidia. While it managed to consistently increase in value throughout the month, it did hit a slight snag in the final week. Portfolio 2 had its share of highs and lows, with two solid weeks countered by two less-than-ideal ones, ultimately dragged down by a disappointing earnings report from MongoDB this last week. Meanwhile, Portfolio 3 started off strong, only to take a hit when Shopify’s (TSE: SHOP) share price took a tumble, before recording minor gains and losses to finish out the month.
Overall, Portfolio 1’s gains outweighed the losses of Portfolios 2 and 3 combined, although I did not anticipate the latter two posting monthly losses. However, this past month serves as a reminder of how one stock can significantly impact a portfolio. In the case of Portfolio 1, Nvidia propelled it higher, while MongoDB and Shopify had negative effects on Portfolios 2 and 3, respectively. I accept this risk, considering the substantial returns these companies have generated since I invested in them, and each has played a crucial role in wealth generation for their respective portfolios.
Here is hoping for positive developments going forward – with the BoC potentially lowering the Canadian interest rate, US inflation continuing to fall while the economy remains robust, and all my companies performing well. If they do, the share prices should follow suit and lift the portfolios higher.
Companies on the Radar
This past week, I decided to remove Evolution AB (OTCM: EVVTY) and LVMH Moët Hennessy – Louis Vuitton, Société Européenne (OTCM: LVMUY) from my radar list as I continue to trim the list. Both of these companies are based in Europe and primarily trade on European exchanges, but they also have depository receipts (DRs) trading in the US Over the Counter Market.
A DR is a certificate issued by a bank that represents shares in a foreign company traded on a local stock exchange. It essentially acts as a middleman, allowing you to invest in overseas companies without the complexities of directly dealing with foreign markets or currency exchange. When you buy a DR, you are not purchasing the foreign company’s shares directly but rather the depositary receipt, which represents ownership of those shares. Personally, I prefer to own shares in a company directly. For more information on DRs, check out this page on Depository Receipts.
This past week, I added Vertiv Holdings (NYSE: VRT) to my radar list. Vertiv is an American company that designs and builds infrastructure solutions, including power, thermal, and IT infrastructure monitoring and management. Their products and services are sold globally across various industries, particularly the rapidly growing data center and communication networks sectors.
Vertiv joins the four other companies, listed below, on my radar list.
Equitable Bank (TSE: EQB), a mid sized Canadian bank, considered Canada’s 7th bank, that provides financial services to consumers and businesses.
RELX PLC (NYSE: RELX), provides information-based analytics and decision tools for professional and business customers worldwide.
Quanta Services, Ltd. (NYSE: PWR), a large-cap American company offering a wide range of specialty infrastructure solutions throughout the world
Lumine Group (TSE: LMN), a young Canadian mid sized company that acquires communications and media software companies, and then strengthens and grows those companies.
Please keep in mind that these are only companies that have piqued my interest. This is not a recommendation or financial advice. You should do your own research or contact a professional before making any investment decisions.
The Radar Check was last updated May 31, 2024.
Stock on the Radar List. 1 of 2.Stock on the Radar List. 2 of 2.
Portfolio Update
Portfolio 1
Portfolio 1 for the week ended May 31, 2024: DOWN
Apple (NASD: AAPL) reported a sales increase of 52% in China compared to a year ago. A good sign after sales in the first quarter had slumped.
Lightspeed Commerce (TSE: LSPD) has signed a deal with Uber (NASD: UBER) to integrate Uber Direct and Uber Eats marketplace into the Lightspeed ecosystem. The deal will allow Lightspeed Merchants to list their menus on, and take orders from, Uber Eats. Lightspeed merchants will also be able to take orders from their own website and provide delivery services through Uber Direct while the merchant only pays the delivery fee. This partnership should work for both Lightspeed and Uber.
CrowdStrike (NASD: CRWD) and Cloudflare (NASD: NET) have partnered to provide an integrated cybersecurity solution.
Alphabet’s (NASD: GOOGL) has partnered with augmented reality startup Magic Leap. Together they are working on building immersive experiences that blend reality and the digital world. Perhaps Google is getting back into the world of augmented and virtual reality after Apple kind of made virtual reality glasses cool. 😊
Activity
Received interest on TD 1-year cashable GIC.
Bought: CN Rail (TSE: CNR) This is my second investment in CN Rail, Canada’s largest railway company. Their dominant market position and diversified revenue streams, spanning sectors like intermodal (shipping containers) and grain/fertilizers, provide stability and mitigate risks tied to individual commodities. Plus, their growing presence in the US market offers more growth potential.
While CN Rail, like most railway companies, has a higher debt level due to the capital-intensive nature of the industry, they maintain a healthy balance sheet with good management of that debt. This is reflected in their consistent track record of growing revenues, net income, and earnings per share.
Of course, there are some risks. Economic slowdowns in Canada or the US could impact revenue. Fluctuations in commodity prices and regulations in the heavily regulated rail industry could affect profitability. Additionally, competition from other rail companies and trucking firms is a factor.
However, CN Rail’s established position, consistent performance, and well-managed debt structure make it a compelling long-term holding. As long as the need for long-distance freight shipping persists, railways will remain crucial. I am confident CN Rail will maintain its dominance in North America, offering steady growth and a 2% dividend, which helps balance out the riskier parts of my portfolio.
This is my second investment in Ferrari. My initial investment was more for the thrill of being able to say I owned a piece of Ferrari. 😊 After being an owner for a few years and witnessing how well the company has performed, – strong revenue growth, a healthy 49.94% gross profit margin, and a 33% EPS increase in the last year – I decided to add to my holdings.
As well as continuing to build high performance luxury sports cars, Ferrari is strategically investing in electric vehicles (EV) with a new state-of-the-art plant for EV components. This move positions them well in the evolving automotive landscape. Their focus on innovation, brand strength, and value-over-volume strategy creates a significant competitive advantage (moat).
Of course, no investment is without risk. Ferrari’s reliance on the luxury market, potential challenges in the EV space, and stricter regulations could all impact their future performance. The current premium stock price might also limit future growth potential.
Despite the inherent risks, Ferrari’s robust financial performance, strategic investments in EV technology, and enduring brand legacy make it a compelling long-term holding. I am confident that Ferrari will continue to innovate and adapt, solidifying its position as a leader in the luxury automotive market, both for traditional and EVs.
Dividends
Dividends Received this week for the following companies:
Companies followed by DRIP (Dividend Re-Investment Plan) indicate additional shares were purchased with the dividend. Any cash leftover was added to the cash balance.
Despite beating the markets’ earnings expectations, MongoDB lost roughly 32% this past week after the company lowered its full-year outlook for revenues due to a slower-than-expected start for its Atlas database product. Once again, the market reminds us that while it appreciates what a company has done, it is forward looking and does not like surprises to the downside.
Guardant Health (NASD: GH) announced it was named to Time Magazine’s TIME100 Most Influential Companies list for their work in the cancer detection and prevention.
Activity
Sold:Chorus Aviation (TSE: CHR) I first invested in this Canadian aviation company back in September 2017 and added to my investment in July 2018. At that time, Chorus Aviation paid a decent dividend, was showing growth, and its share price was steady. However, when the pandemic hit, the company canceled its dividend, and the share price plummeted. Unlike other airlines that have since recovered, Chorus’s stock has not bounced back.
The company’s lack of growth has caused me lose interest. I believe there are now better investment opportunities with more growth potential, so I decided to cut my losses and move on.
Dividends
Dividends Received this week for the following companies:
Brookfield (TSE: BN) and Brookfield Renewable (TSE: BEP.UN) announced they had partnered with the Singapore sovereign wealth fund Temasek to acquire French renewable energy company Neoen (OTCM: NOSPF) for US$43.08 per share. The acquisition will help BEP.UN expand into key renewable markets and add expertise in the growing battery storage technology industry.
Activity
No significant activity to report this week.
Dividends
Dividends Received this week for the following companies:
Companies followed by DRIP (Dividend Re-Investment Plan) indicate additional shares were purchased with the dividend. Any cash leftover was added to the cash balance.
In a week marked by light economic news, Nvidia (NASD: NVDA) dominated the headlines. Investors were eager to see if Nvidia could meet sky-high expectations and whether the artificial intelligence (AI) fueled rally would keep rolling.
Nvidia not only met but surpassed expectations, reaffirming its dominance in the AI market. The company delivered an exceptional earnings report, exceeding analysts’ forecasts and offered a bullish outlook for second-quarter revenues. Additionally, Nvidia announced a 10-for-1 stock split slated for June 7, accompanied by a dividend hike from US$ 0.04 to $ 0.10 per share (after the split the dividend will be $ 0.01 per share, not much but better than nothing 😊). While aimed at enhancing accessibility for retail investors, the stock split will not dilute their ownership stakes.
Following a minor 0.5% dip during Wednesday’s regular trading hours prior to Nvidia’s earnings report, Nvidia’s shares surged by 9.4% the following day, surpassing the $1,000.00 mark and settling at $1,064.69 at week’s end, representing a 12% increase since the earnings release. Though not as substantial as last year’s 24% surge following the earnings report, Nvidia’s current performance is impressive.
As of May 24, 2024, Nvidia’s share price has soared by 115% year-to-date, solidifying its position as the third-largest company by market value, trailing only Microsoft and Apple.
Nvidia reported impressive quarterly earnings, with revenues reaching $26 billion, up 262% from the same period last year and nearly double the previous quarter’s revenues. Net income surged by 628% to $14.88 billion. The robust quarterly report and a forecast of $28 billion in revenues for the next quarter instilled confidence in investors, underscoring the sustained potential of AI driven chip demand. Nvidia’s success also boosted other AI-associated companies.
While data centres and the surging demand for AI chips from cloud giants like Google (NASD: GOOGL), Amazon (NASD: AMZN), Microsoft (NASD: MSFT), and Meta (NASD: META) (who together account for nearly 40% of data centre sales) remain the primary driver of Nvidia’s revenue growth, co – founder and Chief Executive Officer Jensen Huang said the company wants to expand its market beyond data centres and major technology firms. Nvidia has forged partnerships with leading automakers like Tesla (NASD: TSLA), biotech companies like Roche (OTCM: RHHBY), and healthcare leaders like Johnson & Johnson (NYSE: JNJ) to leverage AI in various applications, from self-driving cars to drug development and surgical procedures. This multi-pronged approach strengthens Nvidia’s position as a leader in AI technology and provides diverse revenue streams to reduce risk and improve financial stability.
Nvidia stands as the undisputed leader in AI chips, commanding up to 95% of the market by some estimates. Its early recognition of AI’s potential, coupled with the development of powerful semiconductors custom built for AI applications, and comprehensive solutions encompassing chips, software, and specialized computers, cemented its dominant position. As long as cloud computing heavyweights – Amazon, Google, and Microsoft – continue their race to expand and build new datacentres and AI capabilities, sales of NVidia’s latest chips will continue. Their spend is Nvidia’s revenue. 😊 At least until their own AI compatible chips come online.
Not bad for a company that started out in 1993 as a builder of video graphics card for computer gamers. 😊
Now that we have reviewed the latest developments in Nvidia’s earnings report, let’s continue the series of questions frequently asked by newcomers to investing, and see what else happened in the markets this past week….
Items that may only interest or educate me ….
Canadian Economic news, US Economic news, How much money should I expect to invest to start? .…
Canadian Economic news
This past week’s key economic data that the Bank of Canada (BoC) considers when deciding whether to raise or lower the interest rate.
Consumer price Index (CPI)
Statistics Canada reported that April’s consumer price inflation, as measured by the CPI, slowed to an annual rate of 2.7%, marking a three-year low since March 2021’s 2.1% reading. This figure met expectations and, more importantly, was down from 2.9% in March. On a monthly basis, the CPI increased by 0.5% in April, also matching expectations and down from the 0.6% increase in March. A surge in gasoline prices, driven by the switch to summer blends, supply concerns, and an increase in the federal carbon tax, prevented a lower overall inflation reading.
The Bank of Canada’s preferred measure of inflation, core CPI (which excludes food and energy prices), rose 0.3% from March and 2.7% from April 2023.
For headline CPI (all items measured in the CPI), on a monthly basis, ‘Gasoline’ saw the largest increase, up 7.9%, while ‘Recreation, education and reading’ prices experienced the largest decline, down 0.7%. Year over year, ‘Shelter’ saw the biggest increase, up 6.4%, while ‘Clothing and footwear’ had the biggest decline, down 2.6%.
The lower inflation data, both headline and core, is good news for the BoC, which stated at their April meeting that they wanted more evidence that inflation was falling towards their 2% target. This latest report is the fourth consecutive month of falling inflation and should provide further proof inflation continues its downward trend. However, they must consider the US Federal Reserve’s ‘higher for longer’ approach. If Canadian rates diverge too far from US rates, it could cause the exchange rate to rise, making American products more expensive.
Overall, I am hopeful the BoC will lower Canada’s benchmark interest rate at their June 5 meeting, but not so much that imports become overly expensive. That would be the best of both worlds. 😊
Canadian market volatility
Over the past week, Canada’s Volatility Index (VIXC), measured by the TSX 60, continued its downward trend, closing at 9.88 (down from 10.19) despite fluctuations throughout the week. The decrease in volatility likely reflects easing inflationary pressures, which increases the Bank of Canada’s (BoC’s) likelihood of lowering interest rates in June.
Often referred to as Canada’s “fear gauge,” the VIXC provides insights into expected volatility within the Canadian stock markets. Typically, readings above 20 signify high volatility, while those below 20 indicate lower levels.
Retail Sales
In March, Canadian retail sales dipped by 0.2%, marking the third consecutive month of declining consumer spending following a 0.1% drop in February. Despite analysts’ expectations of flat sales, most sectors experienced sluggish performance, with the exceptions of the ‘Motor vehicle and parts dealers’ and ‘Building material suppliers’ sectors. On an annual basis, however, consumers showed resilience with sales up by 1.9%, led by a robust 6.8% growth in the ‘General merchandise retailers’ sector. Conversely, ‘Sporting goods, hobby, musical instrument, book, and miscellaneous retailers’ saw the steepest decline, plummeting by 6.9%.
Core retail sales, which excludes vehicle and parts dealers, and gasoline stations, recorded its first monthly decline in four months, down by 0.6%. Among core sectors, only ‘Building material and garden equipment and supplies dealers’ bucked the trend, registering a 1.3% increase in monthly sales. Year over year, ‘General merchandise retailers’ remained strong, with a 6.8% uptick.
These figures underscore the impact of higher interest rates, which continue to restrain consumer spending. However, preliminary data for April suggests a slight rebound in retail sales, up by 0.7%. While this signals renewed consumer spending, it is unlikely to sway the Bank of Canada’s decision regarding interest rates at their upcoming June meeting.
US Economic news
This past week’s key data points that the Federal Reserve (Fed) considers when deciding whether to raise or lower the interest rate.
Federal Open Market Committee (FOMC) meeting minutes
The minutes from the April 30 – May 1, 2024, FOMC meeting were recently released, shedding light on the committee’s deliberations. At that meeting, FOMC members kept the benchmark interest rate at 5.5%, set in July 2023.
The minutes from the meeting revealed that officials were concerned that stubborn inflation was not falling as fast as expected, despite earlier progress towards their target of 2%. After several higher-than-anticipated labour market reports and inflation data, including the latest ones at the time of the meeting, officials concluded that it would take longer than previously thought for inflation to cool enough to justify reducing their benchmark interest rate, which is currently at a 23-year high. They debated whether their benchmark rate was exerting enough drag on the economy to further bring inflation down to their target. Some members were even willing to raise rates if inflation did not show a clear downward trend. However, they still leaned towards eventual reductions in borrowing costs, but acknowledged that disappointing inflation readings meant those rate cuts could take a while. In other words, higher for longer.
Furthermore, the minutes addressed concerns about the labour market, acknowledging its strength while noting signs of slowing momentum. Discussions focused on the potential impact of wage pressures on inflation and the broader economic recovery.
Overall, the Fed’s stance remains cautious as they continue to closely monitor economic indicators to guide their policy decisions.
American market volatility
The CBOE Volatility Index (VIX), often regarded as the market’s fear gauge, remained relatively unchanged this past week, closing at 11.93, just slightly lower than the previous week’s reading of 11.99. This stability likely resulted from a positive earnings report from Nvidia, signaling optimism in the burgeoning AI sector. However, concerns over potential delays in Fed interest rate cuts tempered this optimism. With the VIX below the 20 threshold, typically associated with market calmness, investors appear less apprehensive in the short term.
Consumer Sentiment Index (CSI)
The University of Michigan’s final reading on consumer sentiment for May came in at 69.1. This is better than the initial reading of 67.4 and analysts’ expectations of 67.6, but it represents a 10.5% decline from April’s 77.2. Despite this drop, the current reading is still 17.1% higher than a year ago and roughly 40% above the all-time low set in June 2022, indicating that consumer sentiment has improved as inflation has fallen.
The May reading is the lowest in five months and marks the first significant decline after three months of relative stability in the upper 70s. This lower reading is attributed to concerns about a softening labour market, heightened expectations of higher inflation, and the ongoing persistence of high interest rates.
How much money should I expect to invest to start?
Before You Start Investing
Before you decide to invest your money, ensure you have done the following:
Paid off high-interest debt: Such as credit cards.
Built an emergency fund: For unexpected situations like sudden illness or injury.
Set aside cash for major expenses: Expected within the next year.
Once you have these situations safely in hand, it is time to think about investing and how much to invest.
How Much to Start With
No One-Size-Fits-All Strategy
Everyone has unique circumstances, goals, income, lifestyle, bills, and time horizons. If you have C$100 to start, that is a fine beginning. You can open a direct trading account and buy some shares.
Transaction Fees: As of May 2024, most direct trading accounts in Canada charge a transaction fee of $10 or less, so you will have around $90 to invest.
Maintenance Fees: If you do not meet the minimum balance requirements of your financial institution, you might incur a maintenance fee. In such cases, consider low-cost platforms like Questrade or Wealthsimple, which charge minimal fees, if any.
A Starting Amount
$3,000 for a Solid Start
In my experience, having around $3,000 is a solid initial amount to place in your direct trading account and be able to start investing immediately. If you have more, that is even better. This amount allows you to:
Purchase shares in two or more proven, stable companies.
Start and form the core of your portfolio.
Benefit from dividends (assuming you choose dividend-paying companies).
Investing in proven dividend payers (such as banks, telecom companies, or utilities) will let you see your money working for you through dividend payments. This can be particularly reassuring if the companies you select experience temporary drops in share price. However, keep in mind that dividends are not guaranteed and should not be the sole reason for choosing a company.
Starting with Less
Even $100 is Enough
If you only have $100, that is still enough to start.
Open a direct trading account through your financial institution to get a free account or consider using a low-cost platform like some of the ones mentioned previously. You can research options to find one that suits your needs.
Identify a company you would be proud to own and believe will perform well over the next five years or more.
If you do not have enough money in your trading account to immediately invest in a company, keep adding money to your trading account on a regular basis until you have saved up enough money. In the meantime, follow one or two companies that you would be proud to own.
Once you have enough money, buy a few shares, and you will become a part-owner of that company. 😊
Building Your Portfolio
My Experience
I began with $3,000 and often recommend this amount to new investors. As you save more money:
Move it into your trading account promptly, or setup automatic transfers, to avoid spending it impulsively.
If you are charged a fee for each transaction, save until you can buy a few shares at once. The less fees you have to pay the more you have to invest. Transaction fees are something to consider, but do not let them be your primary guide as to when to invest. If you see a company you want to invest in, purchase the shares. (I typically wait until I have $2,000 before investing in multiple companies, though I might act with $1,000 or less if a great opportunity arises.)
Diversify Your Holdings
Aim for Diversification
As your cash accumulates, think about other companies you would be proud to own. Do some due diligence to see if they are a good fit for your portfolio. Keep a list of promising companies for future reference, as the companies on your radar will evolve over time.
Aim to diversify your holdings across at least 15 companies to lower your risk.
Each time you have enough cash to buy more shares, consider if the new company is better than those you already own. If it is not, it might be wiser to buy more shares of your proven winners.
Think of it as backing the lead horse during the race, rather than betting on a new contender. 😊
Faster trade settlements
Starting next week, on Monday, Canada will shorten the trade settlement period from two days to one day. Following the US Memorial Day holiday, the US will also move to this new one-day settlement standard, known as ‘T+1’.
These changes will affect trades for stocks, Exchange – Traded Funds (ETFs), fixed income securities and most mutual funds. For us investors, this mean trades will settle in one business day instead of two.
In investing, ‘trade settlement’ refers to the process of transferring securities and cash between buyers and sellers after a trade is executed. It is the last step in the trading process, involving the update of ownership records and ensuring that payments are made accordingly.
Weekly Market Review
Monday: the week got off to a mixed start for the American indexes – the S&P 500 Index (S&P), the Dow Jones Industrial Average (DJIA), and the Nasdaq Composite Index (Nasdaq). The Nasdaq and S&P both ended in the green while the DJIA ended in the red. Investors are becoming more optimistic that the Fed will lower interest rates. Oil prices fell after the death of Iran’s president led to political uncertainty in the region.
In Canada, the Canadian markets were closed for Victoria Day.
In the US, the Nasdaq closed at a record high as investors await AI darling Nvidia’s latest earning on Wednesday. In trading, Technology and Basic Materials (miners and fertilizer manufacturers) posted the biggest gains, while Financials and Consumer Staples had the biggest losses.
Tuesday: all four indexes were up and down during the trading session before ending in positive territory. Investors await Nvidia’s earnings report which many anticipate will spark a bull run in AI associated companies. Oil prices fell as higher for longer interest rates has investors worried about lower demand.
In Canada, the Toronto Stock Exchange Composite Index (TSX) was sluggish after the long weekend, barely making it above the starting point but enough to set a record high. 😊 The TSX rose on higher commodity prices and the latest inflation data that showed inflation had dropped to a three year low of 2.7%. In trading, Basic Materials and Energy rose the most, while Healthcare and Telecommunications Services faired the worst.
In the USA, the S&P and Nasdaq both closed at record highs. Another Fed official has said he want to see more proof that inflation is on a downward trend. In trading, Utilities and Financials advanced the most, while Telecommunications Services and Basic Materials declined the most.
Wednesday: the indexes started flat but fell sharply after minutes from the Fed’s last meeting indicated Fed officials felt it would be longer than previously thought before they would be able to confidently lower interest rates. Oil prices slipped for the third day in a row on concerns of higher for longer interest rates.
In Canada, the TSX fell into negative territory as commodity prices fell and concerns about when the Fed would lower US rates weighed on the Canadian markets. In trading, the Technology and Telecommunications Services sectors advanced the most while Basic Materials and Healthcare dropped the most.
In the US, after a tough day in the markets, Nvidia came to the rescue with better-than-expected earnings report that sent the stock price for Nvidia soaring. In trading, Telecommunications Services and Healthcare were the only sectors to record a daily increase. All the other sectors posted a loss, with Basic Materials and Energy falling the farthest.
Thursday: hopes of a rally as a result of blowout earnings by Nvidia yesterday were offset by investor worries of higher for longer interest rates. Unfortunately, other than a few other AI related stocks, the rest of the markets sat out the rally, causing all four indexes to end the day lower.
In Canada, lower commodity prices and fears the Fed would further push back a rate cut caused the TSX to fall to a 3-week low. In trading in the Canadian sectors, Consumer Staples was the only sector to advance, while Healthcare and Basic Materials tumbled the farthest.
In the US, Nvidia’s share price surge initially pushed both the S&P and Nasdaq to intraday highs. However, both indexes later fell into negative territory following economic news of rising prices for materials used in the production of finished goods. The DJIA had its worst single day in over a year. In trading, all sectors lost ground. Technology and Telecommunications fell the least while Utilities and Consumer Cyclicals fell the farthest.
Friday: all the indexes rebounded from yesterdays decline, ending higher heading into the American Memorial Day long weekend. Oil prices rose on expected higher demand over the long weekend in the US.
In Canada, the TSX rose on the optimism that the BoC will lower rates after inflation came in lower than expected. In trading, Basic Materials and Financials posted the biggest gains, while Telecommunications Services was the only Canadian sector to end lower.
In the US of A, the surge from Nvidia helped boost the Nasdaq to a fifth consecutive week of weekly gains. In trading, the Utilities and Technology sectors led the way, each with gains over 1%, while Healthcare was the only sector not to make it into positive territory.
Weekly Market and Portfolio Review
For the week, the TSX (SPTSX) lost 0.6%, the S&P 500 (SPX) was flat, the DJIA (INDU) fell 2.3% and the Nasdaq (CCMP) climbed 1.4%.
Index
Weekly Streak
TSX:
1 – week losing streak
S&P:
5 – week winning streak
DJIA:
1 – week losing streak
Nasdaq:
5 – week winning streak
This past week was not the best for the major indexes. The TSX and DJIA recorded losses, the S&P was flat, and the Nasdaq was the only index to post a gain, as you can see in the chart above. While the S&P was essentially flat, it did manage a tiny 0.03% gain, so I will count that as an extension of its win streak. 😊
At the start of the week, there was a sense of optimism about the economy. Promising signs that inflation might be starting to fall again led investors to believe that the Fed could lower interest rates later this year. Coupled with a solid earnings season, this optimism drove all four major North American indexes to their respective record high during the week.
In the US, there were no significant new economic or inflation-related events to move the market. Instead, all eyes were on Nvidia’s first-quarter earnings to see if they could meet investors’ lofty expectations. Nvidia not only met those expectations but also raised its guidance for the next quarter. This was great news for Nvidia’s stock and other companies linked to AI, but it did not have much impact on the broader market. As you can see in the chart above, all four indexes fell on Thursday, the day after Nvidia released its earnings. Concerns over rising prices dashed earlier hopes for a late summer rate cut, causing the markets to stumble before recovering at the end of the week as many investors ‘bought the dip.’
In Canada, inflation continued to drop, with core inflation falling for the fourth straight month, now well under 3%, and within the BoC’s target range of 1% – 3%. This data strengthens the case for an interest rate cut in June. Unfortunately, this good news on inflation and interest rates was not enough to push the TSX into positive territory for the week.
Despite the ups and downs this past week, there is a sense of cautious optimism in the air. While the TSX and DJIA faced losses, the Nasdaq’s gain and the S&P’s tiny uptick offer some positive signs. The BoC is likely to lower Canadian interest rates sometime this summer and the Fed still believes a cut to US rates will happen later this year. Corporate earnings were strong which is a good sign for the economy. I am hoping the momentum from the end of the week carries over to next week, propelling the indexes higher into positive territory. 😊
Portfolio
Weekly Streak
Portfolio 1:
5 – week winning streak
Portfolio 2:
1 – week losing streak
Portfolio 3:
1 – week losing streak
This past week saw mixed results across the three portfolios, with Portfolio 1 standing out as the only one to achieve a weekly gain, outperforming the Nasdaq, which was the top-performing index, as shown in the chart below.
Portfolio 1 extended its weekly win streak to five, largely on the strength of Nvidia’s 13% gain. Not only was this a sizable percentage gain, but the high dollar value of Nvidia’s shares made the increase even more impactful. Clestica (TSE: CLS) and Hammond Power Solutions (TSE: HPS.A) also posted significant (more than 10%) gains, each rising 12%. Unfortunatley, Portfolio 1 had several stocks with siginifcant weekly losses, limiting its overall gains. Significant losers included Nano-X Imaging (NASD: NNOX) down 17%, Global-E Online (NASD: GLBE) down 12%, Unity Software (NYSE: U) and GDI Integrated Facility Services (TSX: GDI), both down 10%
Portfolio 2 had the toughest week of the three. Despite Hammond Power Solutions being a major winner, most companies in this portfolio lost ground, dragging down its overall performance.
Portfolio 3 also saw a decline, though not as steep as Portfolio 2. The drop was mainly due to significant losses in Lithium Americas (TSE: LAC), which fell 11%, along with sizable losses by Unity Software and GDI.
Although the gains from Portfolio 1 helped offset the losses in the other two portfolios, I aim for all three to achieve weekly gains. (There is a Captain Obvious statement if there ever was one 😊). Ideally, next week, all three portfolios will end up in the win column, rather than relying on a single portfolio or company to carry the week.
Weekly Portfolio & Index performance for the week ended May 24, 2024.
Companies on the Radar
Last week, I mentioned wanting to trim a company or two from my radar list. I removed MasTec, Inc. (NYSE: MTZ) but came across another promising company, leaving me with six companies again.
The new addition is Quanta Services, Ltd. (NYSE: PWR), a large-cap American company offering a wide range of specialty infrastructure solutions throughout the world. Quanta operates across multiple industries, including electric power, renewable and traditional energy markets, underground utilities, and communications. This diversification provides access to various revenue streams and mitigates risks from market fluctuations in any single sector. The company should benefit from the ongoing upgrades to current energy infrastructures and the construction of new ones as the world shifts towards renewable energy solutions. Investing in Quanta would also enhance the diversification of any portfolio.
As well as Quanta, these five other companies are currently on my radar:
Equitable Bank (TSE: EQB), a mid sized Canadian bank, considered Canada’s 7th bank, that provides financial services to consumers and businesses.
RELX PLC (NYSE: RELX), provides information-based analytics and decision tools for professional and business customers worldwide
Lumine Group (TSE: LMN), a young Canadian mid sized company that acquires communications and media software companies, and then strengthens and grows those companies.
LVMH Moët Hennessy – Louis Vuitton, Société Européenne (OTCM: LVMUY), commonly known as LVMH, is a French multinational conglomerate specializing in luxury goods. It is the world’s largest luxury goods company.
Evolution AB (OTCM: EVVTY), a Swedish company that provides live casino solutions for global gaming operators.
Please keep in mind that these are only companies that have piqued my interest. This is not a recommendation or financial advice. You should do your own research or contact a professional before making any investment decisions.
The Radar Check was last updated May 24, 2024.
Stock on the Radar List. 1 of 2.Stock on the Radar List. 2 of 2.
NOTE: Morningstar and Thomson-Reuters analysis is unavailable for Evolution and LVMH from my usual sources because the company’s home stock exchange is in Europe. While it is possible to invest in both companies through the Over-the-Counter Market (OTCM), I do not have access to analysis similar to the data available for companies traded on the major North American stock exchanges (Toronto Stock Exchange, New York Stock Exchange, and Nasdaq Stock market). The Analysts Rating and Price Target for these two companies are from Yahoo! Finance, under the Analysis tab once you have searched for the ticker.
Portfolio Update
Portfolio 1
Portfolio 1 for the week ended May 24, 2024: UP
Alphabet’s Google announced it will invest another €1 billion to expand its datacentre capabilities in Finland as it builds out its AI capabilities in Europe. The company also plans to build out its AI capabilities in the Netherlands and Belgium.
Amazon announced it has partnered with AI company Hugging Face to make it easier for developers to run their AI models on Amazon’s new chips that were custom built for AI applications.
Walmart (NYSE: WMT) announced they will invest US$ 700 million in Guatemala over the next five years, and are currently investing $600 million in Costa Rica, including building a new distribution centre.
All is not perfect for Nvidia as the company was forced to price its AI chips below those of Chinese chipmaker rival Huawei, leading to a discount of over 10% in some cases. The NVidia chips were specifically made for the Chinese market to comply with US trade restrictions.
Activity
No significant activity to report this week.
Bought:BCE (TSE: BCE) This is my second investment in BCE. The company holds a strong market position as one of Canada’s leading telecommunications providers, has demonstrated financial stability and offers an attractive dividend. My primary motivation for this investment is the 8.6% dividend yield, which ensures a steady income stream. Even if the share price remains stable, the dividends will contribute to the overall growth of my investment. Additionally, many analysts predict that the telecom industry has reached its lowest point and is expected to rebound in the coming years, providing long-term growth potential.
Bought:Atlanta Braves Holdings (NASD: BATRK) I originally inherited BATRK from a restructuring done by Liberty Media, the parent company of BATRK. However, this is my first purchase of BATRK.
The main asset here is the Atlanta Braves baseball team. Major League Baseball’s popularity has been on the rise, and the Braves have been one of the top teams for the past few seasons. All their winning has boosted the team’s profile, leading to more ticket and merchandise sales. Plus, new media deals are expected to bring in more revenue in the coming years. The Braves are also planning a new mixed-use development around the stadium, which could create additional revenue streams. As revenues grow, the value of the team should go up too.
Investing in BATRK has growth potential but comes with risks. If MLB viewership or attendance drops, it could hurt the Braves’ revenue and share price. Also, sports teams rely heavily on their players’ performance. Injuries, free agency moves, and overall team performance can all impact the team’s revenue and valuation. Financially, it is a mixed bag: revenues are up, but net income and earnings are still negative.
Overall, this investment is a bit iffy. I had a few hundred extra dollars in an account, so I bought some shares with the plan to sell them for a small profit at the end of the baseball season. In the meantime, I can say I own a piece of a professional baseball team. 😊
Dividends
Dividends Received this week for the following companies:
Companies followed by DRIP (Dividend Re-Investment Plan) indicate additional shares were purchased with the dividend. Any cash leftover was added to the cash balance.
Guardant Health (NASD: GH) announced that its “Guardant360 CDx blood-based test for comprehensive genomic profiling of solid cancers has received certification under the European Union’s In Vitro Diagnostic Regulation.”
Separately, the US Food and Drug Administration’s (FDA) “strongly recommended” federal regulators approve Guardant’s Shield blood test for colorectal-cancer screening.
The Walt Disney (NYSE: DIS) announced it was reducing the headcount at its Pixar studio by 14%, or 175 employees, as Disney continues to lower its expenses. Disney says Pixar will once again focus on quality over quantity.
MongoDB (NASD: MDB) announced they have received four additional security certifications. This will allow more companies with unique regulatory requirements to use MongoDB’s Atlas product.
Activity
No significant activity to report this week.
Dividends
Dividends Received this week for the following companies:
Companies followed by DRIP (Dividend Re-Investment Plan) indicate additional shares were purchased with the dividend. Any cash leftover was added to the cash balance.
Canadian $
Dream Industrial Real Estate Investment Trust (TSE: DIR.UN) DRIP
US $
No US$ dividends this past week.
Quarterly Reports
No quarterly reports this past week.
Portfolio 3
Portfolio 3 for the week ended May 24, 2024: DOWN
At Microsoft’s developer conference, the company showcased new tools designed to enable developers to integrate AI into their Windows applications more quickly and easily.
Shopify (TSE: SHOP) successfully argued against a jury’s decision that Shopify pay C$ 40 million in damages for infringing on the website building technology of Express Mobile.
Activity
No significant activity to report this week.
Dividends
Dividends Received this week for the following companies:
 Mercedes-Benz Group AG (OTCM: MBGAF)
 Tata Motors Limited (NYSE: TTM): A prominent Indian multinational automotive manufacturing company.
 Other ADRs are easier to spot due to a ‘Y’ or an ‘F’ at the end of a ticker. For instance, China’s BYD Company Limited, a manufacturer of automobiles and rechargeable batteries, trades on the OTCM under the tickers OTCM: BYDDY and OTCM: BYDDF.
 No new companies caught my eye this past week, but I did manage to shorten my watchlist by removing RELX PLC (