With inflation stubbornly high, hopes for lower borrowing costs are fading. After three consecutive months of higher-than-expected inflation, you might be wondering: when will interest rates drop? Despite many anticipating a quicker resolution, the Federal Reserve (Fed) has opted to maintain a steady interest rate of 5.5%, waiting for clear signs that inflation is indeed on a downward trajectory.
Keeping borrowing costs high can be frustrating for many. Prospective homeowners are eagerly awaiting lower mortgage rates, businesses are holding off on investments hoping for cheaper borrowing costs, and investors are on the lookout for any rate cut that could spur market growth. Unfortunately, the quick resolution to high inflation rates predicted at the end of 2023 has not materialized. Why? The impact of higher rates has been uneven. Some consumers and businesses locked in lower rates before they rose in 2022, shielding them from the current highs.
In what feels like a standoff between the public and the Fed, both sides seem to be trying to outwait the other. Consumers and businesses might be hoping to outlast the central banks, delaying major loans in the hope that interest rates will soon drop. However, the Fed is confident that their ‘higher for longer’ strategy will gradually bring inflation down to their target of 2% as more people begin to feel the economic pinch.
As we watch and wait for rates to fall, the big question remains: will this “higher for longer” strategy be effective in cooling inflation? The Fed will be patient, awaiting evidence that inflation continues its downward trend. In the meantime, let’s look into what transpired in the markets this past week….
Items that may only interest or educate me ….
Canadian Economic news, US Economic news, Is it better to invest in Canadian or American stocks? ….
Canadian Economic news
This past week’s key economic data that the Bank of Canada (BoC) considers when deciding whether to raise or lower the interest rate.
Canadian market volatility
Over the past week, Canada’s Volatility Index, the Montreal Exchange Volatility Index (VIXC), measured by the TSX 60, drifted lower, ending at 10.19, down from the previous week’s reading of 12.07. The decrease in volatility is likely due to slowing inflation, strong corporate earnings, easing tensions in the Middle East, and the growing likelihood that the BoC will lower interest rates in June.
Often referred to as Canada’s ‘fear gauge,’ the VIXC provides insights into expected volatility within the Canadian stock markets. Typically, readings above 20 signify high volatility, while those below 20 indicate lower levels. At its current reading of 10.19, the VIXC suggests the market remains well below the threshold for high volatility, indicating a generally calmer sentiment among investors.
US Economic news
This past week’s key data points that the Federal Reserve (Fed) considers when deciding whether to raise or lower the interest rate.
Consumer price Index (CPI)
This week’s economic news focused on inflation, with both the Producer Price Index (PPI) and CPI reports being released. The PPI, which tracks prices businesses pay for goods and services, came in higher than expected, raising concerns among investors about rising consumer prices. However, they need not have worried as the Labor Department’s April CPI report, a gauge for goods and service costs across the US economy, showed inflation rose 0.3%, below analysts’ expectations of a 0.4% increase, and down from March’s 0.4% rise. Annually, the rate of inflation declined slightly to 3.4%, matching expectations, after rising 3.5% in the previous month.
The biggest monthly increase was in the ‘Gasoline’ subsector, up 2.8%, while the biggest drop was in the ‘Utility (piped) gas service,’ subsector, down 2.9%. Year over year, ‘Transportation services’ saw the biggest increase, up 11.2%, while the largest decline was in ‘used cars and trucks,’ down 6.9%.
The core CPI, which excludes volatile food and gas prices, slowed to a 0.3% rate of growth, after posting consecutive increases of 0.4% in February and March. Year over year, core CPI slowed to 3.6%, after a 3.8% rise in March. Both the monthly and year-over-year increases matched expectations.
Both all-items CPI, or headline CPI, and core CPI showed a slight slowdown in the pace of inflation growth. This resumption of the downward trend is welcome news to consumers and the Fed alike. For consumers, this could mean some relief from high prices. For the Fed, falling inflation is what they want to see. However, inflation still remains above 3%, and the Fed will want to see several months of inflation data trending downward before changing interest rates. In the meantime, interest rates will remain at 5.5% to ensure inflation is truly heading down to their 2% target. Analysts and investors are now targeting a rate cut for September, with the possibility of another cut later in the year. The sooner a rate cut, the better. 😊
The PPI is an economic indicator that provides a view of inflation from the perspective of the producer rather than the consumer (which is what the CPI measures). If the PPI goes up, it can indicate that prices are increasing, potentially leading to inflation. On the flip side, if the PPI decreases, it might suggest that producers are getting less for their products, which could signal deflation or a drop in demand.
American market volatility
The CBOE Volatility Index (VIX), often referred to as the market’s fear gauge, declined this past week, ending at 11.99, down from the previous week’s reading of 12.55, marking its lowest level since December. This decrease was likely the result of the latest CPI coming in lower than expected, continued robust corporate earnings, and renewed optimism that the Fed will lower interest rates sometime this year. The VIX is generally considered calm when below 20, suggesting investors are less anxious in the near term. However, future economic data and global events could still cause the VIX to fluctuate.
Retail Sales
The Commerce Department’s retail sales advanced estimates for April showed sales were virtually flat, following a downward revised gain of 0.6% in March. Analysts had forecast gains of 0.4%. On an annual basis, retail sales were up 3.0%.
The biggest monthly increase was in ‘gas station’ sales, up 3.1%, while the biggest decrease was in ‘nonstore retailers,’ down 1.2%. Annually, ‘nonstore retailers’ was the big winner, up 7.5%, while ‘furniture and home furnishings stores’ saw the biggest decline, down 8.4%.
Core retail sales, which excludes automobiles, gasoline, and vehicle parts, shrank 0.1% in April, down considerably from a 1.1% increase in March and below analysts’ expectations for a 0.2% increase. However, year over year, core retail sales were up 3.5%.
The monthly data showing a decline in retail sales, suggesting demand was cooling, combined with the recent lower than expected jobs report, suggest the economy is finally starting to soften. For the Fed, who were looking for signs the economy was slowing before they would consider lowering the interest rate, this provides some of the evidence of a slowing economy that they were looking for.
Is it better to invest in Canadian or American stocks?
As Canadian investors, we have the unique advantage of being able to access both Canadian and American markets, offering a wide array of investment opportunities. The decision to invest domestically or across the border involves various factors, including exchange rates and tax implications. Consulting with a CPA tax expert or a certified financial adviser can provide clarity on the latter.
Sector Considerations:
- Energy and Natural Resources: The Toronto Stock Exchange (TSE) is renowned for these sectors, making it a practical choice for those investments to avoid foreign exchange fees.
- Technology, Healthcare, Consumer Goods: The US markets, such as the New York Stock Exchange (NYSE) and the Nasdaq Stock Market, offer broader selections in these industries. Although there are strong contenders in Canada, the variety and scale in the US are greater.
The table below showcases the top 10 companies by market capitalization in Canada and the US, as of May 2024. It highlights the sectoral strengths of each market, with Canadian companies excelling in Financials and Energy, while US giants dominate in Technology and Communication Services.
| Largest Canadian companies | Sector | |
| 1 | Royal Bank of Canada | Financials |
| 2 | Shopify | Technology |
| 3 | Toronto Dominion Bank | Financials |
| 4 | Canadian Natural Resources Limited | Energy |
| 5 | Enbridge Inc. | Energy |
| 6 | The Bank of Nova Scotia | Financials |
| 7 | Canadian National Railway | Industrials |
| 8 | Brookfield Asset Management | Financials |
| 9 | Manulife Financial Corporation | Financials |
| 10 | BCE Inc. | Communication Services |
| Largest American companies | Sector | |
| 1 | Microsoft Corporation | Technology |
| 2 | Apple Inc. | Technology |
| 3 | Nvidia Corporation | Technology |
| 4 | Alphabet Inc. (Google) | Communication Services |
| 5 | Amazon.com, Inc. | Consumer Cyclical |
| 6 | Berkshire Hathaway Inc. | Financials |
| 7 | Johnson & Johnson | Healthcare |
| 8 | Tesla, Inc. | Consumer Cyclical |
| 9 | Meta Platforms, Inc. (Facebook) | Communication Services |
| 10 | Exxon Mobil | Energy |
Given this distribution, your sector interest should guide where to invest. For technology, the US market is compelling. For financials, especially banks, staying within Canada may be more beneficial unless you are looking at multinational financial services where US companies like Visa (NYSE: V) and Mastercard (NYSE: MA) also play significant roles.
Strategic Considerations:
Many Canadian companies aim to list on US exchanges to gain exposure and credibility. Conversely, it is rare for US companies to seek listings in Canada. However, when a company, such as Shopify (TSE: SHOP / NYSE: SHOP), is listed on both a Canadian exchange and an American exchange it is called cross listed. Companies cross list to gain broader exposure to investors. For Canadians, purchasing shares on the Canadian exchange can be more economical due to savings on exchange rates. Conversely, US investors would likely buy shares on the American exchange, assuming you can even buy shares on the TSE.
Conclusion:
Choosing between Canadian and American stocks is not straightforward, as both markets offer unique advantages. The TSE excels in the energy, resources, and financial sectors, while the US markets, including NYSE and Nasdaq, are noted for their diverse range of companies, particularly in technology, consumer cyclicals, and healthcare. Implementing a strategy that includes diversification across both countries can be beneficial, helping to balance risks and leverage strengths from each country. However, investors must consider factors like currency exchange rates and tax implications, which can influence returns on foreign investments. Ultimately, your investment decisions should align with your personal financial goals, sector preferences, and risk tolerance.
Goldilocks trade
Following the CPI announcement that inflation had resumed a downward trend, I came across a new term: the Goldilocks trade.
In investing, a “Goldilocks trade” refers to a situation in which economic conditions are perceived as being neither too hot nor too cold, but just right, similar to the porridge in the fairy tale “Goldilocks and the Three Bears.”
In financial markets, a Goldilocks trade typically involves an environment where economic indicators suggest that growth is strong enough to support corporate earnings and stock market performance, but not so strong that it triggers concerns about inflation or aggressive monetary policy tightening by a central bank, such as the Fed or the BoC. It is a delicate balance where economic conditions are considered to be in a sweet spot, fostering investor confidence and optimism.
A Goldilocks trade often leads to a scenario where both stocks and bonds perform well simultaneously, as investors feel comfortable taking on riskier assets like equities while also seeking the safety of fixed-income investments. However, achieving and maintaining a Goldilocks scenario can be challenging, as economic conditions can be fleeting due to various factors such as changes in interest rates, geopolitical events, or unexpected shocks to the economy.
Weekly Market Review
Monday: the week got off to a shaky start with the Nasdaq Composite Index (Nasdaq) the only index to advance. The other three indexes – Toronto Stock Exchange Composite Index (TSX), the S&P 500 Index (S&P), and the Dow Jones Industrial Average (DJIA) – all ended lower. With a US inflation report due Wednesday, many investors are in a wait and see mode. If inflation remains high, the chances of a rate cut this summer diminish, while a lower inflation reading puts a rate cut back on the table. Oil prices edged higher on signs of increasing demand out of China and the potential of the current OPEC+ supply cuts being extended.
In Canada, the TSX ended lower as investors took some profits after last week’s run to a record closing high. In trading, Healthcare and Consumer Cyclicals posted the biggest gains of the Canadian sectors, while Basic Materials (miners and fertilizer manufacturers) and Industrials had the steepest declines.
In the US, the DJIA eight-day win streak came to an end, however, the Nasdaq was higher while the S&P ended slightly lower. In trading, Technology and Healthcare advanced the farthest of the American sectors, while Industrials and Financials lost the most.
Tuesday: Another day of mixed results but this time only the TSX ended lower. The April PPI (another measure of inflation) came in slightly higher than expected, raising concerns about tomorrow’s CPI inflation report. However, investors shook off their concerns after the US announced additional tariffs on a variety of Chinese goods. Oil prices were lower on concerns that higher for longer interest rates could reduce demand.
In Canada, the TSX ended just below the line, weighed down by lower oil prices and the PPI inflation news out of the USA. In trading, Basic Materials and Healthcare gained the most while Technology and Energy dropped the most.
In the US, the Nasdaq set a record close after Fed Chair Jerome Powell reassured investors that he does not expect the Fed to raise rates. In trading, the Financials and Technology sectors rose the most while Consumer Staples and Energy were the only sectors to decline.
Wednesday: all four indexes ended higher, driven by US inflation data that came in below expectations, sparking hopes the Fed will lower interest rates later this year. Oil prices rose after the latest data showed a larger than expected draw on US crude oil offset a forecast for weaker global demand.
In Canada, news of lower inflation in the US led to a rally in the Utility sector. Utility stocks tend to have relatively high dividend yields, making them appealing in a low-interest-rate environment. In trading, the Utilities and Technology sectors were the top performers, while Consumer Staples, Healthcare and Industrials were the only sectors to end lower.
In the USA, lower inflation, flat retail sales and investor optimism helped propel the indexes to record highs. In trading, Technology and Utilities advanced the most, swapping positions with their Canadian counterparts. Energy and Consumer Staples were the only sectors to end in the red.
Thursday: it was a volatile day for the indexes that saw the day end with the TSX the only index to end higher. Comments from three separate Fed officials suggesting rates will likely be higher for longer weighed on the markets, knocking the three American indexes out of positive territory and down into negative territory. Strong demand for fuel products in the US led to oil prices climbing higher.
In Canada, the TSX recorded a second straight day of gains on strong corporate earnings. In trading in the Canadian sectors, Consumer Staples and Healthcare rose the most, while Energy and Telecommunications Services dropped the most.
In the US, coming after a day when all three indexes closed at record highs, the DJIA briefly topped 40,000 before pulling back after comments from Fed officials. In trading, Consumer Staples and Telecommunications Services were the only American sectors to advance, while Energy and Consumer Cyclicals fell the farthest.
Friday: the week ended in the reverse of how it started with the Nasdaq ending lower and the other three indexes closing higher. Gains were limited after a Fed official said she was prepared to raise the US interest rate again if inflation did not resume a downward trend. Oil prices inched higher on growing demand out of China and the US, helping oil post a weekly gain for the first time in three weeks.
In Canada, the TSX was lifted by rising oil and commodity prices. In trading on Bay Street, Basic Materials and Energy recorded the biggest gains, while Healthcare, Consumer Staples, and Utilities were the only sectors to fall.
In the USA, the DJIA closed above 40,000 for the first time, reflecting growing investor confidence that the Fed will lower rates later this year. In trading on Wall Street, Basic Materials and Energy were the biggest winners, while Utilities and Technology suffered the biggest losses.
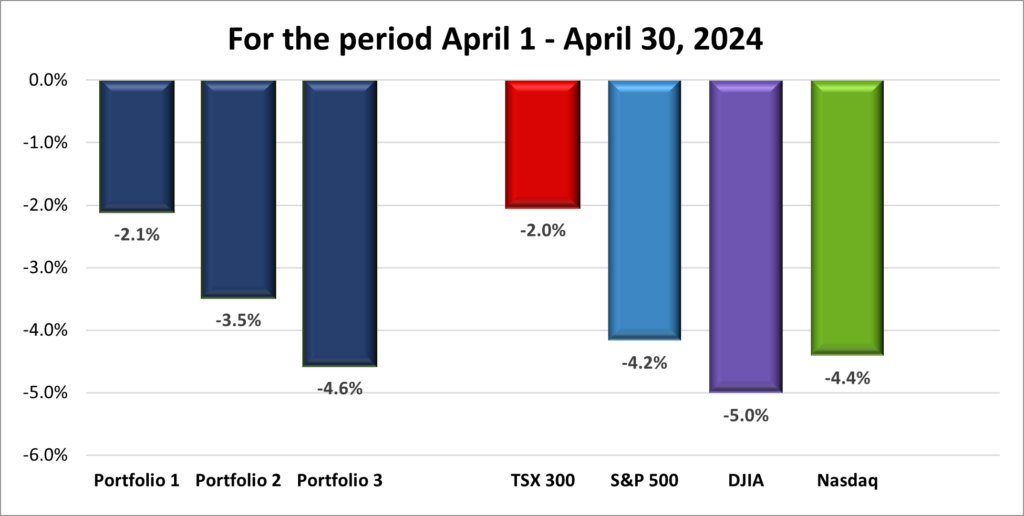
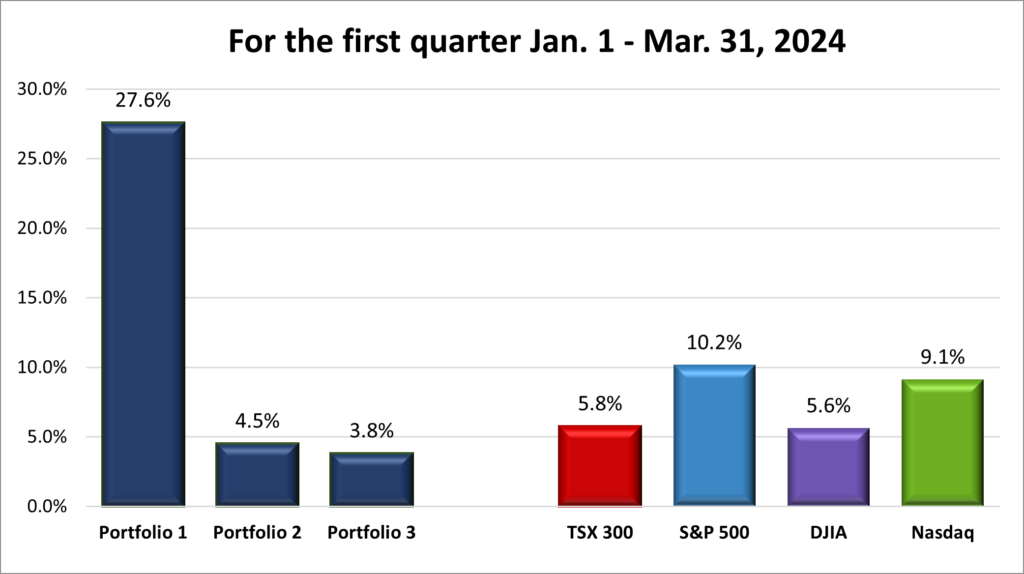
Weekly Market and Portfolio Review
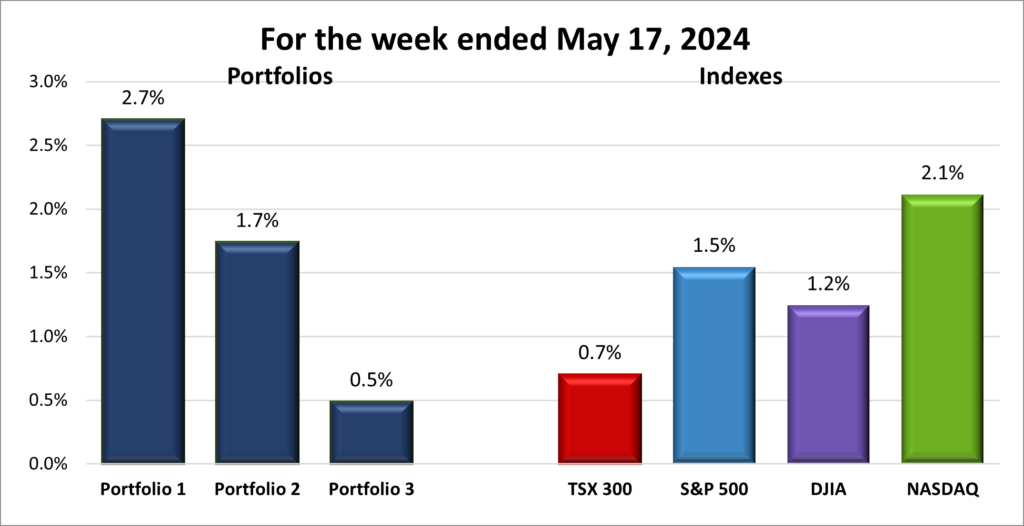
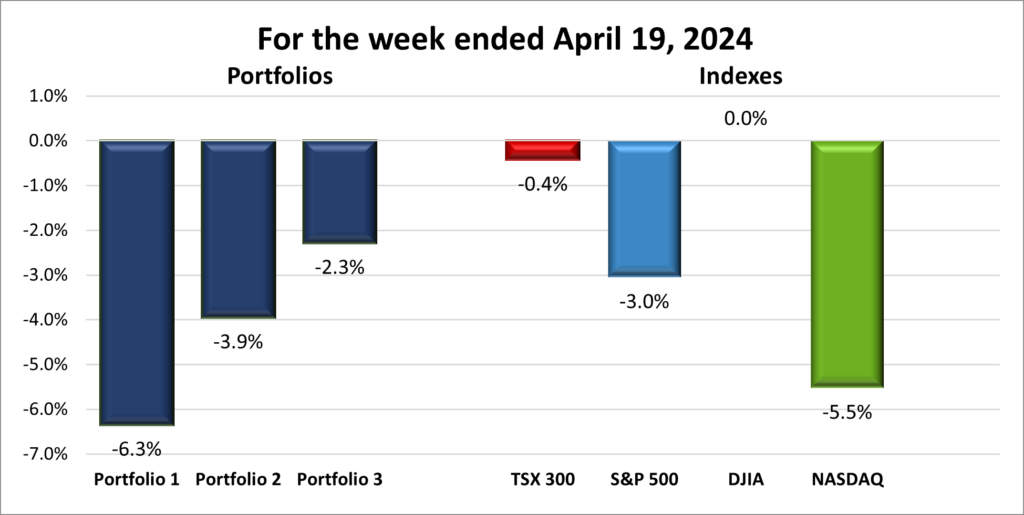
For the week, the TSX (SPTSX) gained 0.7%, the S&P 500 (SPX) rose 1.5%, the DJIA (INDU) advanced 1.2% and the Nasdaq (CCMP) surged 2.1%.
| Index | Weekly Streak |
| TSX: | 2 – week winning streak |
| S&P: | 4 – week winning streak |
| DJIA: | 5 – week winning streak |
| Nasdaq: | 4 – week winning streak |
![]() As shown in the chart above, the major North American stock indexes all enjoyed a positive week, driven by a combination of better-than-expected corporate earnings and the lower than expected US CPI inflation report.
As shown in the chart above, the major North American stock indexes all enjoyed a positive week, driven by a combination of better-than-expected corporate earnings and the lower than expected US CPI inflation report.
The April CPI report, released this past week, showed inflation declining for the first time in six months. While the Fed welcomed this decline, they indicated that it was not enough to start talking about lowering rates just yet. They want more data to ensure the downward trend in inflation continues to ensure it does not rebound like it did earlier this year.
Inflation, as measured by the CPI, rose at its slowest pace since 2021, and retail sales remained flat on a month-to-month basis. Coupled with stronger-than-expected earnings, these factors fueled investor optimism for a soft landing, a scenario where the economy stays strong while inflation returns to the Fed’s 2% target. This optimism propelled all three major American indexes higher. The DJIA even reached a record high, closing above 40,000 points for the first time.
The TSX stumbled at the start of last week due to declining oil and commodity prices. However, as these prices recovered towards the end of the week, the TSX rallied, buoyed by stronger oil and commodity prices, and further bolstered by optimism in the US markets.
Let us cross our fingers that the May CPI inflation shows inflation continuing to fall. 😊
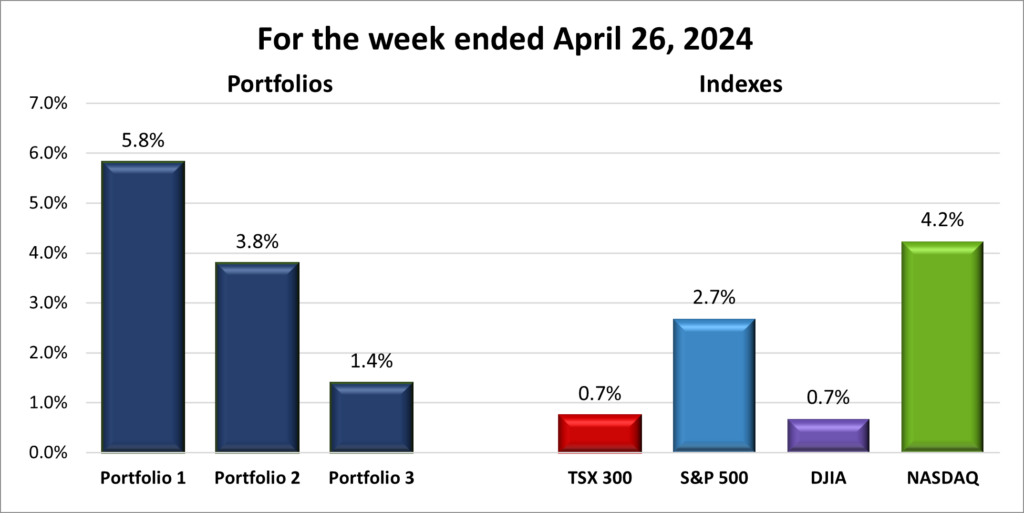
| Portfolio | Weekly Streak |
| Portfolio 1: | 4 – week winning streak |
| Portfolio 2: | 2 – week winning streak |
| Portfolio 3: | 1 – week winning streak |
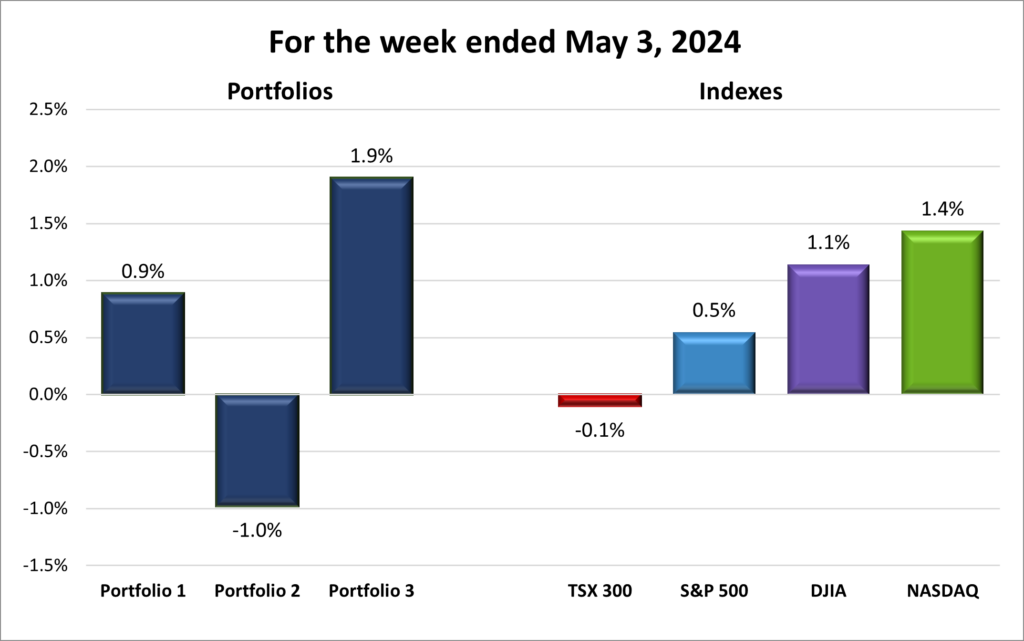
![]() A good week across the board, with all three portfolios registering a weekly gain, as shown in the chart below.
A good week across the board, with all three portfolios registering a weekly gain, as shown in the chart below.
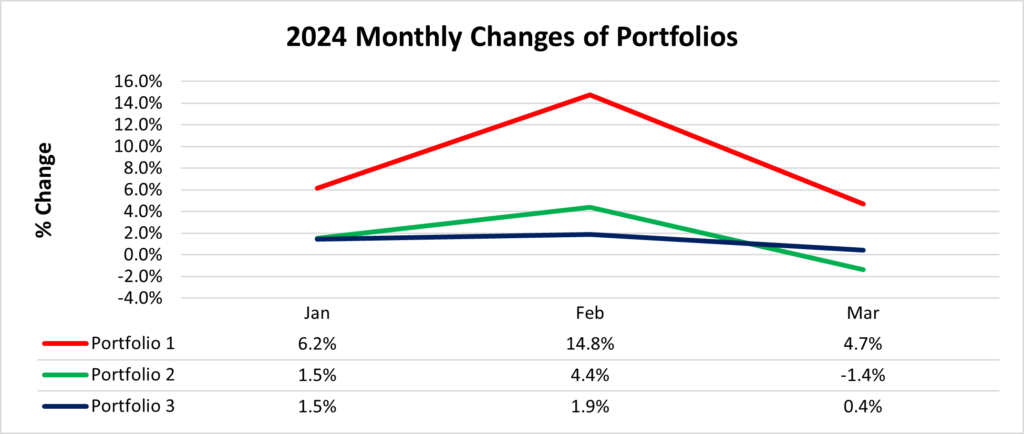
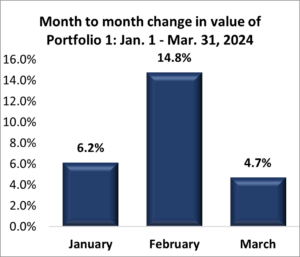
Portfolio 1 led the pack, even outpacing all four major North American indexes. While there were no significant (10% or more) losses, the portfolio benefited from substantial gains in several stocks, including Magnite (NASD: MGNI) up 29%, Sea Limited (NASD: SE) up 15%, Lightspeed Commerce (TSE: LSPD) up 16%, Hammond Power Solutions (TSE: HPS.A) up 11%, indie Semiconductor (NASD: INDI) up 10%, and Celsius Holdings (NASD: CELH) up 10%. The investment in Hammond a few weeks ago during a dip in the share price is looking good. 😊
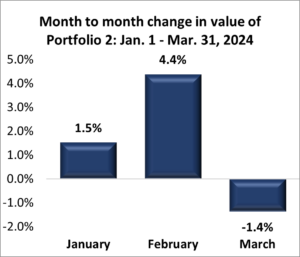
Portfolio 2 performed well, surpassing all indexes except the Nasdaq. The number of stocks that posted a weekly gain, highlighted by Hammond Power Solutions’ 11% gain, slightly out numbered those that declined.
Portfolio 3 was the laggard of the three but managed to get back in the win column. Like Portfolio 2, it was relatively evenly split between winners and losers. If not for Magnite’s impressive 29% gain, this portfolio likely would have lost ground this past week.
Overall, the positive performance across all three portfolios is encouraging. With continued strong earnings next week and potential rate cuts on the horizon, I am optimistic that each portfolio will continue to grow in value, paving the way for long term growth.
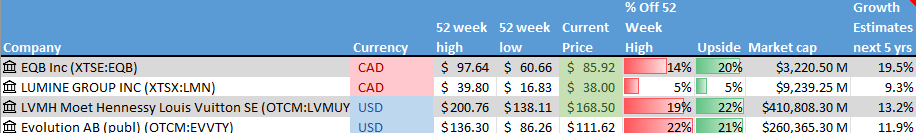
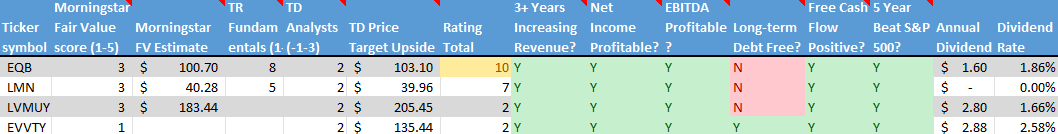
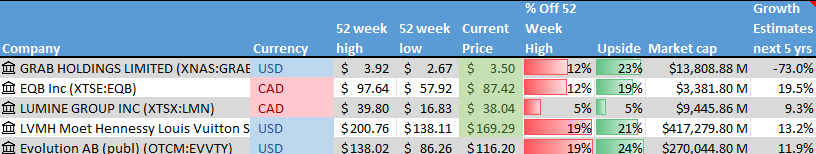
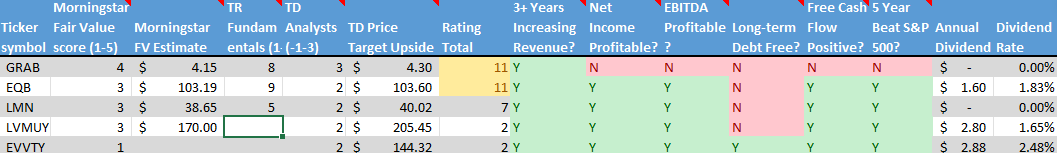
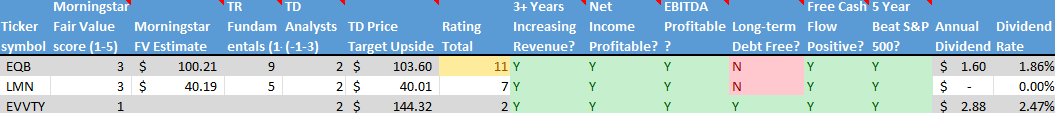
Companies on the Radar
[radar] This past week, I added British company RELX PLC (NYSE: RELX) to my investing radar. This large-cap organization (shares outstanding X share price greater than US$ 10 billion) provides information-based analytics and decision tools for professional and business customers worldwide. RELX is well diversified across various business sectors, which helps lessen risk. The financials are robust, featuring steadily growing revenue and earnings per share (EPS). Additionally, they consistently pay dividends, offering a reliable source of income. Overall, RELX seems to offer a good blend of stability, growth, and innovation, making it a candidate for inclusion in any of the three portfolios.
With RELX now on the radar, that brings the total to six companies on the radar. It is getting a little crowded, so next week I will need to prune a few from the list.
- Equitable Bank (TSE: EQB), a mid sized Canadian bank, considered Canada’s 7th bank, that provides financial services to consumers and businesses.
- MasTec, Inc. (NYSE: MTZ), a mid-sized American engineering firm specializing in the construction of large and complex infrastructure projects.
- Lumine Group (TSE: LMN), a young Canadian mid sized company that acquires communications and media software companies, and then strengthens and grows those companies.
- LVMH Moët Hennessy – Louis Vuitton, Société Européenne (OTCM: LVMUY), commonly known as LVMH, is a French multinational conglomerate specializing in luxury goods. It is the world’s largest luxury goods company.
- Evolution AB (OTCM: EVVTY), a Swedish company that provides live casino solutions for global gaming operators.
Please keep in mind that these are only companies that have piqued my interest. This is not a recommendation or financial advice. You should do your own research or contact a professional before making any investment decisions.
The Radar Check was last updated May 17, 2024.
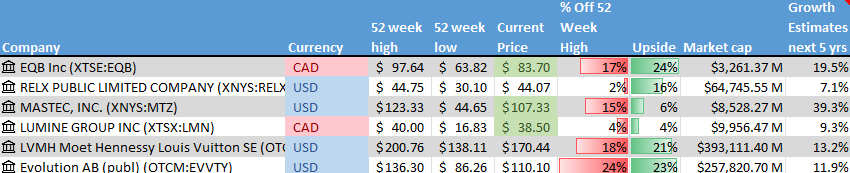
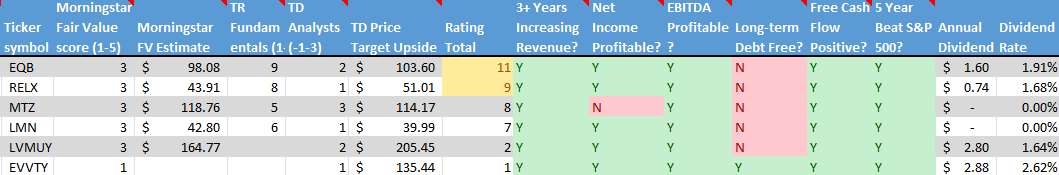
NOTE: Morningstar and Thomson-Reuters analysis is unavailable for Evolution and LVMH from my usual sources because the company’s home stock exchange is in Europe. While it is possible to invest in both companies through the Over-the-Counter Market (OTCM), I do not have access to analysis similar to the data available for companies traded on the major North American stock exchanges (Toronto Stock Exchange, New York Stock Exchange, and Nasdaq Stock market). The Analysts Rating and Price Target for these two companies are from Yahoo! Finance, under the Analysis tab once you have searched for the ticker.
Portfolio Update
Portfolio 1
Portfolio 1 for the week ended May 17, 2024: UP ![]()
- The US National Highway Traffic Safety Administration (NHTSA) is looking into Amazon’s (NASD: AMZN) Zoox self-driving vehicles. The vehicles have been involved in rear end collisions when pulling up behind motorcyclists. As a motorcyclist myself, it appears autonomous vehicles are one more thing I need to be aware while riding. ☹
In other Amazon news, the Amazon Web Services (AWS) plans to invest over €1.2 billion in France to increase their cloud computing and artificial intelligence (AI) infrastructure in that region.
The head of AWS, Adam Selipsky, is leaving Amazon, effective June 3. He will be replaced by senior vice president Matt Garman who has been responsible for AWS’s sales and marketing. - The NHTSA is currently investigating Alphabet’s (NASD: GOOGL) Waymo self-driving car division following reports of Waymo vehicles violating traffic safety laws.
Alphabet’s Google showcased its latest development in AI at Google’s I/O developer event. The latest features include: a version of Gemini known as Flash that is faster and cheaper to run; a prototype that can talk to users about anything captured on their smartphone camera in real time; and an improved Gemini Pro version that allows it to answer questions when provided with thousands of pages of data or an hour or more of video.
The company also said it was launching its ‘fully revamped’ search engine that is enhanced with AI features. Search results will often favour AI generated responses, called ‘AI Overviews,’ rather than website links. This change is supposed to speed up the retrieval of information. - CN Rail (TSE: CNR) halted service on its rail lines in northern Alberta and northern BC due to wildfires.
- Berkshire Hathaway (NYSE: BRK.B) announced they had made a US$ 6.72 billion investment in the insurance company Chubb.
Activity
No significant activity to report this week.
Dividends
Dividends Received this week for the following companies:
Companies followed by DRIP (Dividend Re-Investment Plan) indicate additional shares were purchased with the dividend. Any cash leftover was added to the cash balance.
Canadian $
Dream Industrial Real Estate Investment Trust (TSE: DIR.UN)
US $
Apple Inc (NASD: AAPL)
BSR Real Estate Investment Trust (HOM.UN)
Quarterly Reports
Boston Omaha Corporation
First quarter 2024 financial results on May 14, 2024
The Home Depot, Inc.
First quarter 2025 financial results on May 14, 2024
Sea Limited
First quarter 2024 financial results on May 14, 2024
Grab Holdings Limited
First quarter 2024 financial results on May 15, 2024
Lightspeed Commerce Inc.
Fourth quarter 2024 financial results on May 16, 2024
Walmart Inc.
First quarter 2025 financial results on May 16, 2024
Portfolio 2
Portfolio 2 for the week ended May 17, 2024: UP ![]()
- The Walt Disney Company (NYSE: DIS) announced they have dramatically reduced their investment in traditional TV programming. TV shows that have already been broadcast through traditional TV networks are quickly moved to one of Disney’s streaming services. This allows Disney to spread the costs across multiple platforms and reap additional revenue.
Activity
No significant activity to report this week.
Dividends
Dividends Received this week for the following companies:
Companies followed by DRIP (Dividend Re-Investment Plan) indicate additional shares were purchased with the dividend. Any cash leftover was added to the cash balance.
Canadian $
SmartCentres Real Estate Investment Trust (TSE: SRU.UN)
US $
No US$ dividends this past week.
Quarterly Reports
Take-Two Interactive Software, Inc.
Fourth quarter 2024 financial results on May 16, 2024
Portfolio 3
Portfolio 3 for the week ended May 17, 2024: UP ![]()
- A federal court has ruled Microsoft (NASD: MSFT) must pay a US$ 242 million fine for patent infringement of IPA Technologies’ voice recognition technology that was used in Microsoft’s Cortana virtual-assistant software. Microsoft plans to appeal.
Microsoft has suggested some of its China based employees consider relocating to regions outside of China amidst regional geopolitical tensions.
Microsoft announced they will provide an optional Azure cloud service based on AMD’s (NASD: AMD) top of the line AI chip. At their upcoming developers conference they will preview their own AI chip, the Cobalt 100. Microsoft claims the chip is 40% faster than other Arm (NASD: ARM) based chips. - GDI Integrated Facility Services Inc. (TSE: GDI) acquired Paramount Building Solutions from investment bank Brown Gibbons Lang & Company. Paramount provides facilities maintenance and commercial cleaning solutions to businesses of all sizes. This acquisition will expand GDI’s footprint into Arizona and Minnesota.
Activity
No significant activity to report this week.
Dividends
Dividends Received this week for the following companies:
Companies followed by DRIP (Dividend Re-Investment Plan) indicate additional shares were purchased with the dividend. Any cash leftover was added to the cash balance.
Canadian $
SmartCentres Real Estate Investment Trust (TSE: SRU.UN) DRIP
US $
No US$ dividends this past week.
Quarterly Reports
No quarterly reports this past week.

 This past week, MasTec, Inc. (


 Last year, investors closely monitored the Fed for signs of ending interest rate hikes, triggering a robust market rally, especially in technology stocks. This year, the focus remains on the Fed, albeit with a twist – investors are now anticipating potential rate cuts. While this rally is broader, spanning across more sectors, inflation remains a concern, hovering around 3%.