
Weekly Update for the week ending November 10, 2023

Items that may only interest or educate me ….

Canadian Economic news, US Economic news …

But first….

Remembrance Day 2023

…. Thank you!


It is earnings report season again, this time for the third quarter. The number of companies reporting in the three portfolios has been increasing steadily, reaching 35 this week. I admit it can cause one’s eyes to glaze over, however, these reports are crucial to understanding how the companies you own are faring.

With all the reports this past week, fortunately, there were no key economic reports in Canada or the US this past week. Otherwise, this Weekly Update would have gone on forever, writing it certainly seemed like it did. Sigh! 😊

Canadian Economic news

This past week there were no key economic reports that the Bank of Canada (BoC) considers when deciding whether to raise or lower the interest rate.

Bank of Canada monetary policy notes

The Bank of Canada’s governing council released the Summary of Governing Council deliberations (yes, that is what the minutes are called) from their October 25 monetary policy meeting, where they set the benchmark interest rate.

In the meeting, the BoC’s governing council discussed the key factors that influenced their decisions about interest rates. They acknowledged the challenge of combating inflation, which currently stands at 3.8%. Core inflation, excluding volatile gas and food prices, remains high at around 4%. Both are well above the target rate of 2%. The bank mentioned rising oil prices and increased government spending as factors that contributed to upward pressure on inflation. They also noted the role their higher interest rates have played in driving housing costs up.

They discussed both the global and domestic economic situation. On the global stage, many economies showed signs of slowing down, with inflation falling in most economies. The US economy remained robust, while China experienced slower growth than expected. Domestically, Canada’s economic growth slowed to 1%, indicating the desired impact of the increased interest rates. Consumer spending was reduced due to higher interest rates. Job creation dipped below the growth rate of the labor force, leading to a slight easing in labour shortages. However, wages continued to grow at an annual rate of 4% – 5%.

In terms of policy decisions, the council members expressed concerns about core inflation remaining between 3% – 4%, which could be a sign that inflation is becoming more entrenched. Although a few members of the six-person council felt another hike would be necessary, they reached a consensus to be ‘patient’ and leave the rate unchanged at 5%, a 22 year high. They anticipate leaving the rate higher for longer will lead to a gradual decline in inflation, reaching the 2% target in 2025.

Their next and final meeting of the year is scheduled for December 6, 2023. Until then, the BoC emphasized it will continue to closely monitor the impact of its policy decisions on the Canadian economy and financial system.

Bank of Canada comments

Following the publication of the ‘Summary of Governing Council deliberations,’ Senior Deputy Governor Carolyn Rogers of the BoC issued a cautionary note. She suggested that the era of extremely low-interest rates is likely coming to an end. Throughout the pandemic, the BoC kept the benchmark rate within the lower range of their 1% – 3% target, specifically at 0.25% – 1.75%. Rogers advised consumers and businesses to “proactively adjust to a future where interest rates may be higher than they’ve been over the past 15 years.” In simpler terms, once inflation reaches 2%, it is unlikely that interest rates will return to the levels seen during the pandemic.

Canadian market volatility

The Canadian Volatility Index (VIXC), represented by the TSX 60 VIXI, ended the week at 15.03, up from last week’s reading of 14.14. While there was a perceived increase in market volatility in the Canadian stock markets, the VIXC remains comfortably below 20. In the context of the VIXC, a reading above 20 is considered high, while below 20 is deemed low. The current reading of 15.03 suggests that investors maintained a predominantly bullish outlook on the Canadian stock markets, despite perceived increase volatility.

US Economic news

This past week there were no key economic reports that the Federal Reserve (Fed) considers when deciding whether to raise or lower the interest rate.

Consumer Sentiment Index

The preliminary reading on consumer sentiment from the University of Michigan for November came in at 60.4. This is a significant drop from October’s 63.8 and falls below analysts’ expectations of a 63.7 reading. On a monthly basis, the Consumer Sentiment Index (CSI) declined by 5.3%, but on an annual basis, it is still up 6.5%.

This marks the lowest reading since May and the fourth consecutive month of decline, indicating an ongoing dip in consumer confidence and optimism about their economic outlook. The primary concerns voiced by consumers were concerns about higher interest rates and geopolitical tensions, particularly the conflicts in Ukraine and the Middle East.

The CSI is a key metric used to assess how consumers perceive the current economic situation and their expectations for the future.

American market volatility

During the week, the CBOE Volatility Index (VIX) dropped to 14.17, down slightly from 14.91 the previous week. This indicates that investors maintain a bullish outlook on the stock markets, despite this week’s hawkish remarks from various Fed officials. The marginal decline in VIX suggests they are relatively unconcerned about volatility in the American stock markets.


Last week’s rally was sparked by hopes the Fed was finished with rates hikes and could switch to interest rate reductions sooner rather than later. Did it carryover into this week. Let’s see what happened ….

Weekly Market Review

Monday: there was no solid direction one way or the other today. Canada’s Toronto Stock Exchange Composite Index (TSX) ended in the red, while the three American indexes – the S&P 500 Index (S&P), the Dow Jones Industrial Average (DJIA), and the Nasdaq Composite Index (Nasdaq) – bounced back and forth before ending slightly higher. Oil prices rose after Saudi Arabia and Russia confirmed they will continue with their production cuts, reducing global oil supplies.

In Canada, the TSX’s winning streak came to an end as commodity prices fell. In trading in the Canadian sectors, the Consumer twins, Staples and Cyclicals, were the only sectors to advance. Basic Materials (miners and fertilizer manufacturers) and Technology sectors suffered the largest losses.

In the US, investors await speeches from various Fed officials throughout the week to get clues what the Fed will do at their next session in December. In trading in the American sectors, Healthcare and Technology posted the biggest gains, while Energy and Financials dropped the most.

Tuesday: a mixed bag for the indexes as the TSX began a losing streak, while the three American indexes each extended their winning streaks. Signs of a weaker US economy caused investors to believe the Fed was finished with rate hikes. Today, various Fed officials said not so fast. They felt the economy was still running stronger than expected and another interest rate may be necessary to bring inflation down. Oil prices faltered on the possibility of another rate hike and signs of lower demand for oil coming from China.

In Canada, after last week’s rally on the TSX, the index has now fallen for the second straight day. Lower commodity prices sparked a drop in energy and other commodities companies. In trading, the Technology sector was the only Canadian sector to advance, while Energy and Basic Materials posted the biggest losses.

In the US, spurred on by falling yields on government bonds and gains by the big technology companies, the S&P and DJIA stretched their winning streaks to seven, while the Nasdaq posted its eight consecutive day in the green. It was the longest streak in two years for both the S&P and the Nasdaq. In trading, the biggest gains in the American sectors were Technology and Consumer Cyclicals, while Energy and Basic Materials suffered the heaviest losses.

Wednesday: a mixed day for the indexes with the more value oriented TSX and DJIA declining. The growth-oriented Nasdaq and S&P climbed out of negative territory in afternoon trading to end slightly higher. Much of the recent upward momentum has stalled after Fed officials cooled investor optimism with warnings another rate hike was not off the table.

In Canada, lower commodity prices continued to weigh on the TSX, sending it to a third day of losses. In trading in the Canadian sectors, Technology and Industrials posted the biggest gains, while Basic Materials and Energy suffered the largest losses.

In the US, the American markets were essentially flat, however, the Nasdaq was able to stretch its winning streak to nine and the S&P ran its winning streak to eight. In trading, the Technology and Industrials sectors were the only ones to end higher. Energy and Utilities had the biggest decline.

Thursday: another mixed day in the markets with Canada’s TSX ending higher while all three American indexes ended lower. The Nasdaq and S&P both saw their longest winning streaks in two years come to an end. Oil prices rebounded after a sell off earlier this week caused by concerns higher for longer interest rates would lead to lower demand.

In Canada, the TSX finally broke out of its losing streak on the strength of a rebound in oil and commodity prices, propelling the resource heavy index into the green. In trading, the Basic Materials and Telecommunications Services sector had the biggest increases while the Technology and Healthcare sectors had the largest losses.

In the USA, the American indexes were dragged down by hawkish comments from Fed Chair Jerome Powell who said the Fed “are not confident” interest rates are high enough to push inflation down to their desired 2% target. Yields on government bonds rose, adding additional downward pressure on stocks. In trading, the Energy sector was the only one of the American sectors to post a gain. Healthcare and Consumer Cyclicals posted the largest losses.

Friday: despite hawkish comments from various Fed officials, all four indexes ended the day in the green. Investors were feeling confident that interest rates will remain unchanged for the rest of the year and moved back into the markets, particularly the higher growth sectors like Technology. Oil prices rose after Iraq supported production cuts by OPEC+ members. As prices rose, investors who had shorted oil company stocks earlier this week started to cover their positions, pushing share prices even higher.

In Canada, rising oil prices provided a boost to energy stocks in the TSX. In trading, Technology and Energy were the big winners on the day, while Basic Materials and Utilities suffered the biggest losses.

In the USA, the Nasdaq had its best day since late May and all three American indexes are at their highest level since mid September. In trading on Wall Street, every sector ended in positive territory, led by the growth-oriented Technology and Consumer Cyclicals sectors. The defensive sectors Consumer Staples and Utilities trailed the pack but still posted gains.


Weekly Market and Portfolio Review

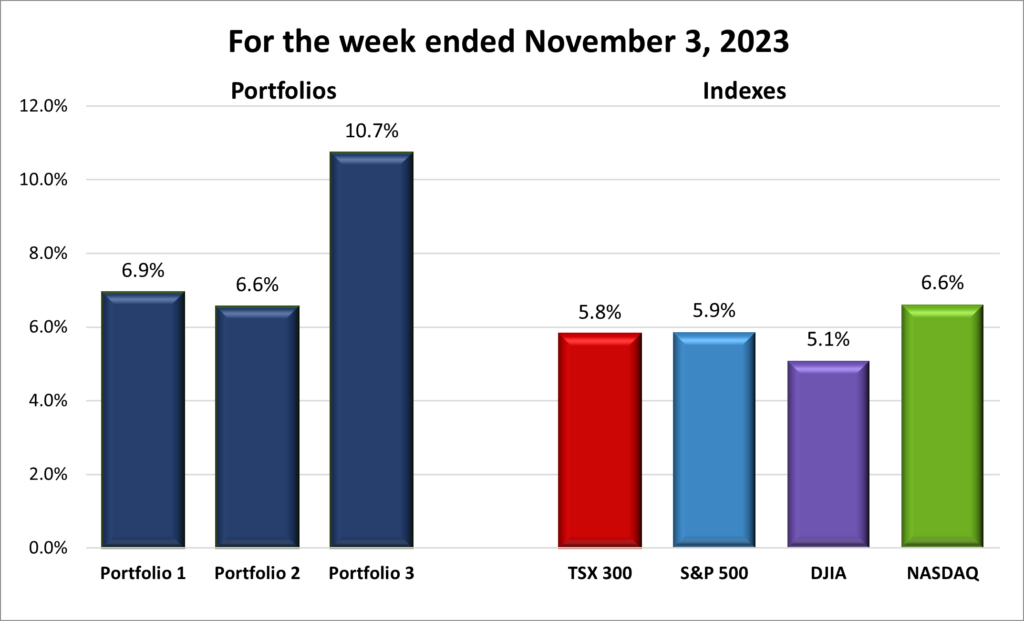
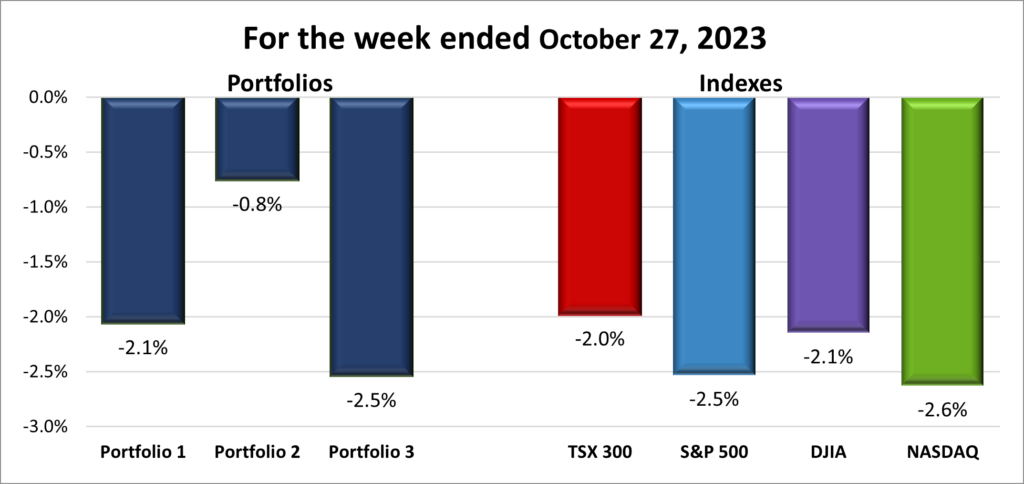
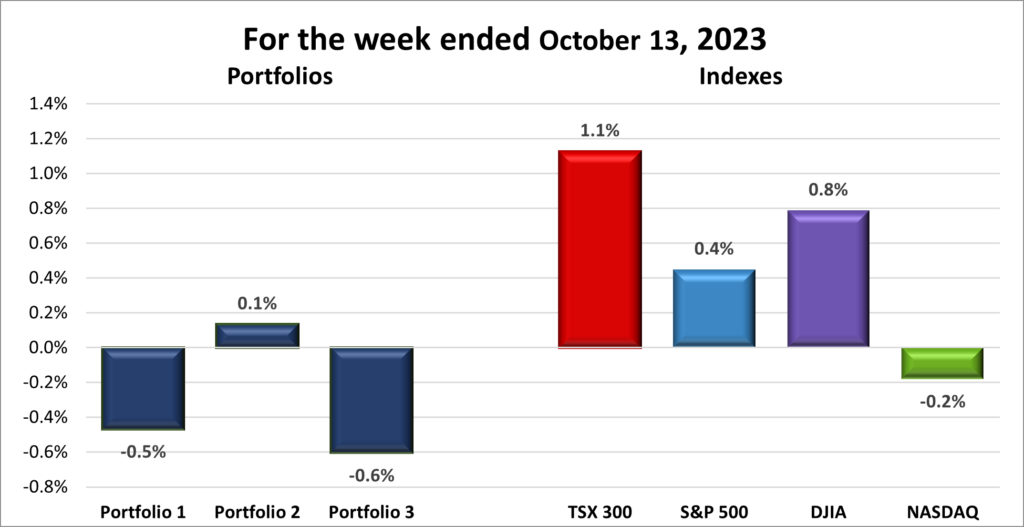
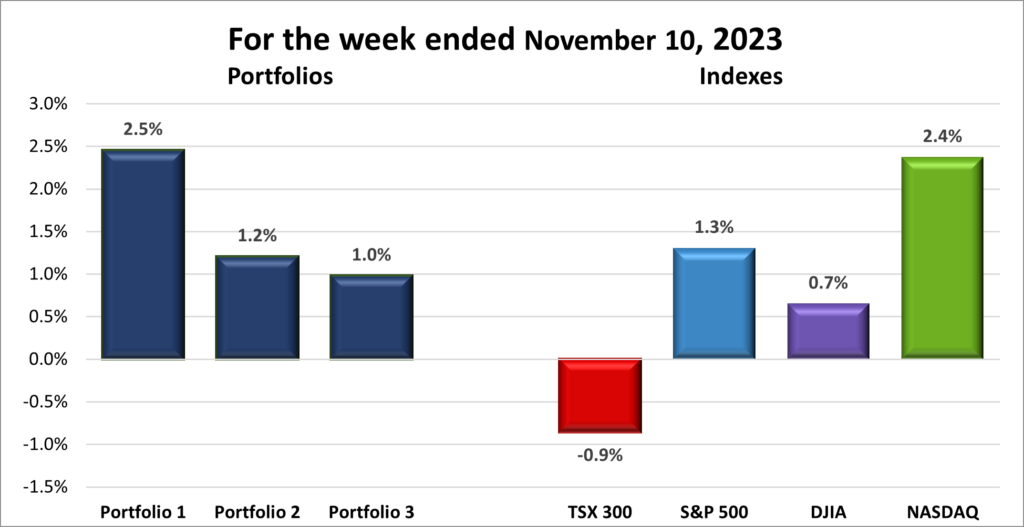
For the week, the TSX (SPTSX) slipped 0.9%, the S&P 500 (SPX) advanced 1.3%, the DJIA (INDU) gained 0.7% and the Nasdaq (CCMP) jumped 2.4%.

Bull market. A good week for the North American stock markets. Overall, another good week for the indexes with three of four posting gains for the week, as you can see in the chart above. November got off to a fast start last week thanks to the Fed leaving the US interest rate unchanged. Upward momentum slowed this week after various Fed officials said another interest hike may be necessary given the ongoing strength of the US labour market. However, investors shrugged this off and believe there will not be another rate hike in 2023, keeping the American indexes moving upward and posting their second consecutive week of weekly gains thanks to a surge in the mega cap technology companies.

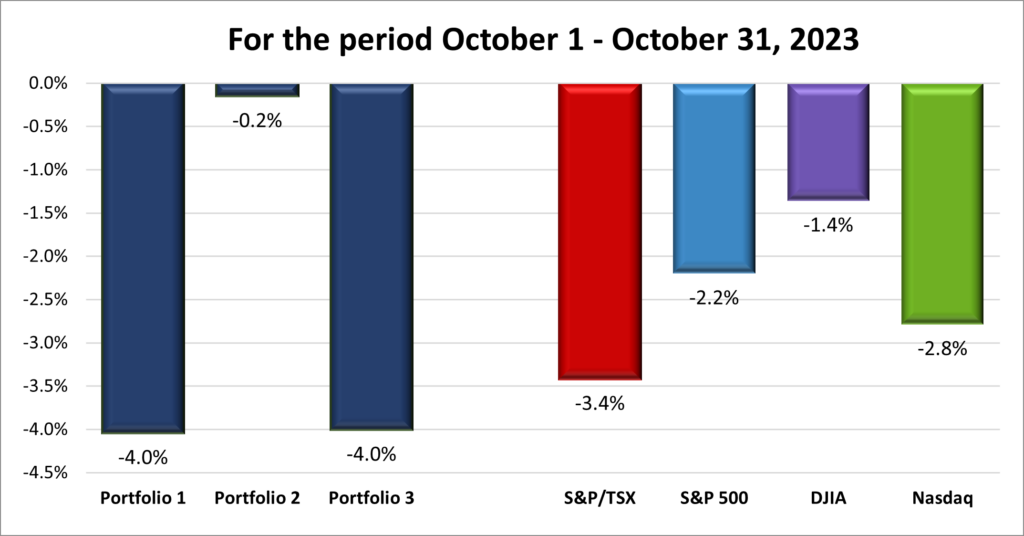
As for the TSX, after posting a six-week high last Friday, it went on a three-day losing streak on fears of lower demand for oil and commodities, due to the ongoing slowdown in the global economy. However, the TSX rallied at the end of the week, recouping some of its earlier losses.
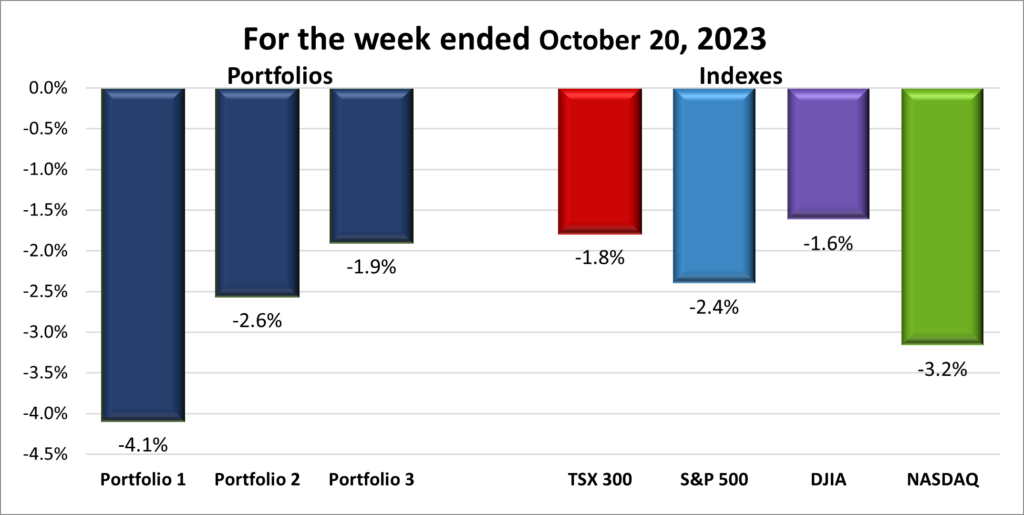
Bull market. A good week for the North American stock markets. The portfolios had another solid week, with all three gaining in value. Portfolio 1 got a sizable boost from its mega cap technology companies as well as notable strong performances from Docebo (TSE: DCBO), Datadog (NASD: DDOG) and Nuvei (TSE: NVEI). On the downside, the Trade Desk (NASD: TTD) dropped 20% after it issued disappointing guidance for the fourth quarter.

In Portfolio 2, it seemed for every stock that had a good week there was an offsetting stock that had a poor week. Solid gains from Take-Two Interactive (NASD: TTWO), MongoDB (NASD: MDB), Disney (NYSE: DIS), and Alimentation Touche Card (TSE: ATD) were offset by drops in Guardant Health (NASD: GH) and the oil companies. Fortunately, the strong performances overcame the poor performances.

Portfolio 3 benefitted from strong performances from Microsoft, which reached an all time high, and Adyen (OTCM: ADYEY) which gained 30% after the company said it would slow hiring and lowered its forecast for net sales growth over the next year. However, poor performances from GDI Integrated Services (TSE: GDI) and the Brookfield family of companies in the portfolio limited the gains.

Next week is highlighted by the American Consumer Price Index report for October. A higher-than-expected inflation reading could stop this rally in its tracks and send stocks lower, while a lower number could see the return of the bulls. I have my fingers crossed for the later. 😊

Weekly Portfolio & Index performance
Weekly Portfolio & Index performance for the week ended November 10, 2023.

Companies on the Radar

Stocks on my Radar 
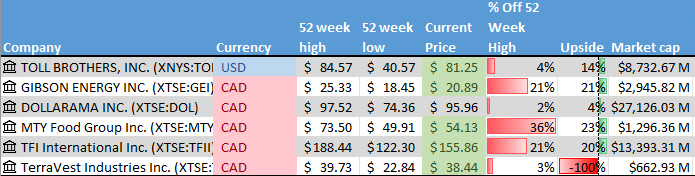
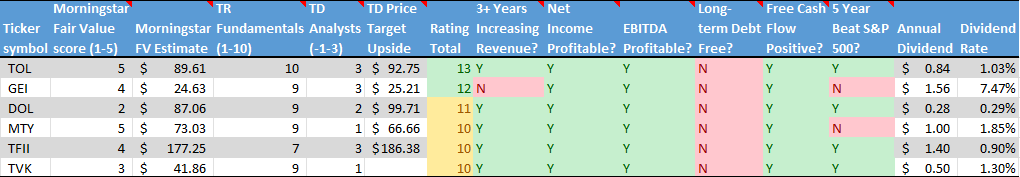
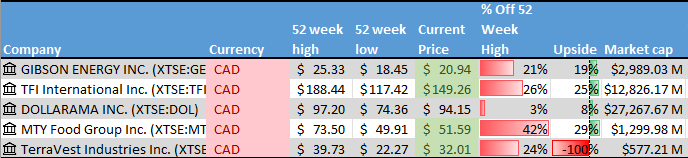
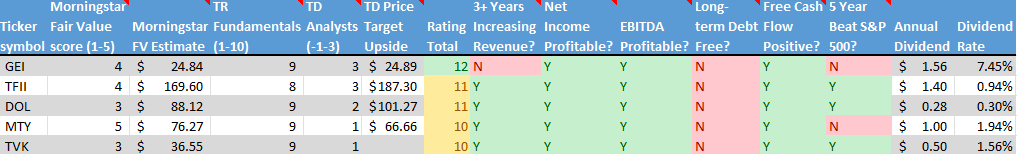
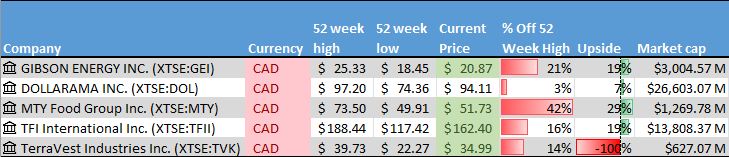
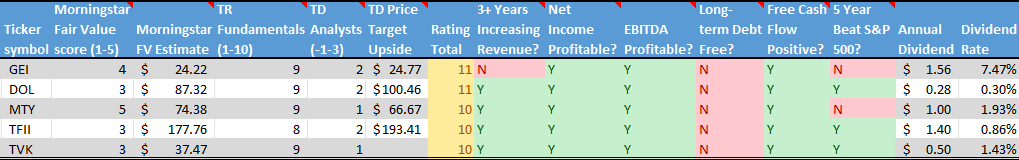
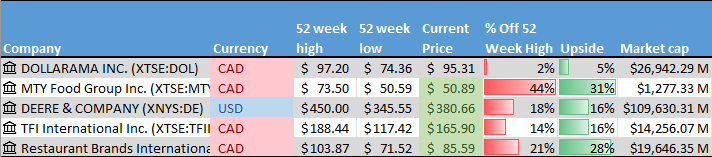
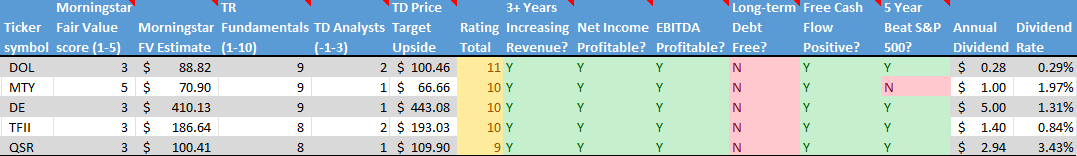
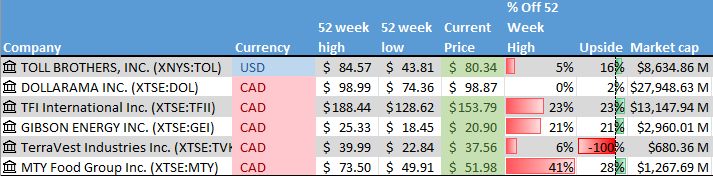
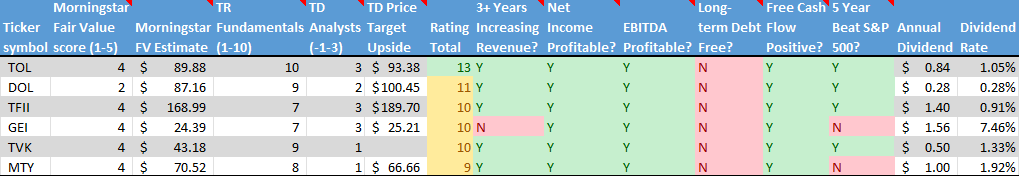
It has been such a busy week with quarterly earnings that I have not had a chance to perform any due diligence on the companies currently on my radar, let alone come across any additions. For another week these six companies remain on my radar list:

  • Toll Brothers Inc. (NYSE: TOL), a mid cap American company that builds luxury homes throughout the US.
  • Dollarama (TSE: DOL), a large Canadian company that operates dollar stores across Canada.
  • TFI International Inc. (TSE: TFII), a mid-sized Canadian transportation and logistics company operating throughout North America.
  • Gibson Energy (TSE: GEI), a small-cap Canadian company specializing in providing liquid infrastructure products and services to the North American energy sector.
  • TerraVest Industries (TSE: TVK), a small-cap Canadian company that manufactures and sells goods and services to energy, agriculture, mining, and transportation sectors across North America. NOTE: because TerraVest has a market capitalization in the range of $300 million to $3 billion), it is not followed by any analysts. Therefore, there is no twelve-month price target for this company’s share price.
  • MTY Food Group Inc. (TSE: MTY), a small cap Canadian consumer cyclical company that operates and franchises quick service and casual dining restaurants throughout North America and internationally.

The Radar Check was last updated November 10, 2023.

Stock on the Radar List. 1 of 2.

Stock on the Radar List. 2 of 2.


Portfolio Update

Portfolio 1

Portfolio 1 for the week ended November 10, 2023: UP Green Up Arrow, signifying a positive week

  • Berkshire Hathaway (NYSE: BRK.B) reported a 40% increase in operating profits to US$10.8 billion, while growing cash to US $157 billion in the third quarter. During that time, the company sold more than US$5 billion worth of stocks. And where did Warren Buffet, one of the world’s top investors, put all that money? US Treasury bills yielding 5% or more. A 5% return on a few billion dollars is a lot of money. Best of all, its almost risk free.
  • Tesla (NASD: TSLA) plans to build a 25,000 euro (~ C$ 36,700 or ~US$ 26,800) electric vehicle (EV) at their Berlin factory. No date has been set for the start of production.
  • The US Consumer Financial Protection Bureau (CFPB) is proposing they start regulating digital payments and smartphone wallet services provided by technology companies. The CFPB says the new breed of financial services providers rival traditional payment methods in both scale and scope but do not come with any consumer safeguards. Among the companies impacted are Apple (NASD: AAPL), Alphabet (NASD: GOOGL) and PayPal (NASD: PYPL).
  • General Motors’ (NYSE: GM) self driving unit Cruise is recalling 950 driverless cars after one of its driverless taxis dragged a pedestrian after being involved in an accident. The current software may cause the car to pull over after being in an accident rather than remaining at a standstill.
    In other GM news, United Auto Workers (UAW) members at GM’s Flint, Michigan factory narrowly voted against GM’s proposed deal, raising doubts on the approval of the contract.
  • Amazon (NASD: AMZN) continue to lower its headcount. This time their Music division is the latest unit to scale back its workforce as the company continues to lower expenses.
  • In response to the US government’s ban on the sale to China of advanced semiconductors used for artificial intelligence applications, Nvidia (NASD: NVDA) announced the production of three new chips for the Chinese market. The chips would have much of the latest features of their high-end chips but have had some of their computing power limited to comply with US export rules.

Activity

Sold Marqeta, Inc. (NASD: MQ) I invested in Marqeta back in November 2021, when the markets had reached their peak before the downdraft of 2022 was even on the horizon. At the time, almost every company saw its share price rise. My reason for investing in the company was “Companies will continue to move to ‘modern cards’ to replace traditional debit and credit cards.”

When the market was rising, and every company had access to cheap money it sounded like a good idea that companies would move to the ‘new’ type of debit and credit card. Now that money is no longer cheap, I do not think many companies will be spending their cash on items that are not core to their business. A new type of card is not critical to many companies when they can do fine accepting payments from existing credit and debit card companies like Visa (NYSE: V).

I thought the share price was reasonable at the time, but it has lost over 70% since I invested and has stayed at its current level for most of 2023. I finally decided to cut my losses and look for other opportunities. ☹

My takeaway, from this investment is smaller, niche companies like Marqeta may have a good idea, but when economic times are tough, many potential customers are reluctant to spend money on items not essential to their business.

Dividends

Dividends Received this week for the following companies:

Companies followed by DRIP (Dividend Re-Investment Plan) indicate additional shares were purchased with the dividend. Any cash leftover was added to the cash balance.

Canadian $

Bank of Nova Scotia (TSE: BNS) DRIP

US $

No US$ dividends this past week.

Quarterly Reports

Formula One Group

All currency listed in millions of US dollars, except for per share data.

Selected highlights from their third quarter 2023 financial results on November 3, 2023

  • Revenue of $887 for the three months ended September 30, compared to $715 for the same period in 2022. An increase of almost 44%.
  • Net income of $118 for the three months ended September 30, compared to net income of $108 in the same period in 2022.
  • Diluted earnings per ordinary share of $0.39 for the three months ended September 30, compared to earnings of $0.31 per share for the same period in 2022.


  • Revenue of $1,992 for the nine months ended September 30, compared to $1,819 for the same period in 2022. An increase of over 24%.
  • Net earnings of $125 for the nine months ended September 30, compared to net earnings of $184 in the same period in 2022.
  • Diluted earnings per ordinary share of $0.37 for the nine months ended September 30, compared to earnings of $0.60 per share for the same period in 2022.

Berkshire Hathaway Inc.

All currency listed in millions of US dollars, except for per share data.

Selected highlights from their third quarter 2023 financial results on November 4, 2023

  • Revenue of $93,210 for the three months ended September 30, compared to $76,904 for the same period in 2022. An increase of over 22%.
  • Net loss of $12,567 for the three months ended September 30, compared to a net loss of $2,698 in the same period in 2022.
  • Diluted loss per ordinary share of $5.88 for the three months ended September 30, compared to a loss of $1.27 per share for the same period in 2022.


  • Revenue of $271,106 for the nine months ended September 30, compared to $223,948 for the same period in 2022. An increase of over 21%.
  • Net earnings of $59,389 for the nine months ended September 30, compared to net earnings of $40,235 in the same period in 2022.
  • Diluted earnings per ordinary share of $26.95 for the nine months ended September 30, compared to a loss of $18.51 per share for the same period in 2022.

Celsius Holdings, Inc.

All currency listed in thousands of US dollars, except for per share data.

Selected highlights from their third quarter 2023 financial results on November 7, 2023

  • Revenue of $384,757 for the three months ended September 30, compared to $188,233 for the same period in 2022. An increase of over 104%.
  • Net income of $83,949 for the three months ended September 30, compared to a net loss of $181,896 in the same period in 2022.
  • Diluted earnings per ordinary share of $0.89 for the three months ended September 30, compared to a loss of $2.46 per share for the same period in 2022.


  • Revenue of $970,579 for the nine months ended September 30, compared to $475,640 for the same period in 2022. An increase of over 104%.
  • Net earnings of $176,685 for the nine months ended September 30, compared to a net loss of $175,468 in the same period in 2022.
  • Diluted earnings per ordinary share of $1.81 for the nine months ended September 30, compared to a loss of $2.26 per share for the same period in 2022.

Cargojet Inc.

All currency listed in millions of Canadian dollars, except for per share data.

Selected highlights from their third quarter 2023 financial results on November 7, 2023

  • Revenue of $214.0 for the three months ended September 30, compared to $232.7 for the same period in 2022. A decrease of over 8%.
  • Net income of $10.5 for the three months ended September 30, compared to net income of $83.4 in the same period in 2022.
  • Diluted earnings per ordinary share of $0.61 for the three months ended September 30, compared to earnings of $4.33 per share for the same period in 2022.


  • Revenue of $655.6 for the nine months ended September 30, compared to $712.9 for the same period in 2022. A decrease of over 8%.
  • Net earnings of $72.2 for the nine months ended September 30, compared to net earnings of $187.8 in the same period in 2022.
  • Diluted earnings per ordinary share of $3.99 for the nine months ended September 30, compared to earnings of $9.82 per share for the same period in 2022.

Datadog, Inc.

All currency listed in thousands of US dollars, except for per share data.

Selected highlights from their third quarter 2023 financial results on November 7, 2023

  • Revenue of 547,536 for the three months ended September 30, compared to $436,533 for the same period in 2022. An increase of over 25%.
  • Net income of $22,630 for the three months ended September 30, compared to a net loss of $25,985 in the same period in 2022.
  • Diluted earnings per ordinary share of $0.06 for the three months ended September 30, compared to a loss of $0.08 per share for the same period in 2022.


  • Revenue of $1,538,710 for the nine months ended September 30, compared to $1,205,701 for the same period in 2022. An increase of almost 28%.
  • Net loss of $5,425 for the nine months ended September 30, compared to a net loss of $21,126 in the same period in 2022.
  • Diluted loss per ordinary share of $0.02 for the nine months ended September 30, compared to a loss of $0.07 per share for the same period in 2022.

Progeny, Inc.

All currency listed in thousands of US dollars, except for per share data.

Selected highlights from their third quarter 2023 financial results on November 7, 2023

  • Revenue of $280,891 for the three months ended September 30, compared to $205,371 for the same period in 2022. An increase of almost 37%.
  • Net income of $15,898 for the three months ended September 30, compared to net income of $13,211 in the same period in 2022.
  • Diluted earnings per ordinary share of $0.16 for the three months ended September 30, compared to earnings of $0.13 per share for the same period in 2022.


  • Revenue of $818,658 for the nine months ended September 30, compared to $572,592 for the same period in 2022. An increase of almost 43%.
  • Net earnings of $48,567 for the nine months ended September 30, compared to net earnings of $26,950 in the same period in 2022.
  • Diluted earnings per ordinary share of $0.48 for the nine months ended September 30, compared to earnings of $0.27 per share for the same period in 2022.

Rivian Automotive, Inc.

All currency listed in millions of US dollars, except for per share data.

Selected highlights from their third quarter 2023 financial results on November 7, 2023

  • Revenue of $1,337 for the three months ended September 30, compared to $536 for the same period in 2022. An increase of almost 150%.
  • Net loss of $1,440 for the three months ended September 30, compared to a net loss of $1,774 in the same period in 2022.
  • Diluted loss per ordinary share of $1.44 for the three months ended September 30, compared to a loss of $1.88 per share for the same period in 2022.


  • Revenue of $3,119 for the nine months ended September 30, compared to $995 for the same period in 2022. An increase of over 213%.
  • Net loss of $3,911 for the nine months ended September 30, compared to a net loss of $5,029 in the same period in 2022.
  • Diluted loss per ordinary share of $4.15 for the nine months ended September 30, compared to a loss of $5.53 per share for the same period in 2022.

Marqeta, Inc.

All currency listed in thousands of US dollars, except for per share data.

Selected highlights from their third quarter 2023 financial results on November 7, 2023

  • Revenue of $108,891 for the three months ended September 30, compared to $191,621 for the same period in 2022. A decrease of almost 43%.
  • Net loss of $54,990 for the three months ended September 30, compared to a net loss of $53,168 in the same period in 2022.
  • Diluted loss per ordinary share of $0.10 for the three months ended September 30, compared to a loss of $0.10 per share for the same period in 2022.


  • Revenue of $557,349 for the nine months ended September 30, compared to $544,401 for the same period in 2022. An increase of over 2%.
  • Net loss of $182,587 for the nine months ended September 30, compared to net earnings of $158,454 in the same period in 2022.
  • Diluted loss per ordinary share of $0.34 for the nine months ended September 30, compared to a loss of $0.29 per share for the same period in 2022.

Magnite, Inc.

All currency listed in thousands of US dollars, except for per share data.

Selected highlights from their third quarter 2023 financial results on November 8, 2023

  • Revenue of $150,085 for the three months ended September 30, compared to $145,815 for the same period in 2022. An increase of almost 3%.
  • Net loss of $17,477 for the three months ended September 30, compared to a net loss of $24,391 in the same period in 2022.
  • Diluted loss per ordinary share of $0.13 for the three months ended September 30, compared to a loss of $0.18 per share for the same period in 2022.


  • Revenue of $432,778 for the nine months ended September 30, compared to $401,670 for the same period in 2022. An increase of almost 8%.
  • Net loss of $190,098 for the nine months ended September 30, compared to a net loss of $93,938 in the same period in 2022.
  • Diluted loss per ordinary share of $1.40 for the nine months ended September 30, compared to a loss of $0.71 per share for the same period in 2022.

Nuvei Corporation

All currency listed in thousands of US dollars, except for per share data.

Selected highlights from their third quarter 2023 financial results on November 8, 2023

  • Revenue of $304,852 for the three months ended September 30, compared to $197,146 for the same period in 2022. An increase of almost 55%.
  • Net loss of $18,120 for the three months ended September 30, compared to net income of $13,006 in the same period in 2022.
  • Diluted loss per ordinary share of $0.14 for the three months ended September 30, compared to earnings of $0.08 per share for the same period in 2022.


  • Revenue of $868,376 for the nine months ended September 30, compared to $622,984 for the same period in 2022. An increase of over 39%.
  • Net loss of $14,792 for the nine months ended September 30, compared to net earnings of $52,603 in the same period in 2022.
  • Diluted loss per ordinary share of $0.14 for the nine months ended September 30, compared to earnings of $0.34 per share for the same period in 2022.

kneat.com, inc.

All currency listed in thousands of Canadian dollars, except for per share data.

Selected highlights from their third quarter 2023 financial results on November 8, 2023

  • Revenue of $8,405,262 for the three months ended September 30, compared to $5,751,558 for the same period in 2022. An increase of over 46%.
  • Net loss of $3,591,428 for the three months ended September 30, compared to a net loss of $2,546,960 in the same period in 2022.
  • Diluted loss per ordinary share of $0.05 for the three months ended September 30, compared to a loss of $0.03 per share for the same period in 2022.


  • Revenue of $24,409,409 for the nine months ended September 30, compared to $16,449,162 for the same period in 2022. An increase of over 48%.
  • Net loss of $11,464,497 for the nine months ended September 30, compared to a net loss of $9,607,108 in the same period in 2022.
  • Diluted loss per ordinary share of $0.15 for the nine months ended September 30, compared to a loss of $0.12 per share for the same period in 2022.

Copperleaf Technologies Inc.

All currency listed in thousands of Canadian dollars, except for per share data.

Selected highlights from their third quarter 2023 financial results on November 8, 2023

  • Revenue of $19,888 for the three months ended September 30, compared to $18,061 for the same period in 2022. An increase of over 10%.
  • Net loss of $5,237 for the three months ended September 30, compared to a net loss of $7,502 in the same period in 2022.
  • Diluted loss per ordinary share of $0.07 for the three months ended September 30, compared to a loss of $0.11 per share for the same period in 2022.


  • Revenue of $58,358 for the nine months ended September 30, compared to $54,214 for the same period in 2022. An increase of almost 8%.
  • Net loss of $29,633 for the nine months ended September 30, compared to a net loss of $25,895 in the same period in 2022.
  • Diluted loss per ordinary share of $0.41 for the nine months ended September 30, compared to a loss of $0.37 per share for the same period in 2022.

Crew Energy Inc.

All currency listed in thousands of Canadian dollars, except for per share data.

Selected highlights from their third quarter 2023 financial results on November 8, 2023

  • Revenue of $70,317 for the three months ended September 30, compared to $132,950 for the same period in 2022. A decrease of over 47%.
  • Net income of $4,878 for the three months ended September 30, compared to net income of $105,658 in the same period in 2022.
  • Diluted earnings per ordinary share of $0.03 for the three months ended September 30, compared to earnings of $0.65 per share for the same period in 2022.


  • Revenue of $237,624 for the nine months ended September 30, compared to $461,621 for the same period in 2022. An increase of over 48%.
  • Net income of $79,961 for the nine months ended September 30, compared to net income of $192,976 in the same period in 2022.
  • Diluted earnings per ordinary share of $0.49 for the nine months ended September 30, compared to earnings of $1.19 per share for the same period in 2022.

Trade Desk, Inc.

All currency listed in thousands of US dollars, except for per share data.

Selected highlights from their third quarter 2023 financial results on November 9, 2023

  • Revenue of $493,266 for the three months ended September 30, compared to $394,773 for the same period in 2022. An increase of almost 25%.
  • Net income of $39,352 for the three months ended September 30, compared to net income of $15,869 in the same period in 2022.
  • Diluted earnings per ordinary share of $0.08 for the three months ended September 30, compared to earnings of $0.03 per share for the same period in 2022.


  • Revenue of $1,340,323 for the nine months ended September 30, compared to $1,087,058 for the same period in 2022. An increase of over 23%.
  • Net earnings of $81,617 for the nine months ended September 30, compared to a net loss of $17,802 in the same period in 2022.
  • Diluted earnings per ordinary share of $0.16 for the nine months ended September 30, compared to a loss of $0.04 per share for the same period in 2022.

Navitas Semiconductor Corporation

All currency listed in thousands of US dollars, except for per share data.

Selected highlights from their third quarter 2023 financial results on November 9, 2023

  • Revenue of $21,978 for the three months ended September 30, compared to $10,243 for the same period in 2022. An increase of almost 115%.
  • Net income of $7,519 for the three months ended September 30, compared to a net loss of $32,828 in the same period in 2022.
  • Diluted earnings per ordinary share of $0.04 for the three months ended September 30, compared to a loss of $0.24 per share for the same period in 2022.


  • Revenue of $53,399 for the nine months ended September 30, compared to $25,594 for the same period in 2022. An increase of over 108%.
  • Net loss of $112,855 for the nine months ended September 30, compared to net earnings of $81,039 in the same period in 2022.
  • Diluted loss per ordinary share of $0.68 for the nine months ended September 30, compared to earnings of $0.58 per share for the same period in 2022.

indie Semiconductor, Inc.

All currency listed in thousands of US dollars, except for per share data.

Selected highlights from their third quarter 2023 financial results on November 9, 2023

  • Revenue of $60,476 for the three months ended September 30, compared to $30,016 for the same period in 2022. An increase of over 101%.
  • Net loss of $18,677 for the three months ended September 30, compared to a net loss of $45,432 in the same period in 2022.
  • Diluted loss per ordinary share of $0.12 for the three months ended September 30, compared to a loss of $0.31 per share for the same period in 2022.


  • Revenue of $153,036 for the nine months ended September 30, compared to $77,770 for the same period in 2022. An increase of almost 97%.
  • Net loss of $114,206 for the nine months ended September 30, compared to a net loss of $37,030 in the same period in 2022.
  • Diluted loss per ordinary share of $0.73 for the nine months ended September 30, compared to a loss of $0.27 per share for the same period in 2022.

GDI Integrated Facility Services Inc.

All currency listed in millions of Canadian dollars, except for per share data.

Selected highlights from their third quarter 2023 financial results on November 9, 2023

  • Revenue of $615 for the three months ended September 30, compared to $563 for the same period in 2022. An increase of over 9%.
  • Net income of $8 for the three months ended September 30, compared to net income of $11 in the same period in 2022.
  • Diluted earnings per ordinary share of $0.35 for the three months ended September 30, compared to earnings of $0.44 per share for the same period in 2022.


  • Revenue of $1,815 for the nine months ended September 30, compared to $1,584 for the same period in 2022. An increase of almost 16%.
  • Net earnings of $13 for the nine months ended September 30, compared to net earnings of $27 in the same period in 2022.
  • Diluted earnings per ordinary share of $0.54 for the nine months ended September 30, compared to earnings of $1.13 per share for the same period in 2022.

Unity Software Inc.

All currency listed in thousands of US dollars, except for per share data.

Selected highlights from their third quarter 2023 financial results on November 9, 2023

  • Revenue of $544,210 for the three months ended September 30, compared to $322,881 for the same period in 2022. An increase of over 68%.
  • Net loss of $125,310 for the three months ended September 30, compared to a net loss of $250,021 in the same period in 2022.
  • Diluted loss per ordinary share of $0.32 for the three months ended September 30, compared to a loss of $0.84 per share for the same period in 2022.


  • Revenue of $1,578,049 for the nine months ended September 30, compared to $940,050 for the same period in 2022. An increase of almost 68%.
  • Net loss of $572,337 for the nine months ended September 30, compared to a net loss of $631,734 in the same period in 2022.
  • Diluted loss per ordinary share of $1.49 for the nine months ended September 30, compared to a loss of $2.13 per share for the same period in 2022.

Docebo Inc.

All currency listed in thousands of US dollars, except for per share data.

Selected highlights from their third quarter 2023 financial results on November 9, 2023

  • Revenue of $46,506 for the three months ended September 30, compared to $36,966 for the same period in 2022. An increase of almost 26%.
  • Net income of $4,047 for the three months ended September 30, compared to net income of $10,274 in the same period in 2022.
  • Diluted earnings per ordinary share of $0.12 for the three months ended September 30, compared to earnings of $0.30 per share for the same period in 2022.


  • Revenue of $131,559 for the nine months ended September 30, compared to $103,957 for the same period in 2022. An increase of over 26%.
  • Net loss of $382 for the nine months ended September 30, compared to net earnings of $5,418 in the same period in 2022.
  • Diluted loss per ordinary share of $0.01 for the nine months ended September 30, compared to earnings of $0.16 per share for the same period in 2022.

Brookfield Reinsurance

All currency listed in millions of US dollars, except for per share data.

Selected highlights from their third quarter 2023 financial results on November 9, 2023

  • Revenue of $1,450 for the three months ended September 30, compared to $1,376 for the same period in 2022. An increase of over 5%.
  • Net income of $77 for the three months ended September 30, compared to net income of $139 in the same period in 2022.
  • Diluted earnings per ordinary share of $0.07 for the three months ended September 30, compared to earnings of $0.14 per share for the same period in 2022.


  • Revenue of $4,963 for the nine months ended September 30, compared to $2,934 for the same period in 2022. An increase of over 69%.
  • Net earnings of $344 for the nine months ended September 30, compared to net earnings of $320 in the same period in 2022.
  • Diluted earnings per ordinary share of $0.21 for the nine months ended September 30, compared to earnings of $0.42 per share for the same period in 2022.

Algonquin Power & Utilities Corp.

All currency listed in thousands of US dollars, except for per share data.

Selected highlights from their third quarter 2023 financial results on November 10, 2023

  • Revenue of $624,738 for the three months ended September 30, compared to $664,440 for the same period in 2022. A decrease of almost 6%.
  • Net loss of $187,326 for the three months ended September 30, compared to a net loss of $207,335 in the same period in 2022.
  • Diluted loss per ordinary share of $0.26 for the three months ended September 30, compared to a loss of $0.29 per share for the same period in 2022.


  • Revenue of $2,031,236 for the nine months ended September 30, compared to $2,017,063 for the same period in 2022. An increase of almost 1%.
  • Net loss of $200,037 for the nine months ended September 30, compared to a net loss of $217,059 in the same period in 2022.
  • Diluted loss per ordinary share of $0.24 for the nine months ended September 30, compared to a loss of $0.21 per share for the same period in 2022.

Portfolio 2

Portfolio 2 for the week ended November 10, 2023: UP Green Up Arrow, signifying a positive week

  • Walt Disney Corporation has hired Hugh Johnston as its latest Chief Financial Officer. Mr. Johnston was previously PepsiCo’s (NYSE: PEP) CFO. He will start at Disney in early December.
  • MongoDB announced they were partnering with Amazon’s Amazon Web Services (AWS) to enhance and train AWS’s CodeWhisperer, an artificial intelligence (AI) coding writing companion. This will allow AWS customers to accelerate application development.
  • Guardant Health announced their Chief Operating Officer has resigned, effective November 10. However, she will remain with the company until December 1 to help with the transition.

Activity

No significant activity to report this week.

Dividends

Dividends Received this week for the following companies:

Companies followed by DRIP (Dividend Re-Investment Plan) indicate additional shares were purchased with the dividend. Any cash leftover was added to the cash balance.

Canadian $

Bank of Nova Scotia (TSE: BNS) DRIP

US $

No US$ dividends this past week.

Quarterly Reports

Brookfield Infrastructure Partners L.P.

All currency listed in millions of US dollars, except for per share data.

Selected highlights from their third quarter 2023 financial results on November 1, 2023

  • Revenue of $4,487 for the three months ended September 30, compared to $3,627 for the same period in 2022. An increase of almost 24%.
  • Net income of $256 for the three months ended September 30, compared to net income of $361 in the same period in 2022.
  • Diluted earnings per ordinary share of $0.03 for the three months ended September 30, compared to earnings of $0.05 per share for the same period in 2022.


  • Revenue of $12,961 for the nine months ended September 30, compared to $10,719 for the same period in 2022. An increase of almost 21%.
  • Net earnings of $1,172 for the nine months ended September 30, compared to net earnings of $1,080 in the same period in 2022.
  • Diluted earnings per ordinary share of $0.34 for the nine months ended September 30, compared to earnings of $0.17 per share for the same period in 2022.

Guardant Health, Inc.

All currency listed in thousands of US dollars, except for per share data.

Selected highlights from their third quarter 2023 financial results on November 6, 2023

  • Revenue of $143,030 for the three months ended September 30, compared to $117,404 for the same period in 2022. An increase of almost 22%.
  • Net loss of $86,102 for the three months ended September 30, compared to a net loss of $161,994 in the same period in 2022.
  • Diluted loss per ordinary share of $0.73 for the three months ended September 30, compared to a loss of $1.58 per share for the same period in 2022.


  • Revenue of $408,894 for the nine months ended September 30, compared to $322,647 for the same period in 2022. An increase of almost 27%.
  • Net loss of $292,406 for the nine months ended September 30, compared to a net loss of $514,654 in the same period in 2022.
  • Diluted loss per ordinary share of $2.66 for the nine months ended September 30, compared to a loss of $5.04 per share for the same period in 2022.

iA Financial Corporation Inc.

All currency listed in millions of Canadian dollars, except for per share data.

Selected highlights from their third quarter 2023 financial results on November 7, 2023

  • Revenue of $1,458 for the three months ended September 30, compared to $1,275 for the same period in 2022. An increase of over 14%.
  • Net income of $56 for the three months ended September 30, compared to net income of $4 in the same period in 2022.
  • Diluted earnings per ordinary share of $0.65 for the three months ended September 30, compared to earnings of $0.01 per share for the same period in 2022.


  • Revenue of $4,193 for the nine months ended September 30, compared to $3,755 for the same period in 2022. An increase of almost 12%.
  • Net earnings of $533 for the nine months ended September 30, compared to net earnings of $142 in the same period in 2022.
  • Diluted earnings per ordinary share of $5.04 for the nine months ended September 30, compared to earnings of $1.19 per share for the same period in 2022.

TC Energy Corporation

All currency listed in millions of Canadian dollars, except for per share data.

Selected highlights from their third quarter 2023 financial results on November 8, 2023

  • Revenue of $3,940 for the three months ended September 30, compared to $3,799 for the same period in 2022. An increase of almost 4%.
  • Net loss of $173 for the three months ended September 30, compared to net income of $862 in the same period in 2022.
  • Diluted loss per ordinary share of $0.19 for the three months ended September 30, compared to earnings of $0.84 per share for the same period in 2022.


  • Revenue of $3,829 for the nine months ended September 30, compared to $3,497 for the same period in 2022. An increase of over 9%.
  • Net earnings of $1,366 for the nine months ended September 30, compared to net earnings of $2,088 in the same period in 2022.
  • Diluted earnings per ordinary share of $1.33 for the nine months ended September 30, compared to earnings of $2.11 per share for the same period in 2022.

Chorus Aviation Inc.

All currency listed in thousands of Canadian dollars, except for per share data.

Selected highlights from their third quarter 2023 financial results on November 8, 2023

  • Revenue of $447,596 for the three months ended September 30, compared to $421,326 for the same period in 2022. An increase of over 6%.
  • Net income of $17,148 for the three months ended September 30, compared to net income of $23,561 in the same period in 2022.
  • Diluted earnings per ordinary share of $0.04 for the three months ended September 30, compared to earnings of $0.06 per share for the same period in 2022.


  • Revenue of $1,259,623 for the nine months ended September 30, compared to $1,156,049 for the same period in 2022. An increase of almost 9%.
  • Net earnings of $69,485 for the nine months ended September 30, compared to net earnings of $6,065 in the same period in 2022.
  • Diluted earnings per ordinary share of $0.20 for the nine months ended September 30, compared to a loss of $0.05 per share for the same period in 2022.

Kneat.com

See report under Portfolio 1.

The Walt Disney Company

All currency listed in millions of US dollars, except for per share data.

Selected highlights from their fourth quarter 2023 financial results on November 8, 2023

  • Revenue of $21,241 for the three months ended September 30, compared to $20,150 for the same period in 2022. An increase of over 5%.
  • Net income of $694 for the three months ended September 30, compared to net income of $254 in the same period in 2022.
  • Diluted earnings per ordinary share of $0.14 for the three months ended September 30, compared to earnings of $0.09 per share for the same period in 2022.


  • Revenue of $88,898 for the nine months ended September 30, compared to $82,722 for the same period in 2022. An increase of almost 5%.
  • Net earnings of $2,354 for the nine months ended September 30, compared to net earnings of $3,145 in the same period in 2022.
  • Diluted earnings per ordinary share of $1.29 for the nine months ended September 30, compared to earnings of $1.72 per share for the same period in 2022.

Take-Two Interactive Software, Inc.

All currency listed in millions of US dollars, except for per share data.

Selected highlights from their second quarter 2023 financial results on November 8, 2023

  • Revenue of $1,299.2 for the three months ended September 30, compared to $1,393.5 for the same period in 2022. A decrease of almost 7%.
  • Net loss of $543.6 for the three months ended September 30, compared to a net loss of $257.0 in the same period in 2022.
  • Diluted loss per ordinary share of $3.20 for the three months ended September 30, compared to a loss of $1.54 per share for the same period in 2022.


  • Revenue of $2,583.9 for the nine months ended September 30, compared to $2,495.9 for the same period in 2022. An increase of over 3%.
  • Net loss of $749.6 for the nine months ended September 30, compared to a net loss of $361.0 in the same period in 2022.
  • Diluted loss per ordinary share of $4.42 for the nine months ended September 30, compared to a loss of $2.38 per share for the same period in 2022.

SmartCentres Real Estate Investment Trust

All currency listed in thousands of Canadian dollars, except for per share data.

Selected highlights from their third quarter 2023 financial results on November 8, 2023

  • Revenue of $206,016 for the three months ended September 30, compared to $196,962 for the same period in 2022. An increase of almost 44%.
  • Net income of $215,175 for the three months ended September 30, compared to net income of $3,548 in the same period in 2022.
  • Revenue of $623,560 for the nine months ended September 30, compared to $598,375 for the same period in 2022. An increase of over 4%.
  • Net earnings of $495,938 for the nine months ended September 30, compared to net earnings of $535,655 in the same period in 2022.

Crew Energy Inc.

See report under Portfolio 1.

Supremex Inc.

All currency listed in thousands of Canadian dollars.

Selected highlights from their third quarter 2023 financial results on November 9, 2023

  • Revenue of $69,798,092 for the three months ended September 30, compared to $67,918,827 for the same period in 2022. An increase of almost 3%.
  • Net income of $5,000,707 for the three months ended September 30, compared to net income of $8,110,570 in the same period in 2022.
  • Diluted earnings per ordinary share of $0.19 for the three months ended September 30, compared to earnings of $0.31 per share for the same period in 2022.


  • Revenue of $229,886,140 for the nine months ended September 30, compared to $193,705,893 for the same period in 2022. An increase of over 73%.
  • Net earnings of $16,609,748 for the nine months ended September 30, compared to net earnings of $21,776,377 in the same period in 2022.
  • Diluted earnings per ordinary share of $0.64 for the nine months ended September 30, compared to earnings of $0.83 per share for the same period in 2022.

Portfolio 3

Portfolio 3 for the week ended November 10, 2023: UP Green Up Arrow, signifying a positive week

  • Microsoft (NASD: MSFT) announced the release of Call of Duty: Modern Warfare III, the first Activision title released since Microsoft’s acquisition of Activision Blizzard. The availability of this title on all major gaming platforms was one of the major roadblocks to completion of the deal. As Microsoft said, it was released on all major platforms.
  • Alvopetro Energy (TSXV: ALV) announced the completion of drilling on their 183-A3 well, located on their Murucututu natural gas field, in October. The company hopes to have the well operational by the end of November.

Activity

No significant activity to report this week.

Dividends

Dividends Received this week for the following companies:

Companies followed by DRIP (Dividend Re-Investment Plan) indicate additional shares were purchased with the dividend. Any cash leftover was added to the cash balance.

No dividends this past week.

Quarterly Reports

Brookfield Asset Management ULC

All currency listed in millions of US dollars, except for per share data.

Selected highlights from their third quarter 2023 financial results on November 6, 2023

  • Revenue of $778 for the three months ended September 30, compared to $715 for the same period in 2022. An increase of almost 9%.
  • Net income of $510 for the three months ended September 30, compared to net income of $695 in the same period in 2022.
  • Diluted earnings per ordinary share of $0.31 for the three months ended September 30.


  • Revenue of $2,339 for the nine months ended September 30, compared to $2,051 for the same period in 2022. An increase of over 14%.
  • Net earnings of $1,606 for the nine months ended September 30, compared to net earnings of $2,252 in the same period in 2022.
  • Diluted earnings per ordinary share of $089 for the nine months ended September 30.

Kneat.com

See report under Portfolio 1.

goeasy Ltd.

All currency listed in thousands of Canadian dollars, except for per share data.

Selected highlights from their third quarter 2023 financial results on November 7, 2023

  • Revenue of $321,732 for the three months ended September 30, compared to $262,216 for the same period in 2022. An increase of almost 23%.
  • Net income of $66,310 for the three months ended September 30, compared to net income of $47,189 in the same period in 2022.
  • Diluted earnings per ordinary share of $3.87 for the three months ended September 30, compared to earnings of $2.86 per share for the same period in 2022.


  • Revenue of $911,957 for the nine months ended September 30, compared to $746,010 for the same period in 2022. An increase of over 22%.
  • Net earnings of $173,296 for the nine months ended September 30, compared to net earnings of $111,585 in the same period in 2022.
  • Diluted earnings per ordinary share of $10.14 for the nine months ended September 30, compared to earnings of $6.71 per share for the same period in 2022.

Fortuna Silver Mines Inc.

All currency listed in thousands of US dollars, except for per share data.

Selected highlights from their third quarter 2023 financial results on November 8, 2023

  • Revenue of $243,055 for the three months ended September 30, compared to $166,568 for the same period in 2022. An increase of almost 46%.
  • Net income of $30,883 for the three months ended September 30, compared to a net loss of $4,126 in the same period in 2022.
  • Diluted earnings per ordinary share of $0.09 for the three months ended September 30, compared to a loss of $0.01 per share for the same period in 2022.


  • Revenue of $577,114 for the nine months ended September 30, compared to $516,768 for the same period in 2022. An increase of almost 12%.
  • Net earnings of $46,209 for the nine months ended September 30, compared to net earnings of $24,528 in the same period in 2022.
  • Diluted earnings per ordinary share of $0.14 for the nine months ended September 30, compared to earnings of $0.08 per share for the same period in 2022.

Magnite

See report under Portfolio 1.

Alvopetro Energy Ltd.

All currency listed in thousands of Canadian dollars, except for per share data.

Selected highlights from their third quarter 2023 financial results on November 8, 2023

  • Revenue of $12,313 for the three months ended September 30, compared to $16,672 for the same period in 2022. A decrease of over 26%.
  • Net income of $5,819 for the three months ended September 30, compared to net income of $8,795 in the same period in 2022.
  • Diluted earnings per ordinary share of $0.15 for the three months ended September 30, compared to earnings of $0.24 per share for the same period in 2022.


  • Revenue of $44,387 for the nine months ended September 30, compared to $46,431 for the same period in 2022. A decrease of over 4%.
  • Net earnings of $27,873 for the nine months ended September 30, compared to net earnings of $26,541 in the same period in 2022.
  • Diluted earnings per ordinary share of $0.74 for the nine months ended September 30, compared to earnings of $0.72 per share for the same period in 2022.

GDI Integrated Services

See report under Portfolio 1.

Unity Software

See report under Portfolio 1.

SmartCentres Real Estate Investment Trust

See report under Portfolio 2.

Brookfield Corporation

All currency listed in millions of US dollars, except for per share data.

Selected highlights from their third quarter 2023 financial results on November 9, 2023

  • Revenue of $24,441 for the three months ended September 30, compared to $23,418 for the same period in 2022. An increase of over 4%.
  • Net income of $35 for the three months ended September 30, compared to net income of $716 in the same period in 2022.
  • Diluted earnings per ordinary share of $0.12 for the three months ended September 30, compared to earnings of $0.24 per share for the same period in 2022.


  • Revenue of $71,406 for the nine months ended September 30, compared to $68,556 for the same period in 2022. An increase of over 4%.
  • Net earnings of $1,971 for the nine months ended September 30, compared to net earnings of $5,151 in the same period in 2022.
  • Diluted earnings per ordinary share of $0.20 for the nine months ended September 30, compared to earnings of $1.40 per share for the same period in 2022.


Weekly Update for the week ending November 3, 2023

Items that may only interest or educate me ….

Canadian Economic news, US Economic news, US Interest rate remains unchanged, Magnificent Seven update, ….

Following a turbulent October, North American stock markets regained their footing as November began, thanks to the US Federal Reserve (Fed)’s decision to leave the US benchmark interest rate unchanged. Although the Fed kept the possibility of future hikes open, widespread belief among analysts and investors suggests that the US interest rate might have reached its peak. If the Fed chooses to hold the rate steady at their year-end meeting in December, it will mark the third consecutive meeting without a change. Many experts view this as a potential indication of the end of the recent rate hikes. We shall see.

Canadian Economic news

This past week’s key economic data that the Bank of Canada (BoC) considers when deciding whether to raise or lower the interest rate.

Gross Domestic Product

Statistics Canada’s recent report revealed that in August Canada’s economy, as measured by Gross Domestic Product (GDP), remained stagnant, showing no growth for a second straight month. The goods-producing industries experienced a slight decline of 0.2%, with the ‘Mining, quarrying, and oil and gas extraction’ sector being the only subsector to show growth, albeit modest at 1.2%. Meanwhile, the services-producing industries saw a marginal increase of 0.1%, primarily driven by a 2.3% growth in wholesale trade. Among the twenty industries constituting the goods and services sectors, only eight grew in August.

Year-on-year, the GDP increased by 0.9%. Within the goods-producing industries, ‘Mining, quarrying, and oil and gas extraction’ stood out with a 0.9% growth. In the services-producing sector, ‘Arts, entertainment, and recreation’ led the way with a 1.9% increase.

The report from Statistics Canada identified persistent inflation, resulting in higher interest rates, along with challenges such as forest fires and drought conditions, as the primary factors hampering growth throughout August.

Following a 0.2% dip in June, the Canadian economy was flat in both July and August. Early indicators suggest a similar trend for September, if not worse, indicating a stalled economy during the third quarter (July to September). There are concerns it might even register a quarterly decline on a year-over-year basis, marking the second consecutive quarterly downturn. Worse, the Organization for Economic Co-operation and Development (OECD), expects Canada’s per capita GDP growth to be the worst among advanced countries over the next thirty year. Ouch!

For us investors, flat or negative GDP growth is a bearish signal. A struggling economy often translates to lower corporate earnings, leading to declining stock prices, and negatively impacting investments.

Typically, two consecutive quarters of economic decline are considered indicators of a recession, a period of economic contraction often leading to reduced business profitability, potential layoffs, and decreased consumer spending.

Jobs

Canada’s employment data for October, as measured by the Labour Force Survey (LFS), revealed a further slowdown in job creation, with only 18,000 new jobs added compared to the 64,000 added in September, falling short of the projected 22,500 jobs. Moreover, the monthly employment rate, representing the proportion of the working-age population employed, declined by 0.1% to 61.9%.

In tandem, the unemployment rate climbed to 5.7% in October, surpassing both analysts’ expectations of 5.6% and the 5.5% rate recorded in September. This marks the fourth increase in unemployment within the last six months.

This data underscores the continued cooling of the labour market, confirming a slowdown in the Canadian economy, as highlighted in the GDP update above. This downward trend strengthens the argument that the BoC no longer needs to further raise the benchmark interest rate.

Canadian market volatility

The Canadian Volatility Index (VIXC), as measured by the TSX 60 VIXI, ended the week at 14.14, down from last week’s reading of 18.4. Perceived market volatility in the Canadian stock market is now well below 20. A Canadian VIX reading above 20 is considered high, while a reading below 20 is considered to be low. A reading of 14.14 suggests Canadian investors are feeling very bullish about the Canadian stock market. They are less fearful and more confident about the future of the Canadian market.

US Economic news

This past week’s key data points that the Federal Reserve (Fed) considers when deciding whether to raise or lower the interest rate.

Job reports

There were three main job reports this week that capture the American job market: the Labor Department’s Job Openings and Labor Turnover Survey (JOLTS), followed by ADP’s private payrolls report, and finally, the Labor Department’s Employment Situation Summary (ESS).

Data from the Labor Department’s September JOLTS revealed a rise in job openings, reaching 9.553 million. Although slightly down from August’s 9.61 million, it surpassed estimates of 9.25 million, indicating a robust demand for labour. That works out to 1.5 jobs for every unemployed person in September. Job openings are a measure of demand for labour.

On a monthly basis, the number of job openings grew in the accommodation and food services industry, up 141,000. The biggest decline in job openings was in the ‘other services’ industry.

Next we have the ADP employment survey for October. The ADP payroll report is a closely watched indicator of the U.S. labour market, as it is generally considered to be a good predictor of the government’s employment report that follows two days later. This latest report showed that the private sector employment increased by 113,000 jobs in October, and annual pay was up 5.7 percent year-over-year. This was the slowest pace of job growth since October 2021, but it was still above economists’ expectations of 89,000 jobs added.

The ADP report is also good news for workers, as it suggests that wages are continuing to rise. The annual pay increase of 5.7 percent is the fastest pace of wage growth since 2006. This is a positive sign for the economy, as it suggests that consumers have more money to spend.

Finally, we have the Labor Department’s ESS for October. The report showed that nonfarm payroll employment increased by 150,000, slowing considerably from a gain of 336,000 jobs in September and well below analysts forecast of a gain of 180,000. The unemployment rate edged up to 3.9% from 3.8% in September. This was higher than an expected gain of 3.8%.

The job gains in October were concentrated in the health care, government, and social assistance sectors. Employment in manufacturing declined due to strike activity that left 33,000 less employees on the payrolls of the auto manufacturers. Other major industries showed little change in employment over the month.

The average hourly earnings for all employees on private nonfarm payrolls rose by 7 cents, or 0.2%, to $34.00 in October. Year over year, average hourly earnings have increased by 4.1%, down slightly from a 4.3% gain in September.

The report was a sign of a cooling demand for labour, as the higher interest rates continue to slow the economy. The good news is the Fed is likely to maintain the existing rate at their next meeting in December. The figures could bring the Federal Reserve’s historic interest-rate increases to an end by providing stronger evidence that higher borrowing costs have slowed the economy.

Overall, these three reports indicate that the labour market remains strong but is slowing. The high number of job openings and rising wages indicate that there is still strong demand for workers. The robust labour market continues to drive a strong economy. However, the slowing pace of job growth suggests that the labour market is no longer as tight as it was earlier in the year.

This is good news for workers, as it means that they are likely to have more bargaining power when it comes to wages and benefits, as the recent auto workers strike can attest. However, it is also a sign that the economy is cooling down.

For investors, the cooling labour market suggests that the economy is slowing down, and that inflation is likely to come down on its own. Hopefully, upcoming economic data will support the downward trend of inflation and the Fed will be more likely to leave interest rates unchanged at their next meeting in early December.

American market volatility

During the week, the CBOE Volatility Index (VIX) fell to 14.91, well down from 21.27 last week. This suggests that investors are currently feeling very bullish about the stock markets and are relatively unconcerned about the risk of volatility.

Consumer Confidence Index

The Conference Board reported its Consumer Confidence Index (CCI) for October dropped to 102.6, down from an updated 104.3 in September. Analysts had expected a bigger drop to 100.0.

The Consumer Confidence Index (CCI) is a measure of how optimistic consumers are about the current state of the economy and their future financial prospects. When consumers are confident, they are more likely to spend money and invest in the future, boosting economic growth and leading to higher corporate earnings. Conversely, when consumers are pessimistic, they are more likely to save money and cut back on spending which can dampen economic growth and lead to lower corporate earnings.

While a reading of 100 is considered high, October was the third consecutive month consumer’s confidence has slipped. This suggest consumers remain fairly optimistic but are becoming less optimistic about the future, which could have implications for economic growth in the coming months.

US Interest rate remains unchanged

As widely expected, the Fed’s Federal Open Market Committee (FOMC) announced that it was holding the benchmark interest rate at 5.25 – 5.5%. This was the second consecutive meeting that the Fed has held rates steady, after raising them eleven times since March 2022 to combat high inflation. In the post meeting press conference, Fed Chair Jerome Powell said the decision to hold the rate steady does not mean that they will not raise rates further. He said they will continue to monitor economic data and adjust its policies as needed.

The decision comes at a time when the US economy is showing signs of slowing, but inflation remains elevated. In its statement, the Fed noted that “recent indicators of economic activity have weakened.” However, the Committee also said that “the labor market remains robust” and that “inflation remains elevated, reflecting supply and demand imbalances related to the pandemic, the wars in Ukraine and the Middle East, and other factors.”

The statement also said they do not see a recession on the horizon. Recent strong economic data, combined with the current economic activity is “not indicative of a recession in the near term.” As a result, the Fed upgraded the economy from growing at a “solid pace” to a “strong pace.” They acknowledged the growing economic activity, that job openings continue to grow but the pace of openings is slowing, and unemployment remains low. However, inflation remains higher than they would like.

Powell said that the Fed is “committed to bringing inflation back down to our 2 percent objective” and that “monetary policy will remain restrictive for some time.” In other words, higher for longer. However, he also said that the Fed will be “data-dependent” in making its decisions and that it will “take the necessary steps to ensure that the economy remains on a path of sustainable growth.”

Overall, the Fed’s decision to hold rates steady and Powell’s comments suggest that the Fed is taking a cautious approach to monetary policy (setting interest rates). The Fed is clearly concerned about the risk of sending the economy into a recession, but it is also committed to bringing inflation under control.

Magnificent Seven update

The ‘Magnificent Seven,’ consisting of Nvidia (NASD: NVDA), Tesla (NASD: TSLA), Meta Platforms (NASD: META), Apple (NASD: AAPL), Amazon.com (NASD: AMZN), Microsoft (NASD: MSFT), and Alphabet (NASD: GOOGL), got off to a torrid start in the first half of 2023. The share prices of these seven large technology companies soared, driving most of the market gains, thanks in large part to the roll out of artificial intelligence (AI).

But the tide turned in August, when higher interest rates, concerns about inflation, and a general sell-off in technology stocks weighed on the markets. As of the end of October, these seven giants are now pulling the markets down, with each company in the red since August. Microsoft has held its ground the best, with only a 2.2% decline.

It is important to remember that while the price of their stocks have cooled off, the companies themselves have not changed their operations. The volatility lies in the prices of their shares, not the companies’ fundamentals.

The main reason for the cooling of theses stocks is the ‘higher for longer’ interest rates which has led to an increase in the yields for US government bonds. Higher rates mean more money must be used to service debt rather than grow the company, impacting the bottom line, or net income. As well, investors took some profits from the run up in Magnificent Seven companies that were undervalued at the start of the year and had become significantly overvalued by the end of July. The lure of relatively risk free, high yield government bonds was too hard for investors to ignore so they rotated into the low risk, low volatility US government bonds.

Despite the cooldown of the Magnificent Seven, each of them remains in the green for the year. Gains range from leader Nvidia, up 176% to Apple, the laggard of the group, up ‘only’ 29% for the year.

The recent mixed bag of third quarter earnings from this group has presented buying opportunities for the companies that were punished for missing estimates or did not impress investors with their performance. The Magnificent Seven are still very large and powerful companies with dominant market positions. They continue to invest heavily in new technologies, such as AI, which should leave them well-positioned for long-term growth.


After a disappointing October, the markets rebounded sharply to start off November on the right foot. Let’s see what happened this past week that sparked the upward rebound ….

Weekly Market Review

Monday: after a dismal previous two weeks the markets rallied, leaving the four major North American indexes solidly in positive territory. This week will be busy with the Fed’s meeting, the latest labour data, and more earnings reports, headlined by Apple, the biggest company in the S&P 500 Index (S&P). Oil continues to drop as concerns eased that the Middle East war will spread to other oil producing regions in the area, disrupting the supply lines.

In Canada, the Toronto Stock Exchange Composite Index’s (TSX) eight day losing streak ended by improved investor sentiment for the Canadian economy. Finally! In trading, it was day of broad-based gains across the Canadian sectors, led by Consumer Staples and Technology. The Basic Materials (miners and fertilizer manufacturers) was the only sector that failed to advance.

In the US, the S&P, the Dow Jones Industrial Average (DJIA), and the Nasdaq Composite Index (Nasdaq) were each up over 1% as investors prepare for the Fed’s latest update on the benchmark interest rate. In trading, each of the American sectors ended higher, led by the Telecommunications Services and Consumer Staples sectors. Bringing up the rear was the Energy sector.

Tuesday: after an uncertain start in morning trading, the markets established an upward trend with all indexes ending the day in the green. The Fed started their two-day monetary policy meeting today where they will discuss the US interest rate. Investors expect the Fed will keep the US benchmark rate at 5.5% when they conclude their meeting tomorrow.

In Canada, the latest GDP report indicated the Canadian economy has stalled and may have slipped into a recession during the third quarter. The TSX started a winning streak, posting a small gain led by the Healthcare and Technology sectors. Basic Materials, Utilities and Consumer Cyclicals were the only Canadian sectors to end the day lower.

In the US, investors optimism that the interest rate will remain steady was offset by more mixed earnings reports. However, many went bargain hunting after the beat down stocks have taken the last few days. It was a good day in the American sectors where Telecommunications Services and Utilities were the best performers while Energy was the only sector to lose ground.

Wednesday: the markets moved higher in anticipation of the Fed maintaining its pause on rate hikes. After the announcement that US interest rates would remain at 5.5%, the indexes went on to set session highs.

In Canada, the TSX ran its winning streak to three thanks to strong earnings reports and investor optimism that rate hikes are finished on both sides of the border. It was a day of broad-based gains in the Canadian sectors, with Utilities and Telecommunications Services the best performers. Basic Materials was the only sector to end lower.

In the US, as well as leaving the benchmark rate unchanged, the Fed suggested rate hikes may be done, although they did leave the door open for additional hikes if necessary. It was another good day in the American sectors, led by Technology and Utilities. Consumer Cyclicals was the only sector not to end higher, it ended flat.

Thursday: all four indexes started strong and continued to climb higher for the rest of the day. The news driving the soaring markets was the Fed’s continued pause on the US interest rate and investor optimism that the Fed will maintain the current rate through the rest of the year. Oil prices jumped by more than $2 a barrel after the Fed left the interest rate unchanged. Investors had feared higher rates would likely lower demand for oil products.

In Canada, the TSX jumped 2.9%, in its biggest advance in a year, and reached its highest point since mid October. The big driver were strong earnings from Shopify (TSE: SHOP) and Lightspeed (TSE: LSPD). The Technology sector led all Canadian sectors, with a gain of over 9% for the day, which saw all sectors end in positive territory. Trailing the pack were Basic Materials and Industrials, each up over 1%.

In the USA, all three indexes were bullish as investors digested a number of positive earnings reports and the possibility the rate hikes have come to an end. All sectors were up sharply, led by Energy and Financials. Consumer Staples and healthcare were the laggards.

Friday: the markets shook off a disappointing quarterly report from Apple and maintained the upward momentum of the last few days. Labour data in both countries indicates the respective job markets are cooling, leading investors in both countries to think the central banks may be finished raising interest rates. Oil prices fell on a slight easing of tensions in the Middle East.

In Canada, the TSX closed at a six-week high as investors leaned into the narrative that the BoC was done hiking the interest rate. In trading, it was another good day in the Canadian sectors. Consumer Cyclicals and Basic Materials were the big winners, while Energy was the only sector to decline.

In America, all three indexes ended higher after the market shook off early jitters caused by Apple when the company said it expects revenues to “decelerate significantly” in the fourth quarter. The thought that the Fed will leave the rate unchanged for the next few months sent investors back into the stock markets. In trading, it was another day of broad-based gains in the American sectors, led by Financials and Basic Materials. Energy was the only sector to post a loss.


Weekly Market and Portfolio Review

For the week, the TSX (SPTSX) advanced 5.8%, the S&P 500 (SPX) gained 5.9%, the DJIA (INDU) grew 5.1% and the Nasdaq (CCMP) surged 6.6%.

Bull market. A good week for the North American stock markets. The chart above is the type of chart I like to see, strongly upward. 😊 The four major North American indexes had a strong week. The DJIA posted its strongest weekly gain since the end of October 2022, while the S&P and Nasdaq had their strongest weekly rises since November 2022. The TSX closed the week at its highest point in six weeks.

The rally was driven by several factors, including softer-than-expected economic data in both countries. Friday’s lower than expected employment reports in both countries raised hopes that inflation may be starting to come down. However, the biggest catalyst was the Fed’s mid week decision to leave the US interest rate unchanged, leading investors to believe the Fed may be done raising the benchmark rate. In Canada, the softer labour market and stagnant economy caused a similar sentiment that the BoC was done with rate hikes.

The US volatility index, or VIX, the market’s “fear gauge,” experienced a significant decline this week, falling 42.6%. A similar decline occurred with the Canadian volatility index. This is a sign that investors are becoming less fearful of a recession and are more optimistic about the future of the stock market.

Overall, the four indexes had a very strong week, driven by a number of positive factors. I can only hope that the positive momentum continues in the coming weeks and months. 😊

Bull market. A good week for the North American stock markets. The portfolios had a very good week, riding the wave of a market surge, particularly in the Nasdaq. Portfolio 1 not only benefited from the rise in the mega-cap companies in the portfolio but also saw over 90% of its holdings posting gains. Portfolio 2 had a solid performance, led by Microsoft, with every company in the portfolio ending the week on a high note. Portfolio 3 saw gains in all but one of its holdings, Lithium Americas (Argentina) (TSE: LAAC). However, it was Shopify’s impressive 28% increase that pushed the portfolio’s weekly gains above the 10% mark.

After a three-month downtrend, this positive week was a welcome change.

As Oliver Twist would say, “Please sir, I want some more.”
“Please sir, I want some more.”
Weekly Portfolio & Index performance
Weekly Portfolio & Index performance for the week ended November 3, 2023.

Monthly Market and Portfolio Review

For the month of October, the TSX (SPTSX) fell 3.4%, the S&P 500 (SPX) lost 2.2%, the DJIA (INDU) slipped 1.4% and the Nasdaq (CCMP) dropped 2.8%.

Bearish market In October, North American markets, including the TSX, S&P, DJIA, and Nasdaq, experienced significant volatility, making it one of the worst Octobers in five years. This turbulence was fueled by fears of an economic slowdown, ongoing inflationary pressures, and rising yields on low-risk government bonds. Despite this, corporate earnings remained strong, and the American economy continued to show resilience.

All three major American indexes, DJIA, S&P, and Nasdaq, faced their third consecutive monthly losses. For the DJIA and S&P, it was their longest respective monthly losing streak since the early days of the pandemic in 2020. The DJIA even slipped into negative territory for the year during the current losing streak. The Nasdaq had a similar three-month losing streak back in the summer of 2022.

Investors’ fears were somewhat calmed as softer economic data in both the US and Canada raised hopes of falling inflationary pressures. The positive sentiment was further boosted by the Fed’s decision to keep the US interest rate unchanged, signaling a possible end to rate hikes. In Canada, a cooling labour market and a stagnant economy contributed to the belief that the BoC might halt further rate increases.

Despite the challenges, there were positive indicators. Both the US and Canadian volatility indices experienced significant declines, indicating investors were becoming less fearful of a recession and were more optimistic about the stock market’s future. Amidst the turbulence, strong corporate earnings and the resilient American economy provided a glimmer of hope for investors, suggesting that despite the recent difficulties, the markets could potentially regain their footing in the coming months.

Bearish marketAs you can see in the chart below, it was a disappointing month for the three Portfolios, reflecting a prevailing pessimism in the markets. All three portfolios fell on overall negative market sentiment, surging yields on government bonds that led to investors moving out of stocks and into low/no risk government bonds.

Portfolio 1 got off to a good start with a gain the first week, but it was downhill from there. It was dragged lower by the overall market decline and the technology companies in the portfolio, particularly the bigger technology companies. Portfolio 2 also got off to a decent start, posting weekly gains in the first two weeks before ending with two weekly losses. The portfolio was able to minimize losses by being more conservative and more diversified (the main reason to be diversified). Finally, Portfolio 3 ended lower every week, dragged down by the technology companies in the portfolio, particularly Shopify.

After three months of falling portfolios, hopefully November breaks the streak of monthly losses. It definitely got off to a much better start than October but there is a long way to go, and a lot can happen in volatile markets.

Monthly Portfolio & Index performance
Monthly Portfolio & Index performance for October, 2023.

Companies on the Radar

Stocks on my RadarAfter two weeks without an American company on my Radar List, I found one this week – Toll Brothers Inc. (NYSE: TOL). They are a mid cap American company (a market capitalization between $2 billion and $10 billion) that builds luxury homes across the US. It scored very high on my Radar Checklist, as you can see on the two tables below.

Toll Brothers joins the other five Canadian companies currently on the list:

  • Gibson Energy (TSE: GEI), a small-cap Canadian company specializing in providing liquid infrastructure products and services to the North American energy sector.
  • TFI International Inc. (TSE: TFII), a mid-sized Canadian transportation and logistics company operating across North America.
  • Dollarama (TSE: DOL), a large Canadian company that operates dollar stores across Canada.
  • MTY Food Group Inc. (TSE: MTY), a small cap Canadian consumer cyclical company that operates and franchises quick service and casual dining restaurants throughout North America and internationally.
  • TerraVest Industries (TSE: TVK), a small-cap Canadian company that manufactures and sells goods and services to energy, agriculture, mining, and transportation sectors across North America. NOTE: because TerraVest is small cap Canadian company (small caps have a market capitalization in the range of $300 million to $3 billion), it is not followed by any analysts. Therefore, there is no twelve-month price target for this company’s share price.

The Radar Check was last updated November 3, 2023.

Stock on the Radar List. 1 of 2.

Stock on the Radar List. 2 of 2.


Portfolio Update

Portfolio 1

Portfolio 1 for the week ended November 3, 2023: UP Green Up Arrow, signifying a positive week

  • General Motors (NYSE: GM) and the United Auto Workers (UAW) reached an agreement on a new four-year contract. The deal brings an end to the six-week strike with GM employees receiving the same wages and benefits as Ford (NYSE: F) and Stellantis (NYSE: STLA).
  • Tesla came away with a victory in the first lawsuit claiming its Autopilot driver assistant system caused the death of the driver. Tesla claimed the accident was the result of driver error and not the result of a defect in the car. The jury sided with Tesla. This is the first of several similar lawsuits against the company.
  • The US Federal Trade Commission (FTC) filed a lawsuit against Amazon claiming the company used a secret algorithm to push up prices. The FTC claims the algorithm cost US consumers over US$ 1 billion. Amazon claims the pricing algorithm was created to see how closely other online retailers tracked Amazon’s prices. Amazon dropped the practise in 2010.
  • Celsius Holdings (NASD: CELH) announced a 3 for 1 stock split, effective November 13. The split was done to make shares “more accessible to a broader base of investors and to improve the overall trading volume.”
  • Apple’s share price fell after warning that their fourth quarter revenues were likely to come in below expectations, despite the fourth quarter traditionally being Apple’s best quarter. Apple said there currently is weak demand for iPads and other wearables.

Activity

No significant activity to report this week.

Dividends

Dividends Received this week for the following companies:

Companies followed by DRIP (Dividend Re-Investment Plan) indicate additional shares were purchased with the dividend. Any cash leftover was added to the cash balance.

Canadian $

Toronto-Dominion Bank (TSE: TD) DRIP

US $

No US$ dividends this past week.

Quarterly Reports

TMX Group Limited

All currency listed in millions of Canadian dollars, except for per share data.

Selected highlights from their third quarter 2023 financial results on October 31, 2023

  • Revenue of $287.3 for the three months ended September 30, compared to $266.8 for the same period in 2022. An increase of almost 8%.
  • Net income of $85.3 for the three months ended September 30, compared to net income of $81.0 in the same period in 2022.
  • Diluted earnings per ordinary share of $0.31 for the three months ended September 30, compared to earnings of $0.29 per share for the same period in 2022.


  • Revenue of $892.6 for the nine months ended September 30, compared to $839.2 for the same period in 2022. An increase of over 6%.
  • Net earnings of $271.6 for the nine months ended September 30, compared to net earnings of $440.5 in the same period in 2022.
  • Diluted earnings per ordinary share of $0.98 for the nine months ended September 30, compared to earnings of $1.57 per share for the same period in 2022.

Cameco Corporation

All currency listed in thousands of Canadian dollars, except for per share data.

Selected highlights from their third quarter 2023 financial results on October 31, 2023

  • Revenue of $575,079 for the three months ended September 30, compared to $388,659 for the same period in 2022. An increase of almost 48%.
  • Net income of $148,067 for the three months ended September 30, compared to a net loss of $19,534 in the same period in 2022.
  • Diluted earnings per ordinary share of $0.34 for the three months ended September 30, compared to a loss of $0.05 per share for the same period in 2022.


  • Revenue of $1,744,041 for the nine months ended September 30, compared to $1,344,274 for the same period in 2022. An increase of almost 30%.
  • Net earnings of $280,723 for the nine months ended September 30, compared to net earnings of $104,687 in the same period in 2022.
  • Diluted earnings per ordinary share of $0.65 for the nine months ended September 30, compared to earnings of $0.26 per share for the same period in 2022.

Lattice Semiconductor Corporation

All currency listed in thousands of US dollars, except for per share data.

Selected highlights from their third quarter 2023 financial results on October 30, 2023

  • Revenue of $192,169 for the three months ended September 30, compared to $172,509 for the same period in 2022. An increase of almost 11%.
  • Net income of $53,788 for the three months ended September 30, compared to net income of $46,359 in the same period in 2022.
  • Diluted earnings per ordinary share of $0.38 for the three months ended September 30, compared to earnings of $0.33 per share for the same period in 2022.


  • Revenue of $566,558 for the nine months ended September 30, compared to $484,396 for the same period in 2022. An increase of almost 17%.
  • Net earnings of $160,355 for the nine months ended September 30, compared to net earnings of $126,969 in the same period in 2022.
  • Diluted earnings per ordinary share of $1.15 for the nine months ended September 30, compared to earnings of $0.90 per share for the same period in 2022.

Pinterest, Inc.

All currency listed in thousands of US dollars, except for per share data.

Selected highlights from their third quarter 2023 financial results on October 30, 2023

  • Revenue of $763,203 for the three months ended September 30, compared to $684,550 for the same period in 2022. An increase of over 11%.
  • Net income of $6,733 for the three months ended September 30, compared to a net loss of $65,181 in the same period in 2022.
  • Diluted earnings per ordinary share of $0.01 for the three months ended September 30, compared to a loss of $0.10 per share for the same period in 2022.


  • Revenue of $2,073,809 for the nine months ended September 30, compared to $1,925,365 for the same period in 2022. An increase of almost 8%.
  • Net loss of $236,788 for the nine months ended September 30, compared to a net loss of $113,538 in the same period in 2022.
  • Diluted loss per ordinary share of $0.35 for the nine months ended September 30, compared to a loss of $0.17 per share for the same period in 2022.

PayPal Holdings, Inc.

All currency listed in millions of US dollars, except for per share data.

Selected highlights from their third quarter 2023 financial results on November 1, 2023

  • Revenue of $7,418 for the three months ended September 30, compared to $6,846 for the same period in 2022. An increase of over 8%.
  • Net income of $1,020 for the three months ended September 30, compared to net income of $1,330 in the same period in 2022.
  • Diluted earnings per ordinary share of $0.93 for the three months ended September 30, compared to earnings of $1.15 per share for the same period in 2022.


  • Revenue of $21,745 for the nine months ended September 30, compared to $20,135 for the same period in 2022. An increase of almost 8%.
  • Net earnings of $2,844 for the nine months ended September 30, compared to net earnings of $1,498 in the same period in 2022.
  • Diluted earnings per ordinary share of $2.55 for the nine months ended September 30, compared to earnings of $1.29 per share for the same period in 2022.

Roku, Inc.

All currency listed in thousands of US dollars, except for per share data.

Selected highlights from their third quarter 2023 financial results on November 1, 2023

  • Revenue of $912,018 for the three months ended September 30, compared to $761,373 for the same period in 2022. An increase of almost 20%.
  • Net loss of $330,071 for the three months ended September 30, compared to a net loss of $122,183 in the same period in 2022.
  • Diluted loss per ordinary share of $2.33 for the three months ended September 30, compared to a loss of $0.88 per share for the same period in 2022.


  • Revenue of $2,500,194 for the nine months ended September 30, compared to $2,259,478 for the same period in 2022. An increase of over 73%.
  • Net loss of $631,270 for the nine months ended September 30, compared to net earnings of $260,810 in the same period in 2022.
  • Diluted loss per ordinary share of $4.47 for the nine months ended September 30, compared to a loss of $1.90 per share for the same period in 2022.

Innovative Industrial Properties, Inc.

All currency listed in thousands of US dollars, except for per share data.

Selected highlights from their third quarter 2023 financial results on November 1, 2023

  • Revenue of $77,826 for the three months ended September 30, compared to $70,883 for the same period in 2022. An increase of almost 10%.
  • Net income of $41,256 for the three months ended September 30, compared to net income of $37,278 in the same period in 2022.
  • Diluted earnings per ordinary share of $1.45 for the three months ended September 30, compared to earnings of $1.32 per share for the same period in 2022.


  • Revenue of $230,350 for the nine months ended September 30, compared to $205,898 for the same period in 2022. An increase of almost 12%.
  • Net earnings of $122,941 for the nine months ended September 30, compared to net earnings of $111,866 in the same period in 2022.
  • Diluted earnings per ordinary share of $4.32 for the nine months ended September 30, compared to earnings of $4.06 per share for the same period in 2022.

BCE Inc.

All currency listed in millions of Canadian dollars, except for per share data.

Selected highlights from their third quarter 2023 financial results on November 2, 2023

  • Revenue of $6,080 for the three months ended September 30, compared to $6,024 for the same period in 2022. An increase of almost 3%.
  • Net income of $707 for the three months ended September 30, compared to net income of $771 in the same period in 2022.
  • Diluted earnings per ordinary share of $0.70 for the three months ended September 30, compared to earnings of $0.78 per share for the same period in 2022.


  • Revenue of $18,200 for the nine months ended September 30, compared to $17,735 for the same period in 2022. An increase of over 73%.
  • Net earnings of $1,892 for the nine months ended September 30, compared to net earnings of $2,359 in the same period in 2022.
  • Diluted earnings per ordinary share of $1.86 for the nine months ended September 30, compared to earnings of $2.40 per share for the same period in 2022.

Skyworks Solutions, Inc.

All currency listed in millions of US dollars, except for per share data.

Selected highlights from their fourth quarter 2023 financial results on November 2, 2023

  • Revenue of $1,218.8 for the three months ended September 30, compared to $1,407.0 for the same period in 2022. A decrease of over 13%.
  • Net income of $244.8 for the three months ended September 30, compared to net income of $302.2 in the same period in 2022.
  • Diluted earnings per ordinary share of $1.52 for the three months ended September 30, compared to earnings of $1.88 per share for the same period in 2022.


  • Revenue of $4,772.4 for the twelve months ended September 30, compared to $5,485.5 for the same period in 2022. A decrease of almost 13%.
  • Net earnings of $982.8 for the twelve months ended September 30, compared to net earnings of $1,278.2 in the same period in 2022.
  • Diluted earnings per ordinary share of $6.13 for the twelve months ended September 30, compared to earnings of $7.81 per share for the same period in 2022.

Cloudflare, Inc.

All currency listed in thousands of US dollars, except for per share data.

Selected highlights from their third quarter 2023 financial results on November 2, 2023

  • Revenue of $335,603 for the three months ended September 30, compared to $253,857 for the same period in 2022. An increase of over 32%.
  • Net loss of $23,535 for the three months ended September 30, compared to a net loss of $42,546 in the same period in 2022.
  • Diluted loss per ordinary share of $0.07 for the three months ended September 30, compared to a loss of $0.13 per share for the same period in 2022.


  • Revenue of $934,272 for the nine months ended September 30, compared to $700,541 for the same period in 2022. An increase of over 73%.
  • Net loss of $156,084 for the nine months ended September 30, compared to a net loss of $147,464 in the same period in 2022.
  • Diluted loss per ordinary share of $0.47 for the nine months ended September 30, compared to a loss of $0.45 per share for the same period in 2022.

Trisura Group Ltd.

All currency listed in thousands of Canadian dollars, except for per share data.

Selected highlights from their third quarter 2023 financial results on November 2, 2023

  • Revenue of $730,714 for the three months ended September 30, compared to $550,861 for the same period in 2022. An increase of almost 33%.
  • Net income of $14,838 for the three months ended September 30, compared to net income of $24,224 in the same period in 2022.
  • Diluted earnings per ordinary share of $0.31 for the three months ended September 30, compared to earnings of $0.53 per share for the same period in 2022.


  • Revenue of $2,034,234 for the nine months ended September 30, compared to $1,419,173 for the same period in 2022. An increase of over 43%.
  • Net earnings of $55,621 for the nine months ended September 30, compared to net earnings of $68,505 in the same period in 2022.
  • Diluted earnings per ordinary share of $1.18 for the nine months ended September 30, compared to earnings of $1.58 per share for the same period in 2022.

Lightspeed Commerce Inc.

All currency listed in thousands of US dollars, except for per share data.

Selected highlights from their second quarter 2023 financial results on November 2, 2023

  • Revenue of $230,273 for the three months ended September 30, compared to $183,699 for the same period in 2022. An increase of over 25%.
  • Net loss of $42,492 for the three months ended September 30, compared to a net loss of $79,943 in the same period in 2022.
  • Diluted loss per ordinary share of $0.28 for the three months ended September 30, compared to a loss of $0.53 per share for the same period in 2022.


  • Revenue of $439,359 for the nine months ended September 30, compared to $357,581 for the same period in 2022. An increase of almost 23%.
  • Net earnings of $91,195 for the nine months ended September 30, compared to a net loss of $180,739 in the same period in 2022.
  • Diluted loss per ordinary share of $0.60 for the nine months ended September 30, compared to a loss of $1.21 per share for the same period in 2022.

Andlauer Healthcare Group Inc.

All currency listed in thousands of Canadian dollars, except for per share data.

Selected highlights from their third quarter 2023 financial results on November 2, 2023

  • Revenue of $156,754 for the three months ended September 30, compared to $164,898 for the same period in 2022. A decrease of almost 5%.
  • Net income of $15,335 for the three months ended September 30, compared to net income of $18,995 in the same period in 2022.
  • Diluted earnings per ordinary share of $0.36 for the three months ended September 30, compared to earnings of $0.44 per share for the same period in 2022.


  • Revenue of $478,885 for the nine months ended September 30, compared to $482,651 for the same period in 2022. A decrease of almost 1%.
  • Net earnings of $47,579 for the nine months ended September 30, compared to net earnings of $56,451 in the same period in 2022.
  • Diluted earnings per ordinary share of $1.11 for the nine months ended September 30, compared to earnings of $1.32 per share for the same period in 2022.

Apple Inc.

All currency listed in millions of US dollars, except for per share data.

Selected highlights from their fourth quarter 2023 financial results on November 2, 2023

  • Revenue of $89,498 for the three months ended September 30, compared to $90,146 for the same period in 2022. A decrease of almost 1%.
  • Net income of $22,956 for the three months ended September 30, compared to net income of $20,721 in the same period in 2022.
  • Diluted earnings per ordinary share of $1.46 for the three months ended September 30, compared to earnings of $1.29 per share for the same period in 2022.


  • Revenue of $383,285 for the twelve months ended September 30, compared to $394,328 for the same period in 2022. A decrease of almost 3%.
  • Net earnings of $96,995 for the twelve months ended September 30, compared to net earnings of $99,803 in the same period in 2022.
  • Diluted earnings per ordinary share of $6.13 for the twelve months ended September 30, compared to earnings of $6.11 per share for the same period in 2022.

fuboTV Inc.

All currency listed in thousands of US dollars, except for per share data.

Selected highlights from their third quarter 2023 financial results on November 3, 2023

  • Revenue of $320,935 for the three months ended September 30, compared to $224,989 for the same period in 2022. An increase of almost 43%.
  • Net loss of $83,816 for the three months ended September 30, compared to a net loss of $152,746 in the same period in 2022.
  • Diluted loss per ordinary share of $0.29 for the three months ended September 30, compared to a loss of $0.82 per share for the same period in 2022.


  • Revenue of $958,044 for the nine months ended September 30, compared to $689,381 for the same period in 2022. An increase of almost 40%.
  • Net loss of $217,364 for the nine months ended September 30, compared to a net loss of $409,496 in the same period in 2022.
  • Diluted loss per ordinary share of $0.80 for the nine months ended September 30, compared to a loss of $2.32 per share for the same period in 2022.

Telus Corporation

All currency listed in millions of Canadian dollars, except for per share data.

Selected highlights from their third quarter 2023 financial results on November 3, 2023

  • Revenue of $5,008 for the three months ended September 30, compared to $4,671 for the same period in 2022. An increase of over 7%.
  • Net income of $137 for the three months ended September 30, compared to net income of $551 in the same period in 2022.
  • Diluted earnings per ordinary share of $0.09 for the three months ended September 30, compared to earnings of $0.37 per share for the same period in 2022.


  • Revenue of $14,918 for the nine months ended September 30, compared to $13,354 for the same period in 2022. An increase of almost 12%.
  • Net earnings of $557 for the nine months ended September 30, compared to net earnings of $1,453 in the same period in 2022.
  • Diluted earnings per ordinary share of $0.38 for the nine months ended September 30, compared to earnings of $0.99 per share for the same period in 2022.

Portfolio 2

Portfolio 2 for the week ended November 3, 2023: UP Green Up Arrow, signifying a positive week

  • Guardant Health (NASD: GH) announced that initial results from the early-stage trials “suggest liquid biopsy may be used in post-surgical clinical management to reduce unnecessary toxicity from chemotherapy and improve the response to standard chemotherapy regimens in patients with stage III or high-risk stage II colon cancer.”
  • TC Energy (TSE: TRP) is considering selling its stakes in ANR pipeline, Portland Natural Gas Transmission, Millenium Pipeline and their Mexican operation to raise money to reduce their debt and fund new investments. The company has not decided whether it will divest some or all those assets. If it were to sell all of those assets it could bring in US$ 10 billion.
  • The Bank of Nova Scotia (TSE: BNS) sold its part of Canadian Tire’s (TSE: CTC.A) financial services unit back to Canadian Tire. The sale is to raise money in the event of increased default payments as the higher for longer interest rates begin to negatively impact the Canadian economy and consumers.

Activity

No significant activity to report this week.

Dividends

Dividends Received this week for the following companies:

Companies followed by DRIP (Dividend Re-Investment Plan) indicate additional shares were purchased with the dividend. Any cash leftover was added to the cash balance.

Canadian $

TC Energy Corp (TSE: TRP)

US $

No US$ dividends this past week.

Quarterly Reports

Hammond Power Solutions Inc.

All currency listed in thousands of Canadian dollars, except for per share data.

Selected highlights from their third quarter 2023 financial results on October 26, 2023

  • Revenue of $179,521 for the three months ended September 30, compared to $148,953 for the same period in 2022. An increase of over 20%.
  • Net income of $14,437 for the three months ended September 30, compared to net income of $11,531 in the same period in 2022.
  • Diluted earnings per ordinary share of $1.21 for the three months ended September 30, compared to earnings of $0.97 per share for the same period in 2022.


  • Revenue of $523,106 for the nine months ended September 30, compared to $414,211 for the same period in 2022. An increase of over 26%.
  • Net earnings of $43,496 for the nine months ended September 30, compared to net earnings of $26,605 in the same period in 2022.
  • Diluted earnings per ordinary share of $3.65 for the nine months ended September 30, compared to earnings of $2.25 per share for the same period in 2022.

Airbnb, Inc.

All currency listed in millions of US dollars, except for per share data.

Selected highlights from their third quarter 2023 financial results on November 1, 2023

  • Revenue of $3,397 for the three months ended September 30, compared to $2,884 for the same period in 2022. An increase of almost 18%.
  • Net income of $4,374 for the three months ended September 30, compared to net income of $1,214 in the same period in 2022.
  • Diluted earnings per ordinary share of $6.63 for the three months ended September 30, compared to earnings of $1.79 per share for the same period in 2022.


  • Revenue of $7,699 for the nine months ended September 30, compared to $6,497 for the same period in 2022. An increase of over 18%.
  • Net earnings of $5,141 for the nine months ended September 30, compared to net earnings of $1,574 in the same period in 2022.
  • Diluted earnings per ordinary share of $7.74 for the nine months ended September 30, compared to earnings of $2.31 per share for the same period in 2022.

Canadian Natural Resources Limited

All currency listed in thousands of US dollars, except for per share data.

Selected highlights from their third quarter 2023 financial results on November 1, 2023

  • Revenue of $9,895 for the three months ended September 30, compared to $10,457 for the same period in 2022. A decrease of over 5%.
  • Net income of $2,344 for the three months ended September 30, compared to net income of $2,814 in the same period in 2022.
  • Diluted earnings per ordinary share of $2.13 for the three months ended September 30, compared to earnings of $2.49 per share for the same period in 2022.


  • Revenue of $26,415 for the nine months ended September 30, compared to $32,609 for the same period in 2022. A decrease of almost 19%.
  • Net earnings of $5,606 for the nine months ended September 30, compared to net earnings of $9,417 in the same period in 2022.
  • Diluted earnings per ordinary share of $5.07 for the nine months ended September 30, compared to earnings of $8.12 per share for the same period in 2022.

Brookfield Renewable Partners L.P.

All currency listed in millions of US dollars, except for per share data.

Selected highlights from their third quarter 2023 financial results on November 3, 2023

  • Revenue of $1,179 for the three months ended September 30, compared to $1,105 for the same period in 2022. An increase of almost 7%.
  • Net loss of $64 for the three months ended September 30, compared to a net loss of $136 in the same period in 2022.
  • Diluted loss per ordinary share of $0.14 for the three months ended September 30, compared to a loss of $0.25 per share for the same period in 2022.


  • Revenue of $3,715 for the nine months ended September 30, compared to $3,515 for the same period in 2022. An increase of almost 6%.
  • Net loss of $135 for the nine months ended September 30, compared to a net loss of $213 in the same period in 2022.
  • Diluted loss per ordinary share of $0.34 for the nine months ended September 30, compared to a loss of $0.44 per share for the same period in 2022.

Telus Corporation

See report under Portfolio 2.

Portfolio 3

Portfolio 3 for the week ended November 3, 2023: UP Green Up Arrow, signifying a positive week

  • Brookfield Asset Management (TSE: BAM) raised its offer for Australia’s Origin Energy to around US$10.50 billion. The BAM led consortium hopes its revised offer will be enough to get Origin shareholders to accept their offer for the Australian Energy producer and retailer.
  • Shopify’ share price soared over 21% after the company posted a profit for the third quarter and easily surpassed analysts’ earnings per share expectations. The company was able to lower expenses while benefitting from their rollout of AI powered tools to help their customers optimize their online stores.

Activity

No significant activity to report this week.

Dividends

Dividends Received this week for the following companies:

Companies followed by DRIP (Dividend Re-Investment Plan) indicate additional shares were purchased with the dividend. Any cash leftover was added to the cash balance.

Canadian $

Toronto-Dominion Bank (TSE: TD)

US $

No US$ dividends this past week.

Quarterly Reports

Shopify Inc.

All currency listed in millions of US dollars, except for per share data.

Selected highlights from their third quarter 2023 financial results on November 2, 2023

  • Revenue of $1,714 for the three months ended September 30, compared to $1,366 for the same period in 2022. An increase of over 25%.
  • Net income of $718 for the three months ended September 30, compared to a net loss of $188 in the same period in 2022.
  • Diluted earnings per ordinary share of $0.55 for the three months ended September 30, compared to a loss of $0.12 per share for the same period in 2022.


  • Revenue of $4,916 for the nine months ended September 30, compared to $3,865 for the same period in 2022. An increase of over 27%.
  • Net loss of $515 for the nine months ended September 30, compared to a net loss of $2,869 in the same period in 2022.
  • Diluted loss per ordinary share of $0.41 for the nine months ended September 30, compared to a loss of $2.24 per share for the same period in 2022.

Cloudflare, Inc.

See report under Portfolio 1.

Brookfield Renewable Partners L.P.

See report under Portfolio 2.

Telus International Inc.

All currency listed in millions of US dollars, except for per share data.

Selected highlights from their third quarter 2023 financial results on November 3, 2023

  • Revenue of $663 for the three months ended September 30, compared to $615 for the same period in 2022. An increase of almost 8%.
  • Net income of $9 for the three months ended September 30, compared to net income of $59 in the same period in 2022.
  • Diluted earnings per ordinary share of $0.03 for the three months ended September 30, compared to earnings of $0.22 per share for the same period in 2022.


  • Revenue of $2,016 for the nine months ended September 30, compared to $1,838 for the same period in 2022. An increase of almost 10%.
  • Net earnings of $16 for the nine months ended September 30, compared to net earnings of $149 in the same period in 2022.
  • Diluted earnings per ordinary share of $.06 for the nine months ended September 30, compared to earnings of $0.55 per share for the same period in 2022.


Weekly Update for the week ending October 27, 2023

Items that may only interest or educate me ….

Canadian Economic news, US Economic news, Canadian deficit increases, …

Canadian Economic news

This past week’s key economic data that the Bank of Canada (BoC) considers when deciding whether to raise or lower the interest rate.

Interest rates remain at 5%

As anticipated, the BoC opted to maintain the interest rates at 5.0%, stating the previous increases have started to slow the economy. The BoC emphasized that another rate hike is still possible if inflation does not continue to fall towards its 2% target. However, many analysts believe the central bank is finished with rate hikes, allowing the effects of the previous hikes to continue to work their way through the economy.

After raising the benchmark rate 10 times since March 2022, the BoC has kept it at 5% for the past two meetings. Currently, the cost of living, as measured by the Consumer Price Index (CPI), stands at 3.8%. Other than a brief spike in CPI in August, the inflation rate has continued to fall since a high of 8.1% in June 2022, as shown in the Statistics Canada chart below. The BoC expects inflation to stay around 3.5% until next summer, and then drop to 2.5% by late 2024.

Statistics Canada graph tracking Canada's CPI for the last 5 years.
Statistics Canada graph tracking Canada’s CPI for the last 5 years.

The BoC noted the slowing demand for housing, goods, and services, as well as a reduction in business investment. These are all good reasons for the bank to keep its benchmark rate on hold. They also said that supply and demand are almost in balance, but they still want to see core inflation (CPI without the volatile food and gas prices) continue to fall.

Among the risks to falling inflation are war in the Mid East that could lead to the higher oil prices, and weather events that could impact food supplies and disrupt supply chains. As well, continued wage growth and sticky core inflation that remains close to 4% are also obstacles to inflation returning to the 2% target.

The BoC was in a difficult position. If they lower the key rate, inflation could accelerate. If they raise the rate, they could trigger financial hardships for consumers and businesses.

With minimal economic growth, sluggish retail sales, and rising unemployment, the BoC opted to maintain the current rate of 5%, while warning about the possibility of an additional rate hike.

Analysts suggest that Canada could be on the brink of a recession or stagflation due to the lagged impact of the aggressive rate increases. Stagflation is a mix of stagnating, or slow, growth and heightened inflation, a toxic combination for the economy.

My takeaway: do not expect lower interest rates any time soon, even with a slowing economy. ☹

Canadian market volatility

The Canadian Volatility Index (VIXC), as measured by the TSX 60 VIXI, ended the week at 18.14, up from last week’s reading of 17.09. Market volatility in the Canadian stock market increased slightly but remains below 20. A Canadian VIX reading above 20 is considered high, while a Canadian VIX reading below 20 is considered to be low.

US Economic news

This past week’s key economic data points that the Federal Reserve (Fed) considers when deciding whether to raise or lower the interest rate.

Personal Consumption Expenditures

The Commerce Department announced September’s Personal Consumption Expenditures (PCE) price index. The PCE measures the cost of goods and services and is closely watched by economists and investors because it is a broad measure of inflation that includes both goods and services, and it is less volatile than other measures of inflation, such as the Consumer Price Index (CPI). However, the Fed prefers the core PCE price index, which excludes the volatile food and energy components, because it is a better indicator of underlying inflation trends.

In September, the PCE increased by 0.4%, following a similar rise in August. Year over year, the PCE showed a 3.4% increase, slightly down from the previous month’s 3.5%. Analysts had anticipated gains of 0.3% and 3.4%, respectively. The rise in the PCE was driven by increased spending on goods, particularly new and used vehicles, and services, with consumers investing more in international travel.

Core PCE accelerated to a 0.3% gain, after a 0.1% increase in August. In the 12 months through September, the core PCE slowed to a 3.7% rate of growth, after a 3.9% rise in August. Both the monthly and yearly core PCE estimates were in line with analysts’ estimate. Being the Fed’s preferred measure of inflation, it is closely tracked as they prepare for next week’s meeting to update the monetary policy (which decides the interest rate).

The monthly readings showed the cost of living had increased, however, the annual readings showed inflation continues to trend downward. This is good news for consumers as it indicates their purchasing power is not falling as quickly as it has been. It is also good news for us investors as the Fed will take note of the downward trend as they head into next week’s monetary policy meeting.

Hopefully, the Fed will decide to leave the benchmark rate at 5.5% and let the higher rate continue to trickle down through the economy. However, the Fed’s decision is not based on the PCE data alone. Other economic data has shown the US economy, as measured by Gross Domestic Product (GDP), and employment both remain strong, and inflation is still well above the Fed’s 2% target rate.

Gross Domestic Product

The Commerce Department’s advance estimate for the third quarter GDP increased more than expected at an annual rate of 4.9%. Analysts had expected an increase of 4.3%. An advance estimate is based on “source data that are incomplete or subject to further revision by the source agency”, and a more accurate, or second, estimate will be provided in late November.

This is the fastest pace of growth since the first quarter of 2022. The growth was driven by strong consumer spending, business investment, and government spending.

The Fed expects spending to slow in the fourth quarter given the ongoing United Auto Workers’ strike, the war in the Middle East, and another possible government shutdown in November.

Consumer Sentiment Index

The University of Michigan’s Consumer Sentiment Index (CSI) final results for October dropped slightly to 63.8 at the end of October, following a reading of 67.9 in September. It was a drop of 6.0% after being relatively stable for the previous two months. Year over year, the CSI increased by 6.5% from 59.9 in October 2022.

The monthly drop was a result of concerns over higher inflation and what was happening in the US and globally. However, the consumer sentiment is still significantly higher than it was a year ago.

American market volatility

During the week, the CBOE Volatility Index (VIX) reached 21.27, down from 21.71 last week. The lower reading suggests a decrease in the perceived volatility of the American markets.

Canada’s deficit increases

The Canadian government announced a $4.3 billion budget deficit for the first five months of the 2023/2024 fiscal year. The government’s revenue increased by 1.4% since April due to higher interest revenues and other non-tax revenues. However, the government’s program expenses increased by 4.8% during the same period. The primary reasons for the increased expenses include higher spending on climate change initiatives and on social programs, such as healthcare and education.

As a result of the deficit, Canada’s public debt charges have grown by $4.1 billion, or 27.7%, due to rising interest rates.

While the deficit is smaller than expected, its implications are significant, particularly in the long term. The government will likely continue borrowing to maintain operations, leading to a higher national debt. To address this mounting debt, it may necessitate either tax hikes or cut spending cuts; based on the last few years, the former has been this government’s preferred option. However, this increased debt could potentially harm the Canadian economy, reducing economic growth and pushing up interest rates.

Fortunately, the Canadian economy is relatively strong, and the deficit is not expected to have a significant negative impact on the economy.


It was not a great week in the North American stock markets. Let’s see what caused the markets to fall this past week….

Weekly Market Review

Monday: It was a mixed day to open the week. The Nasdaq Composite Index (Nasdaq) was the only index to end the day higher, while the Toronto Stock Exchange Composite Index (TSX), the S&P 500 Index (S&P), the Dow Jones Industrial Average (DJIA) all ended slightly lower. Investors are waiting for a few key economic reports that come out later this week to get a sense whether the Fed will hold the line or increase their benchmark rates.

In Canada, a drop in oil and other commodity prices led to sell off in resource-based companies as investors took profits after a run up in share prices last week. Later this week the BoC will announce its latest update on the benchmark rate. In trading, the defensive sectors Utilities, Telecommunications Services and Consumer Staples were the only ones to end higher. Basic Materials (miners and fertilizer manufacturers) and Healthcare had the biggest declines.

In the US, government bond yields briefly touched 5% before falling off as investors wait for third quarter reports from some of the big-name companies this week. Nearly a third of companies in the S&P report this week. The S&P closed at its lowest point since the end of May, and the DJIA notched its fourth straight day of losses. In trading, Nasdaq mainstays Technology and Consumer Cyclicals were the only two sectors to end higher, while Energy and Basic Materials had the biggest declines.

Tuesday: a mostly upbeat day in the markets with all three American indexes ending in the green as investors await the latest earnings reports from a few of the big technology companies. The TSX was the only major North American index to end in the red today. Oil prices fell after weak economic data out of Europe led to concerns of lower demand.

In Canada, the TSX fell to its lowest point in a year as oil and other commodity prices continued to pullback after last week’s surge. Tomorrow, the BoC will announce its latest decision on Canada’s benchmark interest rate. Many analysts expect the BoC to leave the rate at 5.0% but are concerned the Fed may raise its rate. A mixed day in the Canadian sectors with half the sectors in the green, led by Technology and Telecommunications Services, and the other half in the red, with Energy and Industrials the biggest losers.

In the US, investor optimism about third quarter earnings led to a surge in the interest rate sensitive mega cap technology companies, pushing the Nasdaq and S&P firmly higher. The DJIA was also lifted by a broad-based rally in the American stock markets. In trading, Telecommunications Services and Utilities posted the biggest gains while Energy was the only sector to end the day lower.

Wednesday: all four indexes ended lower, with the Nasdaq getting hammered after a disappointing quarterly report from Alphabet (NASD: GOOGL). Higher for longer interest rates and disappointing earnings is not a good combination. Investors had been clinging to the hope that the big technology companies would all have strong earnings so when Alphabet faltered the rest of the technology sector got hammered. Elsewhere, China announced new fiscal stimulus measures to boost their economic recovery.

In Canada, the BoC announced they were leaving the benchmark rate at 5%, but left the door open for additional increases if necessary. The bank also forecast slow growth for the economy. As for the TSX, the good news was it was the best performing index for the day. The bad news, the TSX ran its losing streak to six. The TSX is ended the day at its lowest level since October 2021. In trading, Energy and Utilities posted the biggest gains, while Technology and Healthcare had the biggest losses.

In the US, fears of higher for longer interest rates slammed many of the technology companies, pushing the Nasdaq into a market correction, having fallen more than 10% since its high made on July 19. Higher yields on safe government bonds also put pressure on the riskier stocks, especially those in the interest sensitive sectors like technology and consumer cyclicals. In trading, Utilities, Consumer Staples, and Energy were the only American sectors to end in the green. Of the sectors to end in the red, Technology and Consumer Cyclicals ended the deepest in the red.

Thursday: another bleak day in the markets with all four indexes ending lower. Disappointing quarterly reports from many of the big names in technology, and bond yields that continue to rise took their toll on the markets. Oil companies gave back recent gains as oil prices continued to drop.

In Canada, once again the TSX was the best of a bad lot but that was not enough to prevent it from stretching its losing streak to seven, its longest losing streak in five years. Many investors are moving from the higher risk, growth stocks into more defensive sectors or government bonds. In trading, Utilities and Financials recorded the biggest gains, while Technology and Industrials had the biggest drops.

In the US, GDP came in higher than expected suggesting American consumers continue to spend. While this is good news on the surface, it does not help with the Fed’s fight to lower inflation. They want to see a slowing economy and lower spending before they start lowering the interest rate. Given the ‘bad’ news, many investors are rotating out of interest sensitive stocks, such as technology companies, and into low-risk government bonds. In trading, Financials and Utilities posted the biggest gains, while the interest sensitive Technology and Consumer Cyclicals sectors had the biggest losses.

Friday: after two consecutive days with all four indexes ending lower, today was a marginal improvement as the Nasdaq finished in the green. Oil prices rose on increased investor concerns after the US military struck Iranian targets in Syria. Investors now turn their attention to the Fed and next week’s interest rate announcement.

In Canada, the TSX continues its downward trend as oil prices continue to fall. It was a day of broad-based losses in the Canadian sectors. Basic Materials was the only sector to end higher, while Consumer Cyclicals and Financials suffered the biggest losses.

In the US, early morning rallies in the Nasdaq and S&P fizzled in afternoon trading with the S&P joining the DJIA in the red, while the Nasdaq was able to remain in the green at the end of the day. The Nasdaq was buoyed by a better-than-expected report from Amazon (NASD: AMZN). The Fed’s favourite inflation metric came in higher than expected, putting downward pressure on the markets and increasing the likelihood of an increase to the interest rate. Mixed results from the big technology stocks also contributed to the fall. In trading on Wall Street, Consumer Cyclicals, Technology and Basic Materials were the only sectors to end in the green, while Telecommunications Services and Healthcare were the deepest in the red.


Weekly Market and Portfolio Review

For the week, the TSX (SPTSX) lost 2.0%, the S&P 500 (SPX) fell 2.5%, the DJIA (INDU) slipped 2.1% and the Nasdaq (CCMP) declined 2.6%.

Bearish marketAnother week with all four major indexes firmly in the red, as shown above. Actually, it has been only the last two weeks that all were in the red, it just feels like it has been longer. The Magnificent 7 which led the Nasdaq and S&P rallies in the first half of the year, are now dragging them down into market ‘correction’ territory, with both indexes down over 10% since their respective highs in July. If it was not for Amazon’s stellar earnings report this week, it would have been worst. The DJIA did not fair much better as it sank to its worst level in nearly five months and is in the red for the year to date. Canada’s TSX dropped to its lowest point all year, marking a drop of 3.5% since the start of the year.

So far, October has lived up to its reputation for volatility and this week was no better. This week’s falter was largely the result of a continuing surge in the yields of government bonds, geopolitical uncertainty, and mixed earnings reports, especially those from the Magnificent 7. With the majority of companies having reported, next week investors’ focus will be split between earnings, Apple in particular, and economic news. In the US, there will be the latest monetary policy (interest rate) update from the Fed, followed by the October jobs reports. From the GDP report mentioned earlier in this post, we know the US economy remains strong, but what about Canada? We will find out next week when the GDP data for August is released.

Bearish marketAs for the portfolios, all three dropped again this week. ☹ It is difficult to post a win when all four indexes are down at least 2%, as shown in the chart below. In Portfolio 1, an impressive quarterly report from Amazon was offset by a disappointing earnings report from Google’s parent Alphabet. While the portfolio was dragged down by the overall market decline, it still outperformed the Nasdaq and S&P. Portfolio 2’s losses were limited by an impressive earnings report from Microsoft. Finally, Portfolio 3 saw the gain from Microsoft wiped out by a loss of 10% in Shopify’s share price, causing the portfolio to be knocked lower by market headwinds.

Next week will be the end of October, and hopefully the volatility it brought with it. November is generally a good month for stocks. Mind you, if the Fed boosts the US interest rate it may be another depressing month. We will find out next week.

Weekly Portfolio & Index performance
Weekly Portfolio & Index performance for the week ended October 27, 2023.

Companies on the Radar

Stocks on my Radar I was hoping one or two new American companies would come across my radar to add to the five Canadian companies listed below. Unfortunately, none did so the Radar List remains:

  • Gibson Energy (TSE: GEI), a small-cap Canadian company specializing in providing liquid infrastructure products and services to the North American energy sector.
  • Dollarama (TSE: DOL), a large Canadian company that operates dollar stores across Canada.
  • MTY Food Group Inc. (TSE: MTY), a small cap Canadian consumer cyclical company that operates and franchises quick service and casual dining restaurants throughout North America and internationally.
  • TFI International Inc. (TSE: TFII), a mid-sized Canadian transportation and logistics company operating across North America.
  • TerraVest Industries (TSE: TVK), a small-cap Canadian company that manufactures and sells goods and services to energy, agriculture, mining, and transportation sectors across North America. NOTE: because TerraVest is small cap Canadian company (small caps have a market capitalization in the range of $300 million to $3 billion), it is not followed by any analysts. Therefore, there is no twelve-month price target for this company’s share price.

The Radar Check was last updated October 27, 2023.

Stock on the Radar List. 1 of 2.
Stock on the Radar List. 2 of 2.

Portfolio Update

Portfolio 1

Portfolio 1 for the week ended October 27, 2023: DOWN Red Down Arrow

  • Nvidia (NASD: NVDA) announced they will start building central processing units, commonly known as CPUs, to run Microsoft’s (NASD: MSFT) Windows operating system. The new CPUs from Nvidia would utilize some of Arm’s (NASD: ARM) technology. Nvidia is known for their Graphics processing Units (GPUs) which are used in artificial intelligence (AI), cloud data centres and gaming applications. Their entry into the CPU can not be good news for Intel (NASD: INTC) who have been the dominant CPU in the Windows environment for over 30 years.
  • General Motors (NYSE: GM) lowered their 2023 profit forecast due to the ongoing labour strike. GM said they will slow the production of electric vehicles (EV) to preserve their profit margins rather than sales targets.
    In related news from GM, as if to reinforce their plan to slow their production of EVs, GM scrapped plans to jointly build EVs with Honda Motor (NYSE: HMC). Rather than working with Honda on an ‘affordable’ EV, GM decided to focus on their existing Bolt EV line.
    In California, the Department of Motor Vehicles (DMV) suspended GM’s Cruise autonomous vehicles from operating without drivers because they deemed the vehicles unsafe for public roads. The DMV said Cruise had misrepresented the safety of the driverless car’s technology and pose an “unreasonable risk to the public.”
    As of this post, GM is the only one of the big three North American auto makers to not have a signed agreement with the United Auto Workers union. Ford (NYSE: F) and Stallantis (NYSE: STLA) have both settled, agreeing to a 25% wage increase over 4 ½ years, and other concessions.
  • It appears Apple (NASD: AAPL) has really bought into the ‘right to repair’ your own devices sentiment. Apple said it will make the parts, tools, and documentation necessary to repair its products available to consumers and third-party repair shops.
    Apple lost a patent dispute over a blood oxygen sensor used in its Apple Watch. The US International Trade Commission issued a temporary exclusion order on specific watches and banned them from import into the US. Apple has said they will appeal the decision.
    Separately, Apple plans to increase the price of subscriptions for Apple TV+ and Apple News+.
  • PayPal (NASD: PYPL) has agreed to sell their reverse logistics company Happy Returns to United Parcel Service (NYSE: UPS). Reverse logistics is the process of moving products back through companies’ supply chains when customers return purchases.
  • Amazon is creating a “European Sovereign Cloud”, for its European Amazon Web Services (AWS) customers. The unit will be separate from its regular AWS business and will keep data collected in Europe, in their European cloud.
    Separately, Amazon’s share price got a nice boost after its most profitable division, AWS, grew its cloud market share thanks to the expanding artificial intelligence market.

Activity

Received interest on TD 1-year cashable GIC.

Dividends

Dividends Received this week for the following companies:

Companies followed by DRIP (Dividend Re-Investment Plan) indicate additional shares were purchased with the dividend. Any cash leftover was added to the cash balance.

Canadian $

BCE Inc (TSX: BCE) DRIP

US $

No US$ dividends this past week.

Quarterly Reports

Visa Inc.

All currency listed in millions of US dollars, except for per share data.

Selected highlights from their fourth quarter 2023 financial results on October 24, 2023

  • Revenue of $8,609 for the three months ended September 30, compared to $7,787 for the same period in 2022. An increase of almost 11%.
  • Net income of $4,681 for the three months ended September 30, compared to net income of $3,940 in the same period in 2022.
  • Diluted earnings per ordinary share of $2.27 for the three months ended September 30, compared to earnings of $1.86 per share for the same period in 2022.


  • Revenue of $32,653 for the twelve months ended September 30, compared to $29,310 for the same period in 2022. An increase of over 11%.
  • Net earnings of $17,273 for the twelve months ended September 30, compared to net earnings of $14,957 in the same period in 2022.
  • Diluted earnings per ordinary share of $8.28 for the twelve months ended September 30, compared to earnings of $7.00 per share for the same period in 2022.

Alphabet Inc.

All currency listed in millions of US dollars, except for per share data.

Selected highlights from their third quarter 2023 financial results on October 24, 2023

  • Revenue of $76,693 for the three months ended September 30, compared to $69,092 for the same period in 2022. An increase of over 11%.
  • Net income of $19,689 for the three months ended September 30, compared to net income of $13,910 in the same period in 2022.
  • Diluted earnings per ordinary share of $1.55 for the three months ended September 30, compared to earnings of $1.06 per share for the same period in 2022.


  • Revenue of $221,084 for the nine months ended September 30, compared to $206,788 for the same period in 2022. An increase of almost 7%.
  • Net earnings of $53,108 for the nine months ended September 30, compared to net earnings of $46,348 in the same period in 2022.
  • Diluted earnings per ordinary share of $3.50 for the nine months ended September 30, compared to earnings of $4.16 per share for the same period in 2022.

General Motors Co.

All currency listed in millions of US dollars, except for per share data.

Selected highlights from their third quarter 2023 financial results on October 24, 2023

  • Revenue of $44,131 for the three months ended September 30, compared to $41,889 for the same period in 2022. An increase of over 5%.
  • Net income of $3,064 for the three months ended September 30, compared to net income of $3,305 in the same period in 2022.
  • Diluted earnings per ordinary share of $2.20 for the three months ended September 30, compared to earnings of $2.25 per share for the same period in 2022.


  • Revenue of $128,863 for the nine months ended September 30, compared to $113,627 for the same period in 2022. An increase of over 13%.
  • Net earnings of $8,026 for the nine months ended September 30, compared to net earnings of $7,935 in the same period in 2022.
  • Diluted earnings per ordinary share of $5.72 for the nine months ended September 30, compared to earnings of $4.73 per share for the same period in 2022.

Teledoc Health, Inc.

All currency listed in thousands of US dollars, except for per share data.

Selected highlights from their third quarter 2023 financial results on October 24, 2023

  • Revenue of $660,238 for the three months ended September 30, compared to $611,402 for the same period in 2022. An increase of almost 8%.
  • Net loss of $57,073 for the three months ended September 30, compared to a net loss of $73,476 in the same period in 2022.
  • Diluted loss per ordinary share of $0.35 for the three months ended September 30, compared to a loss of $0.45 per share for the same period in 2022.


  • Revenue of $1,941,888 for the nine months ended September 30, compared to $1,769,131 for the same period in 2022. An increase of almost 10%.
  • Net loss of $191,478 for the nine months ended September 30, compared to a net loss of $9,849,460 in the same period in 2022.
  • Diluted loss per ordinary share of $1.17 for the nine months ended September 30, compared to a loss of $61.09 per share for the same period in 2022.

CN Rail

All currency listed in millions of Canadian dollars, except for per share data.

Selected highlights from their third quarter 2023 financial results on October 24, 2023

  • Revenue of $3,987 for the three months ended September 30, compared to $4,513 for the same period in 2022. A decrease of almost 12%.
  • Net income of $1,108 for the three months ended September 30, compared to net income of $1,455 in the same period in 2022.
  • Diluted earnings per ordinary share of $1.69 for the three months ended September 30, compared to earnings of $2.13 per share for the same period in 2022.


  • Revenue of $12,357 for the nine months ended September 30, compared to $12,565 for the same period in 2022. A decrease of almost 2%.
  • Net earnings of $3,495 for the nine months ended September 30, compared to net earnings of $3,698 in the same period in 2022.
  • Diluted earnings per ordinary share of $5.27 for the nine months ended September 30, compared to earnings of $5.34 per share for the same period in 2022.

Amazon.com, Inc.

All currency listed in millions of US dollars, except for per share data.

Selected highlights from their third quarter 2023 financial results on October 26, 2023

  • Revenue of $143,083 for the three months ended September 30, compared to $127,101 for the same period in 2022. An increase of almost 13%.
  • Net income of $9,879 for the three months ended September 30, compared to net income of $2,872 in the same period in 2022.
  • Diluted earnings per ordinary share of $0.94 for the three months ended September 30, compared to earnings of $0.28 per share for the same period in 2022.


  • Revenue of $404,824 for the nine months ended September 30, compared to $364,779 for the same period in 2022. An increase of almost 11%.
  • Net earnings of $19,801 for the nine months ended September 30, compared to a net loss of $3,000 in the same period in 2022.
  • Diluted earnings per ordinary share of $1.89 for the nine months ended September 30, compared to a net loss of $0.29 per share for the same period in 2022.

Portfolio 2

Portfolio 2 for the week ended October 27, 2023: DOWN Red Down Arrow

  • Disney (NYSE: DIS) is in the process of selling its India assets to Indian company Reliance Industries, their biggest competitor in the Indian market.
  • Telus’s (TSE: T) ‘Pollinator Fund’ for Good invested in three clean technology startup companies. Climate Robotics is using robotics and AI to improve the health of agricultural soil. erthos is developing a plant-based resin alternative to traditional plastic. Finally, Plentify is a smart energy company that uses AI and IoT (Internet of Things) technologies to connect household appliances to cheaper, and more reliable energy.

Activity

No significant activity to report this week.

Dividends

Dividends Received this week for the following companies:

Companies followed by DRIP (Dividend Re-Investment Plan) indicate additional shares were purchased with the dividend. Any cash leftover was added to the cash balance.

No dividends this past week.

Quarterly Reports

Microsoft Corporation

All currency listed in millions of US dollars, except for per share data.

Selected highlights from their first quarter 2024 financial results on October 24, 2023

  • Revenue of $56,517 for the three months ended September 30, compared to $50,122 for the same period in 2022. An increase of almost 13%.
  • Net income of $22,291 for the three months ended September 30, compared to net income of $17,556 in the same period in 2022.
  • Diluted earnings per ordinary share of $2.99 for the three months ended September 30, compared to earnings of $2.35 per share for the same period in 2022.


Mitek Systems, Inc.

All currency listed in thousands of US dollars, except for per share data.

Selected highlights from their third quarter 2023 financial results on October 26, 2023

  • Revenue of $43,070 for the three months ended September 30, compared to $39,195 for the same period in 2022. An increase of almost 10%.
  • Net loss of $428 for the three months ended September 30, compared to a net loss of $215 in the same period in 2022.
  • Diluted loss per ordinary share of $0.01 for the three months ended September 30, compared to earnings of $0.00 per share for the same period in 2022.
  • Revenue of $134,896 for the nine months ended September 30, compared to $105,178 for the same period in 2021. An increase of over 28%.
  • Net earnings of $9,471 for the nine months ended September 30, compared to net earnings of $3,344 in the same period in 2022.
  • Diluted earnings per ordinary share of $0.20 for the nine months ended September 30, compared to earnings of $0.07 per share for the same period in 2022.

Fortis Inc.

All currency listed in millions of Canadian dollars.

Selected highlights from their third quarter 2023 financial results on October 27, 2023

  • Revenue of $2,719 for the three months ended September 30, compared to $2,553 for the same period in 2022. An increase of almost 7%.
  • Net income of $445 for the three months ended September 30, compared to net income of $371 in the same period in 2022.
  • Diluted earnings per ordinary share of $0.81 for the three months ended September 30, compared to earnings of $0.68 per share for the same period in 2022.


  • Revenue of $8,632 for the nine months ended September 30, compared to $7,875 for the same period in 2021. An increase of almost 10%.
  • Net earnings of $1,275 for the nine months ended September 30, compared to net earnings of $1,094 in the same period in 2022.
  • Diluted earnings per ordinary share of $2.32 for the nine months ended September 30, compared to earnings of $2.01 per share for the same period in 2022.

Portfolio 3

Portfolio 3 for the week ended October 27, 2023: DOWN Red Down Arrow

  • Enghouse Systems (TSE: ENGH) increased its partnership with Intertec Systems to provide enterprise video management, contact center and fleet management transportation solutions to the Mid Eastern market. Together they will provide solutions to industry sectors such as health care, government, retail and legal.
    Enghouse also increased its relationship with Voxtron Middle East LLC to allow Voxtron to resell Enghouse’s Contact Center as a Service (CCaaS) solutions and bundle services around the Enghouse product.

Activity

No significant activity to report this week.

Dividends

Dividends Received this week for the following companies:

Companies followed by DRIP (Dividend Re-Investment Plan) indicate additional shares were purchased with the dividend. Any cash leftover was added to the cash balance.

Canadian $

goeasy Ltd (TSE: GSY)

US $

No US$ dividends this past week.

Quarterly Reports

Microsoft Corporation

See report under Portfolio 2.


Weekly Update for the week ending October 20, 2023

Items that may only interest or educate me ….

Canadian Economic news, US Economic news, Another potential US government shutdown, Canadian banks to set aside more capital, A pivotal week coming up …..

Canadian Economic news

This past week’s key economic data that the Bank of Canada (BoC) considers when deciding whether to raise or lower the interest rate.

Consumer Price Index

Canada’s annual inflation rate, measured by the Consumer Price Index (CPI), grew 3.8% in September, after gaining 4.0% in August. Monthly, the cost of living actually dropped in September by 0.1%, after a gain of 0.4% in August. Analysts had expected gains of 4.0% and 0.1%, respectively.

The annual decline was due to a slowdown in economic growth, with prices rising more slowly in five of the eight major components. The biggest increases were in ‘gasoline’ (up 7.5%) and ‘shelter’ (up 6.0%). The only component to see a decline was ‘household operations, furnishings, and equipment’ (down 1.1%).

The month-over-month decline was the first monthly decline since November 2022 and was primarily the result of lower gas prices. The biggest increases were in ‘clothing and footwear’ (up 0.9%) and ‘shelter’ (up 0.5%), while the biggest declines were in ‘gasoline’ (down 1.3%) and ‘household operations, furnishings, and equipment’ (down 0.7%).

Core CPI, which strips out the volatile food and energy components from the overall CPI, fell 0.1% in September, but rose 3.2% on a year-over-year basis. Core CPI is a more accurate measure of underlying inflation trends.

The slowdown in the pace of price growth suggests that the Bank of Canada’s (BoC) rate hikes are making progress in reducing inflation. As a result, the pressure on the BoC to raise the benchmark interest rate at its October 25 meeting has eased. Analysts believe the chances of the BoC leaving the rate at 5.0% have increased with this latest data.

Retail Sales

In August, Statistics Canada reported a 0.1% decline in retail sales, in contrast to the 0.3% increase in July. Analysts had predicted a 0.3% drop for August, following July’s 0.3% growth. Yearly sales saw a 1.6% increase. Core retail sales, which excludes ‘gas, vehicles, and parts’, fell by 0.3% from July to August but showed a 2.1% increase compared to the previous year.

Breaking down the monthly data, the largest increase occurred in the ‘Gasoline stations and fuel vendors’ subsector, marking a 2.8% increase, while the ‘Food and beverage retailers’ subsector experienced the steepest decline, dropping by 1.2%. Annually, the ‘Health and personal care retailers’ subsector jumped 8.4%, whereas the ‘Gasoline stations and fuel vendors’ subsector faced a 9.3% decline compared to the previous year.

High inflation continues to impact Canadian consumers’ spending habits. Many are delaying significant purchases that require borrowing from financial institutions. Additionally, many retailers cited product availability issues due to the port strike in Vancouver, which hampered sales throughout August.

Canadian market volatility

The Canadian Volatility Index (VIXC), as measured by the TSX 60 VIXI, ended the week at 17.09, up from last week’s 17.04 reading. Investors expectation of market volatility in the Canadian stock market has increased slightly but remains low. Generally speaking, a Canadian VIX reading above 20 is considered to be high, while a Canadian VIX reading below 20 is considered to be low.

Canadian economy projections

The recent report from the independent Parliamentary Budget Officer (PBO) paints a bleak picture of Canada’s economic future, especially in the short term. So much for ‘sunny ways’. Projections suggest economic stagnation well into 2024, driven partly by falling consumer spending due to rising interest rates. Unemployment rates are expected to rise from 5.1% in 2022 to 6.0%, and while current inflation hovers around 4%, it is projected to gradually decrease to 2.8% later in 2024. The report also suggest that the BoC will start reducing the benchmark interest rate by the end of the first quarter in 2024, with rates likely to remain between 2% – 3% until 2028.

For consumers and businesses with a mortgage, line of credit or any type of loan, you will be paying more in interest expenses for the next few years, at least.

US Economic news

This past week’s key data points that the Federal Reserve (Fed) considers when deciding whether to raise or lower the interest rate.

American market volatility

During the week, the CBOE Volatility Index (VIX) reached 21.71, up from 19.32 last week. Once again, the there was an increase in the perceived volatility of the American markets.

Retail sales

The Commerce Department reported a 0.7% increase in retail sales for September, following a 0.6% rise in the previous month, surpassing analysts’ expectations of a 0.3% growth. Year over year, retail sales showed a robust increase of 3.8%. When retail sales rise, it signals that consumers are confident in their financial situations and are willing to spend on goods and services, indicating their positive outlook on job stability and the overall economy. While this reflects a strong economy, the Fed will view it cautiously as they continue their battle against inflation.

Another potential US government shutdown

Remember the narrow escape from a government shutdown in the US at the end of September? If not, here is a quick reminder: they pushed the deadline to November 17. Now, with less than a month left, the House of Representatives has not yet passed a budget to avoid a shutdown. Before they can even propose a budget, the majority party, the Republicans, needs to elect a leader. They have not, and do not appear to being able to elect a leader.

A shutdown would halt non-essential government operations, leading to unpaid leave for many federal employees and disruptions in government contracts and payments.

For us investors, the major concern is the likely delay in economic data and reports released by government agencies. The Fed relies on this data when determining the appropriate US interest rates. Such a delay would not only impact US stock markets but would also reverberate globally since the US has the largest economy in the world. Moreover, as we know, markets do not respond well to uncertainty. The absence of crucial economic information and the government’s inability to function properly would introduce uncertainty into financial markets, amplifying market volatility.

Let us hope the House can get their affairs in order and propose a reasonable budget sooner rather than later. American citizens who work for or depend on the US government certainly do not need a third round of brinkmanship in 2023. For us investors, we can do without the uncertainty a shutdown would bring.

Canadian banks to set aside more capital

The BoC recently issued a directive to Canadian banks and lending institutions, requiring them to maintain a higher amount of capital as a buffer against financial risks. This directive aims to enhance the stability of the banking system, making it more stable and safer during economic downturns and financial uncertainties. For investors, this directive signifies increased stability in the banking sector, translating to reduced investment risks. However, as banks need to retain more of their earnings to meet these requirements, it will likely impact their ability to engage in shareholder-friendly activities in the short term, such as raise dividends, pay one-time special dividends or buyback their own shares.

A pivotal week coming up

The next few weeks could be quite interesting for the US markets as the “Magnificent 7” – Apple (NASD: AAPL), Microsoft (NASD: MSFT), Alphabet (NASD: GOOGL), Amazon (NASD: AMZN), Nvidia (NASD: NVDA), Tesla (NASD: TSLA) and Meta Platforms (NASD: META) report third quarter earnings. The oversized influence that the Magnificent 7 has over the Nasdaq and S&P is one of the reasons that I and other investors will closely be watching their earnings reports. These seven companies have led the market all year so its important that they deliver strong earnings results. Their performance is likely to set the tone for the fourth quarter. Hopefully Tesla’s dismal results are not a harbinger of things to come in the next few weeks.


While the economic landscape seemed fairly quiet last week, beneath the surface, several significant events were in motion. Let’s take a look at the highlights and see what happened this past week…

Weekly Market Review

Monday: all four major North American indexes ended higher, getting the week off to a good start. Investors appeared to have digested last week’s higher US inflation numbers and are optimistic about upcoming third quarter earnings later this week. Oil prices sank on news the US and Venezuela could reach a deal to ease sanctions on Venezuela in exchange for more oil.

In Canada, wholesale trade data came in slightly below expectations but still increased a solid 2.3% in August. The Toronto Stock Exchange Composite Index (TSX) mirrored its American cousins with a surge in growth-oriented technology companies. All Canadian sectors ended in the green, led by the Technology and Telecommunications Services sectors. Consumer Cyclicals and Energy brought up the rear.

In the US, investors anticipate a strong third quarter earnings season, pushing all three indexes solidly into the green. Strong performances in all sectors lifted the Nasdaq Composite Index (Nasdaq), S&P 500 Index (S&P), and the Dow Jones Industrial Average (DJIA) higher.

Tuesday: it was a day of mixed results. The TSX ended higher, the DJIA and S&P were essentially flat with the DJIA barely in the green and the S&P just under the line, and the Nasdaq ending lower. Oil prices rose as investors wait to see how the situation in the Middle East plays out.

In Canada, the TSX hit a three-week high as the CPI came in lower-than-expected raising hopes the BoC will leave the interest rate unchanged at there meeting next week. Surging share prices of gold mining companies gave the TSX a boost as investors return to gold as a safe heaven in times of uncertainty. In trading, the Basic Materials sector (miners, including gold, and fertilizer manufacturers) led all Canadian sectors.

In the US, retail sales for September came in twice as high as forecast, indicating the American consumer remains resilient in the face of higher interest rates. Third quarter earnings season continues with many of the companies that have reported beating expectations. A good sign for the economy.

Wednesday: fears of escalation in the Middle East sent oil prices higher, stoking concerns of inflation and higher interest rates. As a result, all four indexes ended the day firmly lower. Recent US economic data showed the American consumers spending remained strong causing investors to worry about interest rates staying high for longer. Oil prices jumped on lower US stockpiles and the conflict in the Middle East.

In Canada, concerns about higher for longer interest rates weighed on interest sensitive companies sending the TSX into the red. It was a day of broad-based losses as the Energy sector was the only sector to make it into the green. Consumer Cyclicals and Industrials fell the farthest.

In the US, the yields on low-risk Treasury bonds rose, making them more attractive than higher risk stocks. Disappointing quarterly results from some larger US companies also weighed on the markets. In trading, Energy was the only American sector to finish higher. The biggest declines were recorded by the Industrials and Basic Materials sectors.

Thursday: the indexes were up and down like a yoyo for most to the trading session. After the Fed Chair Jerome Powell said inflation is still too high, the indexes plunged into negative territory where they stayed for the rest of the day. Also weighing on the markets was the Middle East conflict. If the conflict spreads to oil producing parts of the region, it could lead to higher oil prices which in turn could cause inflation to rise.

In Canada, comments from the Fed Chair about higher for longer interest rates caused already shaky investor sentiment to wobble, sending the TSX to a two-week low. In Canada, Telecommunications Services and Energy were the only Canadian sectors to end higher, while Healthcare and Consumer Staples had the biggest drops.

In the US, Treasury yields surged after the Fed Chair said an additional rate hike may be necessary to get inflation back on track towards the 2% goal. This caused investors to flock to less risky government bonds, increasing overall market volatility. In trading, the Telecommunications Services sector was the only sector to advance. Consumer Cyclicals and Financials suffered the biggest losses.

Friday: all four indexes ended the day lower as oil prices and US Treasury yields continued to rise. Hawkish comments from the Fed Chair about the possibility of higher interest rates pushed government bonds higher. Investors responded by moving their money from riskier investments like stocks to safer government bonds. The higher yields make borrowing more expensive for companies, slowing the economy and putting downward pressure on stocks. As well, despite a drop in oil prices today, the recent run up of oil prices threatens to add more upward pressure on inflation.

In Canada, the TSX dropped to a two-week low as long-term borrowing costs continue to rise (the interest on bonds) driving down the share price of economically sensitive sectors such as Energy (lower demand when interest rates are high) and Financials (less lending due to higher rates and having to hold more capital in the event of default loans and mortgages). It was not a good day in trading on Bay Street as all sectors ended lower. Consumer Cyclicals and Industrials posted the smallest losses, while Financials and Telecommunications had the biggest losses.

In the US, ten-year government bonds are barely under 5%, causing investors to sell riskier stocks in favour of almost no risk government bonds, putting downward pressure on the American stock markets. Investors believe the Fed will not raise the interest rate at their end of the month meeting, but higher energy prices could force the Fed’s hand at the mid December meeting. It was a day of broad-based losses on Wall Street, as all sectors ended in the red. Telecommunications Services and Healthcare dropped the least while Technology and Financials went the deepest into the red.


Weekly Market and Portfolio Review

For the week, the TSX (SPTSX) sank 1.8%, the S&P 500 (SPX) dropped 2.4%, the DJIA (INDU) fell 1.6% and the Nasdaq (CCMP) plunged 3.2%.

Bearish market Once again, the market started the week strong, but by midweek, a downward trend began, as depicted in the graph above. The decline was triggered by concerns that the ongoing conflict in the Middle East might spread to neighbouring oil-producing nations, leading to surging oil prices. This, in turn, could push up inflation rates, prompting central banks to consider raising interest rates. Comments from Fed Chair Powell about a potential rate hike only added to existing worries.

Learning point: When there’s substantial government spending, as seen in both Canada and the US, it results in a flood of new government bonds. As the economy’s benchmark interest rate rises, newly issued bonds must offer higher coupon rates to attract investors. Consequently, previously issued bonds with lower coupon (interest) rates become less attractive. To match the appeal of new bonds, the prices of existing bonds decrease in the secondary market. As bond prices fall, their yields, calculated by dividing the annual interest payment by the bond price, rise.

The escalating risk-free yields on government bonds have made them increasingly appealing compared to riskier stocks. Towards the week’s end, when yields neared 5%, many investors chose to sell off their more volatile stocks and invest in risk-free government bonds to secure a guaranteed return. As government bond yields increase, more investors are shifting from risky stocks to bonds, leading to the volatility observed in the stock markets.

This pattern was evident in both the Canadian and US markets, resulting in weekly declines across all four indexes.

Bearish market The portfolios faced another challenging week, as seen in the chart below. As discussed earlier, a shift from high-risk stocks, particularly technology companies prominent in the portfolios, to safer bonds has increased market volatility, especially in the Nasdaq. Unfortunately, this volatility took its toll on the portfolios, resulting in widespread losses. ☹

Seeing a significant downturn across all four indexes, I anticipated it would not be a great week for the portfolios. Although the value of oil companies increased during the week, it did not come close to compensating for losses in other sectors. The presence of oil companies in each portfolio proved vital to mitigating the losses. This highlights the importance of a diversified portfolio. Interestingly, a few years back, I would not have considered owning any oil companies, but now I am glad that I heeded two pieces of advice: its important to be diversified and the world needs oil. 😊

The technology sector had a challenging week, affecting all three portfolios. Portfolio 1, containing both major and lesser-known tech names, experienced widespread declines, making it the worst performer among the portfolios and indexes. Portfolio 2, being more balanced, also faced losses across almost every company in the portfolio, positioning it as the second-worst performer. While Portfolio 1’s drop led me to expect a similar fate for Portfolio 3, it surprisingly experienced less of a decline, primarily due to its lower exposure to the technology sector. However, being the best among a bad lot is not a cause for celebration.

I definitely hope for a market rebound next week, and a return to the winning ways of the first half of the year. I am staying optimistic and look forward to brighter days ahead!

Weekly Portfolio & Index performance
Weekly Portfolio & Index performance for the week ended October 20, 2023.

Companies on the Radar

Stocks on my Radar During the past week, I removed Deere & Company (NYSE: DE) and Restaurant Brands International Inc. (TSE: QSR) from my radar list. Although both are good companies, I believed I could find better options, so I decided to explore elsewhere. Two new companies caught my attention: TerraVest Industries (TSE: TVK) and Gibson Energy (TSE: GEI).

TerraVest is a diverse small-cap Canadian company that manufactures and sells goods and services to energy, agriculture, mining, and transportation sectors in Canada and the US. While Gibson is a small-cap Canadian company specializing in providing liquid infrastructure products and services to the North American energy sector.

Small-cap companies, typically valued between $300 million and $2 billion (market capitalization is calculated by multiplying share price with the number of outstanding shares), offer the potential for higher returns. However, they come with higher volatility and increased risk. Due to their smaller size and lower trading volumes, these stocks tend to be more sensitive to market fluctuations, economic events, and company-specific news. The upside is they have lots of room to grow, which I would count on.

Interestingly, with the departure of Deere & Company and the inclusion of these two new companies, I noticed my radar list is unintentionally comprised solely of Canadian companies. Normally, I prefer a mix of Canadian and American companies for diversification purposes and to be invested in the world’s largest economy. I will need to keep an eye out for potential American additions in the future.

  • Dollarama (TSE: DOL), a large Canadian company that operates dollar stores across Canada.
  • MTY Food Group Inc. (TSE: MTY), a small cap Canadian consumer cyclical company that operates and franchises quick service and casual dining restaurants throughout North America and internationally.
  • TFI International Inc. (TSE: TFII), a mid-sized Canadian transportation and logistics company operating across North America.

The Radar Check was last updated October 20, 2023.

Stock on the Radar List. 1 of 2.

Stock on the Radar List. 2 of 2.


Portfolio Update

Portfolio 1

Portfolio 1 for the week ended October 20, 2023: DOWN Red Down Arrow

  • The US government is tightening the restrictions on the sale to China of semiconductors used in artificial intelligence (AI) by chip designers such as Nvidia. Nvidia’s top chips were already barred from sale to Chinese companies, but these new regulations will prohibit the sales of a broader range of advanced semiconductors. Nvidia says it will not have much impact on its financial results in the short term.
  • Tesla announced they are recalling over 54,000 of their Model X electric vehicles (EV) built between 2021 and 2023. The problem is the vehicle controller module is unable to detect low brake fluid.
    Tesla’s third quarter report was downright dismal as the company missed expectations on third quarter revenue, gross margin, and net profit. Ouch! The company said higher interest rates are hurting sales. They did not mention that their price cuts were likely the cause of lower gross margins and profits.
  • General Motors (NYSE: GM) raised its offer to United Auto Workers unions. The latest offer includes a wage hike of 23%, plus other benefits. The wage hike matches those made by fellow car makers Ford (NYSE: F) and Stellantis (NYSE: STLA).

Activity

Bought: Rivian Automotive (NASD: RIVN) I do not expect to recover my initial investment in Rivian, but I do believe the company will do well going forward and the share price will rise. While Tesla is the undisputed #1 in EVs, I think Rivian could become the #1 maker of electric trucks and electric SUVs. I am seeing more and more Rivian electric trucks and electric SUVs on the road, whereas Tesla’s Cyber truck is not in production, and I have seen very, very few electric trucks and SUVs from other manufacturers.

The risk is Rivian runs out of money or loses market share to other competitors. At this time, Rivian is practically the only EV maker in the truck and SUV market so it could obtain a dominant share of the market before competitors enter the market, much like Tesla has done in the electric car market.

On the positive side, management at Rivian has shown strong execution, surpassing delivery expectations in the second quarter. Additionally, they are constructing a new facility and developing more affordable EV versions. These strategic moves are expected to enhance production efficiency, lower vehicle costs, and boost revenues. A positive sign is the insider trading activity, where more shares have been bought than sold in the last six months. Finally, analysts’ insights further support Rivian’s potential. TD Direct Investing has a twelve-month target in the range of US$29, while Morningstar currently shows a fair value price of US$29.

Overall, I wish I had sold my initial purchase of shares when it was in the US$160 range but there is nothing, I can do about that. I think Rivian will do well from here as they are a first mover in the electric truck and SUV market. The share price had been trending higher, but this recent drop offered an opportunity to pick up shares at a reasonable price. If the company keeps performing well, I will be quite happy if it reaches the US$29 range for a 50% gain. I would be ecstatic if it reached US$160. 😊

Dividends

Dividends Received this week for the following companies:

Companies followed by DRIP (Dividend Re-Investment Plan) indicate additional shares were purchased with the dividend. Any cash leftover was added to the cash balance.

Canadian $

Andlauer Healthcare Group Inc (TSE: AND)

US $

BSR Real Estate Investment Trust (TSE: HOM.U)

Quarterly Reports

Tesla, Inc.

All currency listed in millions of US dollars, except for per share data.

Selected highlights from their third quarter 2023 financial results on October 18, 2023

  • Revenue of $23,350 for the three months ended September 30, compared to $21,454 for the same period in 2022. An increase of almost 9%.
  • Net income of $1,853 for the three months ended September 30, compared to net income of $3,292 in the same period in 2022.
  • Diluted earnings per ordinary share of $0.95 for the three months ended September 30, compared to earnings of $0.53 per share for the same period in 2022.


Portfolio 2

Portfolio 2 for the week ended October 20, 2023: DOWN Red Down Arrow

  • The Bank of Nova Scotia (TSE: BNS) announced it will reduce its workforce by approximately 2,700, or 3% in the coming months. Do not be surprised if similar announcements come from other Canadian banks and money lenders.
  • TC Energy (TSX: TRP) received sign off from the US Federal Energy Regulatory Commission (FERC) to add an additional 150,000 dekatherms per day of firm transportation service to its Gas Transmission Northwest (GTN) system. In case you were wondering, as I was, a dekatherm is a unit of energy used to measure natural gas consumption. It is equivalent to 1 million British thermal units (BTUs). It is a standard unit used in the energy industry to simplify large-scale energy measurements, particularly when dealing with substantial quantities of natural gas.

Activity

No significant activity to report this week.

Dividends

Dividends Received this week for the following companies:

Companies followed by DRIP (Dividend Re-Investment Plan) indicate additional shares were purchased with the dividend. Any cash leftover was added to the cash balance.

Canadian $

SmartCentres Real Estate Investment Trust (TSE: SRU.UN)

Dream Industrial Real Estate Investment Trust (TSE: DIR.UN)

US $

No US$ dividends this past week.

Quarterly Reports

No quarterly reports this past week, except for per share data.

Portfolio 3

Portfolio 3 for the week ended October 20, 2023: DOWN Red Down Arrow

  • Microsoft announced they would layoff an additional 3% of their 20,000 LinkedIn staff to cut costs amid slowing revenue growth.

Activity

No significant activity to report this week.

Dividends

Dividends Received this week for the following companies:

Companies followed by DRIP (Dividend Re-Investment Plan) indicate additional shares were purchased with the dividend. Any cash leftover was added to the cash balance.

Canadian $

SmartCentres Real Estate Investment Trust (TSE: SRU.UN) DRIP

US $

No US$ dividends this past week.

Quarterly Reports

No quarterly reports this past week.


Weekly Update for the week ending October 13, 2023

Items that may only interest or educate me ….

Canadian Economic news, US Economic news, A new investing resource, AI at work …

Apparently, mid October is when the stock markets historically start to rally until the end of the year. After 18 months of rate hikes by the Canadian and US central banks, both economies have avoided a recession. In Canada, the growth in the labour market easily surpassed expectations for the last three months. It is a similar story in the US, only a stronger labour market and more robust economy. Inflation that refuses to go away is the speed bump preventing the markets from rallying. But let us not get ahead of ourselves. Here is a quick look at items that caught my attention this past week.

Canadian Economic news

This week’s key economic data that the Bank of Canada (BoC) considers when deciding whether to raise or lower the interest rate.

There were no key economic reports released this past week.

Canadian market volatility

Last week I obtained a reading of 11.27 based on the S&P/TSX 60 VIX. I checked it this week and it had not moved from last week’s reading of 11.27. I found that highly unlikely given the events in the middle east and the latest US inflation numbers. I did a bit of research and discovered the TSX 60 VIX index (TSX: VIXI), a volatility index that measures the implied volatility of S&P/TSX 60 index options over the next 30 days. It is calculated using a similar methodology to the US VIX index. Going forward, I will use this reading to get a sense of the volatility in the Canadian markets.

This week the TSX 60 VIX index ended at 15.52, down slightly from last week’s 15.59 reading. The index remains low and suggests that investors are becoming more confident in the Canadian stock market. Generally, a Canadian VIX reading above 20 is considered to be high, while a Canadian VIX reading below 20 is considered to be low.

US Economic news

This week’s key data points that the Federal Reserve (Fed) considers when deciding whether to raise or lower the interest rate.

Producer Price Index

The Producer Price Index (PPI) for September came in higher than expected, up 2.2% from a year ago, the fastest pace since April. On a monthly basis, PPI prices rose 0.5%, down from August’s 0.7% increase. Analysts had forecast a pace of 1.6%. Core PPI, the PPI excluding energy and food prices, rose 2.7% on an annual basis and 0.3% since August.

Whereas the Consumer Price Index (CPI) measures price changes at the end consumer level, the PPI measures price changes at the wholesale level before the final prices reach consumers. PPI is often considered a leading indicator of the CPI, as changes in wholesale prices typically precede changes in consumer prices. The latest data suggest inflationary pressures remain high, despite the high interest rates. However, looking at the monthly numbers, the rate is slowing.

FOMC minutes

The latest minutes from the Federal Open Market Committee’s (FOMC) September 19-20 meeting showed that while the committee did not raise the benchmark interest rate, the majority felt an additional increase sometime this year would be appropriate. It was felt the rate had to remain high enough to drive inflation to their target inflation rate of 2%. Officials were concerned about inflation, higher energy prices, slower economic growth and higher unemployment and that decisions should be made based on the data rather than a predetermined path.

The FOMC minutes are important documents because they provide insights into the discussions and decisions made during meetings that impact America’s economic and monetary policy. They provide a view into the Fed’s thinking and reasoning, allowing us investors to understand what factors influence their decisions and help us make more informed choices about our investments. Finally, the minutes hold the Fed accountable for its actions, ensuring transparency and helping investors anticipate potential changes in the economy and financial markets.

Consumer Price Index

The Labor Department’s CPI report for September showed overall, or headline, inflation rose 0.4% in September after a 0.6% rise in August. Excluding the volatile food and energy components, the core CPI grew by 0.3% in September, matching August’s increase. Analysts were expecting 0.3% for both headline CPI and core CPI.

On an annual basis, the rate of CPI growth was 3.7%, matching August’s rate, and core CPI was up 4.1%. The annual increase in the core number was the smallest in two years. Analysts were expecting 3.6% for headline CPI and 4.1% for core CPI. Analysts prefer the core CPI numbers as a better indicator of underlying inflation than the overall CPI.

For overall CPI, fuel and shelter were the biggest contributors to higher prices in September, while Shelter and Transportation Services were the biggest contributors on a year over year basis. For core CPI, Shelter and Transportation Services saw the biggest gains both monthly and annually.

In September, both the PPI and the CPI were higher than expected. Combine that with a stronger than expected job market, the chances of another interest rate hike by the Fed have only increased.

Consumer Sentiment Index

The University of Michigan’s initial measure of consumer sentiment came in at 63.0 for October, down from September’s 68.1. October’s reading is the lowest reading since May and lower than analysts’ expectations of 67.2. The reading is down 7.5% since September but up 5.2% year over year. The biggest reason for the short-term drop was concerns about inflation, higher interest rates and declining economic conditions. As for the long term, consumers believe the economic situation has improved since the same period in 2022.

Analysts and the Fed closely watch the Consumer Sentiment Index because it is seen as a leading indicator of economic growth. A decline in the CSI can be a sign of a recession on the horizon.

American market volatility

During the week, the CBOE Volatility Index (VIX) reached 19.32, up from 17.45 last week. This suggests an increase in the volatility in the American markets.

A new investing resource

Recently, I stumbled upon Stratosphere.io, a great website for diving into corporate financial data and ratios, ideal for researching companies you are interested in investing in. Its user-friendly interface presents information through intuitive tables and charts, making it easy to spot key insights and trends. I am currently using the free version since it offers everything I need. If you are searching for a reliable resource to analyze companies you are interested in, check it out.

AI at work

How many times have you been stuck in traffic or stopped at a traffic light wondering why anyone cannot figure out a way to keep traffic moving. Well, Google (NASD: GOOGL) is attempting to use artificial intelligence (AI) to fix that, or at least help traffic flow better.

Google’s Project Green Light is a relatively new AI-powered initiative to help cities improve traffic flow at intersections and reduce stop-and-go emissions. It uses Google Maps driving trends to model traffic patterns and make recommendations for optimizing the existing traffic light plans. City engineers can implement these in as little as five minutes, using existing infrastructure to keep costs down. It is both scalable and flexible since it can be applied to any city with existing traffic lights and adapted to different traffic conditions and city needs.

While it is still in the early stages, project Green Light has been shown to reduce stops by up to 30% and emissions at intersections by up to 10%. The project is currently being tested at 70 intersections in 12 cities across four continents, ranging from Abu Dhabi in the United Arab Emirates to Seattle, Washington. Unfortunately, it is not being tested in Canada.

In Seattle, Google is working with the city engineers to optimize traffic lights for buses. This will help reduce bus travel times and make public transportation more attractive to riders. Another example is in Rio de Janeiro where Google is developing a new AI-powered traffic signal system that will give priority to pedestrians and cyclists at intersections.

The purpose of Project Green Light is to make cities more sustainable and livable by reducing traffic congestion and air pollution. This is a great example of AI being used to make people’s lives better and big companies using technology for the better. Hopefully, it will come to Canada sooner rather than later to ease traffic congestion and thereby reduce pollution caused by vehicles idling in traffic and at traffic lights.


The week got off to a good start, before falling at the end of the week. Let’s see what caused the market movements this past week ….

Weekly Market Review

Monday: All three indexes – the S&P 500 Index (S&P), the Dow Jones Industrial Average (DJIA), and the Nasdaq Composite Index (Nasdaq) – ended the day on a high note after spending the morning largely below the breakeven bar. The Hamas attack on Israel prompted many investors to move into safer assets, causing the early morning decline. However, the markets moved higher after two Fed members suggested they may not need to increase the US benchmark interest rate. Oil prices moved higher as investors worried about the conflict spreading across the Middle East and the potential disruption to global oil supplies.

In Canada, the Canadian markets were closed for the Canadian Thanksgiving Day holiday.

In the US, it was a quiet day of trading on Columbus Day/Indigenous Day, which saw all sectors end in the green. The Energy and Telecommunications Services sectors posted the biggest gains, while Consumer Staples and Basic Materials (miners & fertilizer manufacturers) brought up the rear.

Tuesday: New measures in China to boost their economy, and dovish comments from Fed officials boosted all four indexes into positive territory. After recent comments from Fed officials, investors now believe the Fed will maintain the current 5.5% interest rate.

In Canada, the Toronto Stock Exchange Composite Index (TSX) ran its winning streak to four and posted its biggest single day gain in almost a month. The TSX benefitted from higher commodity prices and the comments from various Fed officials. In trading, the Energy and Basic Materials sectors were the big beneficiaries of higher commodity prices, outperforming all other Canadian sectors. Healthcare and Consumer Staples were the only sectors to decline.

In the US, the markets rose after a Fed official said they it was unlikely they would have to increase the interest rate to get inflation back to their 2% target. He also said a recession was unlikely given the latest data. These dovish comments caused the yields on US government bonds to fall, leading investors back into the stock markets. In trading, all American sectors ended higher, led by Utilities and Consumer Cyclicals, with Energy and Technology bringing up the rear.

Wednesday: The indexes continued their respective winning streaks as they all ended in positive territory. Oil prices dropped when Saudi Arabia said it would help stabilise oil supplies, quelling investors fears of supply disruption. Lower energy prices decrease inflationary pressures. The other market driver was the release of the minutes from the Fed’s last meeting. The minutes revealed the Fed will proceed cautiously, suggesting that the Fed is not leaning towards a rate hike.

In Canada, The TSX posted its fifth consecutive day of gains as the yields on bonds (long term borrowing) continues to drop, leading investors to move back into stocks. It was a good day for the TSX, with nine of ten sectors moving upward, led by Utilities and Consumer Cyclicals. The only sector to drop was Healthcare.

In the US, the three American indexes briefly dipped into the red on news the PPI came in higher than expected, suggesting inflationary pressures persist despite the cumulative effect of all the interest rate hikes. With the higher PPI, investors now turn to tomorrow’s CPI report to gather clues as to what the Fed is likely to do at their next meeting. In trading, Utilities and Basic Materials posted the biggest gains, while Energy, Consumer Staples and Healthcare were the only sectors to sink.

Thursday: The winning streaks ended with a thud! today as all four indexes ended lower. The big news for the day was the latest US inflation report that showed inflation cooled since August but remains high at 3.7%, well above the Fed’s 2% target. Stocks fell on the news and its implications for interest rates, possibly higher but definitely longer. Oil prices inched higher as the Organization of Petroleum Exporting Countries (OPEC) repeated their predictions for demand.

In Canada, the US sneezed on their inflation number and the TSX’s winning streak ended. 😊 In trading, it was a day of broad-based losses in the Canadian sectors with only the Energy sector ending in positive territory. The biggest losses on the day were suffered by the Utilities and Consumer Cyclicals sectors.

In the US, consumer prices increased at a faster pace than expected. This led to concerns about how the Fed would react to prices growing faster than projected, bringing an end to the respective four day winning streaks of the three American indexes. In trading, the Energy sector was the only American sector to end in the green. The Basic Materials and Utilities sectors posted the biggest losses for the day.

Friday: The indexes started in the green before ending the day with mixed results. The DJIA was the only index to end higher, the TSX and S&P were down, while the Nasdaq was sharply lower. The higher-than-expected US inflation data has investors worried about ‘higher for longer’ interest rates. The conflict in the middle east also weighs on investors. Oil prices rose after the US increased sanctions on Russian oil exports, reports that global oil stockpiles declined, and fears the conflict could expand into other oil producing countries in the region.

In Canada, the TSX ended lower despite higher commodity prices, largely due to concerns about the ongoing conflict in the middle east. On Bay Street, the commodity sectors Basic Materials and Energy (Oil) were the only two Canadian sectors to advance. The biggest losers of the day were Technology and Consumer Staples.

In the USA, the DJIA was lifted by solid third quarter results by a few of the big banks. Neither the S&P nor Nasdaq contain big US banks to offset the drop caused by declining consumer confidence brought on by lingering inflation. On Wall Street, the Energy and Utilities sectors posted the largest gains, while the interest sensitive Technology and Consumer Cyclicals sectors suffered the biggest drops.


Weekly Market and Portfolio Review

For the week, the TSX (SPTSX) gained 1.1%, the S&P 500 (SPX) was up 0.4%, the DJIA (INDU) advanced 0.8% and the Nasdaq (CCMP) slipped 0.2%.

Bull market. A good week for the North American stock markets. Despite inflation staying high, three of the four indexes posted weekly gains, as you can see in the chart above. If it were not for a Friday selloff, all four indexes would have posted weekly gains. Sigh!

The American indexes were initially boosted by the good news that inflation is cooling but then fell on the realization inflation is still much higher than the Fed’s 2% target. While the latest inflation news may not be enough for the Fed to warrant raising the US interest rate again, it did increase the chances of a rate hike. Whether there is an increase or not, it did reinforce the Fed’s higher-for-longer mantra about interest rates, causing the markets to slide towards the end of the week.

The selloff brought the S&P lower and sent the Nasdaq into the red. The DJIA was the only index to rally on Friday thanks to decent third quarter earnings from a few major US banks that reported this past week.

In Canada, the TSX snapped a streak of three straight weekly declines. This past week, the TSX was driven higher by surging energy and commodity prices, particularly a surge in energy prices. However, Canada has a similar problem to the US when It comes to sticky inflation. Unfortunately, inflation is not falling as fast as the BoC would like which could lead to another hike to Canada’s benchmark key interest rate.

Bearish marketAt the close of trading on Thursday, all three portfolios were performing well, suggesting it was going to be a good week for the portfolios. However, a sudden and sharp decline in the Nasdaq on Friday reversed a lot of the gains. This decline impacted all three portfolios, causing two of them to end the week in negative territory, as you can see below. Portfolios 1 and 3, which lean heavily towards growth-oriented companies, were particularly affected, slipping into negative figures. Portfolio 2, being more balanced and less reliant on technology companies, managed to stay in positive territory, albeit barely.

As we approach mid-October, historically a period marked by market rallies that can extend through to the year-end, I am hopeful that proves true again this year. 😊

Weekly Portfolio & Index performance
Weekly Portfolio & Index performance for the week ended October 13, 2023.

Companies on the Radar

Stocks on my RadarAnother week with no new potential companies on my radar. The five companies on my radar remain:

  • Dollarama (TSX: DOL), a large Canadian company that operates dollar stores across Canada.
  • MTY Food Group Inc. (TSE: MTY), A small cap Canadian consumer cyclical company that operates and franchises quick service and casual dining restaurants throughout North America and internationally.
  • Deere & Company (NYSE: DE), a large American company that manufactures and sells agricultural equipment worldwide.
  • TFI International Inc. (TSX: TFII), a mid-sized Canadian transportation and logistics company operating across North America.
  • Restaurant Brands International Inc. (TSE: QSR), a large cap Canadian consumer cyclical company that operates in the North American quick serve restaurant industry. The company owns Tim Horton’s, Burger King, and Popeye’s Louisiana Kitchen, among others.

The Radar Check was last updated October 13, 2023.

Stock on the Radar List. 1 of 2.

Stock on the Radar List. 2 of 2.


Portfolio Update

Portfolio 1

Portfolio 1 for the week ended October 13, 2023: DOWN Red Down Arrow

  • Cloudflare (NYSE: NET) helped disclose a new vulnerability that would have given hackers the ability to launch attacks larger than anything previously seen on the internet.
  • General Motors (NYSE: GM) announced GM Canada has reached a tentative labour agreement with the Canadian union Unifor. The 4,000 workers will receive up to a 25% raise, plus other benefits the union had been demanding. In the US, the strike by the United Auto Workers union against GM, Ford (NYSE: F) and Stellantis (NYSE: STLA) continues.
  • Lattice Semiconductor (NASD: LSCC) won a 2023 Cybersecurity Breakthrough Award in the “Overall Network Solution of the Year” category for its Open Radio Access Network (ORAN) solution stack. The ORAN stack help customers deliver data securely and efficiently to the intended destination.
  • In the first quarter of 2023, Tesla (NASD: TSLA) owned 62% of the North American electric vehicle (EV) market. By the end of the third quarter Tesla had slipped to 50% of the EV market, losing share to other North American EV manufacturers despite the price war initiated by Tesla.

Activity

No significant activity to report this week.

Dividends

Dividends Received this week for the following companies:

Companies followed by DRIP (Dividend Re-Investment Plan) indicate additional shares were purchased with the dividend. Any cash leftover was added to the cash balance.

Canadian $

Dream Industrial Real Estate Investment Trust (TSX: DIR.UN)

Algonquin Power & Utilities Corp (TSX: AQN)

US $

Innovative Industrial Properties Inc (NYSE: IIPR)

Quarterly Reports

No quarterly reports this past week.

Portfolio 2

Portfolio 2 for the week ended October 13, 2023: UP Green Up Arrow, signifying a positive week

  • TC Energy (TSX: TRP) named its former chief executive officer as the chair of its pipeline business. Earlier this year, the company said it would split into a pipeline business and natural gas transportation company. We now know who will lead the oil pipeline spin off.

Activity

No significant activity to report this week.

Dividends

Dividends Received this week for the following companies:

Companies followed by DRIP (Dividend Re-Investment Plan) indicate additional shares were purchased with the dividend. Any cash leftover was added to the cash balance.

Canadian $

Brookfield Renewable Partners LP (TSX: BEP.UN)

US $

No US$ dividends this past week.

Quarterly Reports

No quarterly reports this past week, except for per share data.

Portfolio 3

Portfolio 3 for the week ended October 13, 2023: DOWN Red Down Arrow

  • Microsoft (NASD: MSFT) received a Notices of Proposed Adjustment from the Internal Revenue Service (IRS) requesting an additional US$28.9 billion for the tax year 2001 through 2013. Ouch! If that is not enough, the IRS is also seeking interest and late penalties. Of course, Microsoft disagrees with this ruling and will appeal.
    In other Microsoft news, Britain’s Competition and Markets Authority (CMA) has given Microsoft the go ahead to proceed with their acquisition of Activision Blizzard (NASD: ATVI). Activision Blizzard had to sell the streaming rights to their games, including the popular ‘Call of Duty’ franchise, to obtain CMA approval. The deal now has been signed off by US, European Union, and British anti trust regulators.
  • TD (TSX: TD) could face a C$500 million lawsuit over claims it did not properly pay vacation and statutory holiday pay to its more than 1,000 mobile mortgage specialists.

Activity

No significant activity to report this week.

Dividends

Dividends Received this week for the following companies:

Companies followed by DRIP (Dividend Re-Investment Plan) indicate additional shares were purchased with the dividend. Any cash leftover was added to the cash balance.

Canadian $

TD U.S. Equity Index ETF (TSX: TPU)

Brookfield Renewable Partners LP (TSX: BEP.UN)

Alvopetro Energy Ltd (TSX: ALV)

US $

No US$ dividends this past week.

Quarterly Reports

No quarterly reports this past week.


2023 Third Quarter Review

Since the start of the year, all four of the major North American indexes – Toronto Stock Exchange Composite Index (TSX), the S&P 500 Index (S&P), the Dow Jones Industrial Average (DJIA), and the Nasdaq Composite Index (Nasdaq) – finished the first half higher than they started, as did the three portfolios, thanks to a bull run in the Nasdaq and the S&P. Unfortunately, what had been a strong bull run for the first half of the year, saw the emergence of a bear or two in the third quarter.

Let’s look at what happened during the third quarter of 2023 ….

Grizzly Bear Chasing a Bison
Contents

Third Quarter Review

Third Quarter Portfolio Update

Portfolio 1 for the third quarter

Portfolio 2 for the third quarter

Portfolio 3 for the third quarter

Nine Month Review

Nine Month Portfolio Review

Looking forward

Third Quarter Review

For the third quarter, the TSX (SPTSX) lost 3.0%, the S&P (SPX) fell 3.6%, the DJIA (INDU) declined 2.6% while the Nasdaq (CCMP) dropped 4.1%.

Bearish market As you can see in the chart above, all four major North American stock indexes experienced declines in the third quarter of 2023. This marked their first quarter in the red since the third quarter of 2022. While not dramatic drops, they contrasted with the strong gains seen in the first half of the year.

Of the three major American indexes, the DJIA performed the best in the third quarter, or more acurately, declined the least. This was likely due to its focus on established companies with strong dividends. The S&P, which tracks a broader range of companies, was more negatively affected by the slowdown in earnings growth. Finally, the technology-heavy Nasdaq brought up the rear, as tech stocks are particularly sensitive to rising interest rates.

Canada’s TSX also lost ground in line with the broader market trends. The index experienced a modest decline compared to the major US indexes, but the energy sector remained a bright spot. Driven by rising oil prices, Canadian energy companies performed well during the quarter.

The key factors driving these market declines were the high interest rates implemented by the Fed and the BoC to combat inflation, plus the talk of higher rates for longer. These higher rates make it more expensive for companies to borrow money, which can lead to slower economic growth and lower corporate profits.

Overall, the third quarter of 2023 was a challenging period for the North American stock markets. The third quarter limped to the finish line, leaving the fourth quarter with the challenges of higher interest rates in Canada and the US, as well as a slowing economy in Canada.

Despite the indexes ending the third quarter with a whimper, these declines occurred after a strong run-up in the first half of the year. Hopefully the third quarter was just a breather before a strong bull run in the fourth quarter to finish out 2023. 😊

Back to Table of Contents


Third Quarter Portfolio Update

Like the bull market, the portfolios did not make it through the third quarter unscathed.

Quarterly Portfolio & Index performance
Third Quarter 2023 (April 1 – June 30) Portfolio & Index performance

Portfolio 1 for the third quarter: DOWN Red Down Arrow

The third quarter started off on the right foot for Portfolio 1 but trended downward before dropping into negative territory for September.

Activity: bought shares in Cameco, Indie Semiconductor, Navitas Semiconductor. Received shares in Liberty Media – Atlanta Braves Holdings, and Liberty Media – Sirius XM Group as part of a split off by Liberty Media’s Formula 1 Group. Sold DocuSign, EnWave Corporation, and ZIM Integrated Shipping Services.

Portfolio 1: Third Quarter 2023 Performance

Back to Table of Contents

Portfolio 2 for the third quarter DOWN Red Down Arrow

Portfolio 2 started well enough before taking two straight monthly declines.

Activity: bought shares in SmartCentres Real Estate Investment Trust and bought additional shares of Telus.

Portfolio 2: Third Quarter 2023 Performance

Back to Table of Contents

Portfolio 3 for the third quarter DOWN Red Down Arrow

Portfolio 3 followed the same pattern as the other portfolios with a decent monthly gain to start the quarter before a sizable drop to end the quarter.

Activity: bought shares in SmartCentres Real Estate Investment Trust, and Lithium Americas.

Portfolio 3: Third Quarter 2023 Performance

Back to Table of Contents


Nine Month Review

For the first nine months of 2023, the TSX (SPTSX) is up 0.8%, the S&P (SPX) gained 11.7%, the DJIA (INDU) rose 1.1% while the Nasdaq (CCMP) advanced 26.3%.

Bull market. A good week for the North American stock markets. As shown in the chart above, despite a disappointing third quarter, all four indexes remain in the green for the year, even if barely in the green as is the case with the TSX and the DJIA. Growth stocks and the AI boom powered the market for the first half of the year. However, the “higher for longer” interest rates of the third quarter (as the higher rates are referred to) have brought growth stocks back to earth and caused many investors to move to safer government bonds.

Tailwinds of the North American stock markets include:

  • Strong Corporate Earnings: Many companies, particularly in the technology and energy sectors, posted strong earnings reports exceeding analyst expectations, boosting investor confidence and driving stock prices upwards.
  • Resilient Consumer Spending: Despite inflation concerns, consumer spending remained relatively stable throughout the first nine months, supporting economic growth and market optimism.
  • Central Bank Policy: The BoC’s and the Fed’s cautious approach to raising interest rates aimed to manage inflation and slow down their respective economies without sending them into a recession. This helped maintain market stability.
  • Technological Innovation: Continued advancements in various fields, especially artificial intelligence (AI) fueled investor interest in technology stocks, contributing to their outperformance.
  • Geopolitical Stability: War still raged in Ukraine, and the US and China settled into a new cold war. However, the world had adapted to this situation and compared to previous years, the geopolitical environment was relatively less turbulent in 2023. This provided a more favorable climate for investment.

The first nine months of 2023 saw investors move into companies demonstrating long-term growth potential, and sustainability, influencing market dynamics. Value stocks also came back into favor as investors sought stability and undervalued assets during times of market volatility. From an investor point of view, energy company shares fuelled (pun intended 😊) by rising oil prices helped broaden the gains beyond the technology companies.

Another headwind of investing in 2023 was the US benchmark interest rates reached their highest level in 22 years in 2023, reached a peak of 5.5%. In Canada, the benchmark rate climbed to 5.0%, its highest since 2008. These significant increases impacted consumers and businesses across all sectors, leading to increased borrowing costs and dampening economic activity. As a result, many investors began shifting their investments from stocks to safer assets like government bonds, seeking stability and protection from market volatility.

In Canada and the US, the higher interest rates caused government bond yields to remain high. When bonds offer more attractive yields than equities, investors tend to favor them because they are safer and less risky. That can weigh on stock prices which can send the markets lower. However, its likely that both the BoC and the Fed will maintain their current Interest rates throughout the remainder of the year.

While the nine months ended with disappointing third quarter performance, the good news is that the markets were still in positive territory and in a much better place than they were a year ago.

Back to Table of Contents

Nine Month Portfolio Review

Bull market. A good week for the North American stock markets. As with indexes, the Portfolios withstood a challenging third quarter and remain solidly in the green. 😊 As depicted in the chart below, only the Nasdaq outperformed all three Portfolios. Due to all three Portfolios bias towards technology companies, the impressive performance by technology stocks, particularly the so called “Magnificent 7” companies, continues to increase the value of the portfolios.

Nine Month Portfolio & Index performance
Nine Month (January 1 – September 30) Portfolio & Index performance

Back to Table of Contents


Looking forward

The fourth quarter offers a fresh start after a challenging third quarter, particularly September. However, much of the investor excitement that fueled markets earlier this year has waned. The “Magnificent 7” technology stocks, once leading the charge, now face a slowdown as the AI hype fades. Additionally, neither central bank shows any signs of reducing interest rates soon, further dampening enthusiasm.

Economic headwinds loom large in the US, including the resumption of student loan payments, the auto workers strike, and the potential for another government shutdown. These factors could lead to lower consumer spending and impact America’s fourth-quarter Gross Domestic Product (GDP).

In Canada, slumping oil prices and lower earnings within the major banks (due to increased cash reserve requirements) pose significant challenges for the TSX. Energy and banking sectors combined represent over 31% of the index, making their participation crucial for any significant upward movement.

Technology companies, particularly the “Magnificent 7,” were instrumental in the first half’s market surge and continue to contribute to overall gains. These seven companies, representing a substantial 28% of the S&P’s market capitalization, highlight their considerable influence. However, their upward momentum has stalled recently, particularly in September. This pullback could present a buying opportunity for investors seeking long-term growth potential in these and other growth-oriented companies.

The future of the North American stock markets depends on numerous factors, including the global economic outlook, geopolitical developments, and the future monetary policy decisions of the BoC, and more importantly, the Fed. While uncertainties remain, continued technological innovation, potential economic growth, and the focus on sustainability offer promising opportunities for future market performance.

The fourth quarter will likely be shaped by continued uncertainty about interest rates and the global economy. However, the strong performance of certain sectors, such as energy and technology, offers hope for potential gains in the remainder of the year. For the 2023 rally to continue, broader sector participation and inclusion of mid and small-cap stocks are crucial.

Perhaps the biggest question for the next quarter and the new year is what the central banks will do with interest rates. Despite their strong rhetoric, I believe interest rates may have peaked. The larger question is when they will start to lower them, a move eagerly awaited by investors as it could lead to renewed confidence and optimism, potentially driving the markets higher.

After two bullish quarters, the third quarter saw the bears make an appearance. Here is hoping to a return of the bull in the fourth quarter. 😊

Bull market

Back to Table of Contents