Items that may only interest or educate me ….
Canadian Economic news, US Economic news, Canadian deficit increases, …
Canadian Economic news
This past week’s key economic data that the Bank of Canada (BoC) considers when deciding whether to raise or lower the interest rate.
Interest rates remain at 5%
As anticipated, the BoC opted to maintain the interest rates at 5.0%, stating the previous increases have started to slow the economy. The BoC emphasized that another rate hike is still possible if inflation does not continue to fall towards its 2% target. However, many analysts believe the central bank is finished with rate hikes, allowing the effects of the previous hikes to continue to work their way through the economy.
After raising the benchmark rate 10 times since March 2022, the BoC has kept it at 5% for the past two meetings. Currently, the cost of living, as measured by the Consumer Price Index (CPI), stands at 3.8%. Other than a brief spike in CPI in August, the inflation rate has continued to fall since a high of 8.1% in June 2022, as shown in the Statistics Canada chart below. The BoC expects inflation to stay around 3.5% until next summer, and then drop to 2.5% by late 2024.
The BoC noted the slowing demand for housing, goods, and services, as well as a reduction in business investment. These are all good reasons for the bank to keep its benchmark rate on hold. They also said that supply and demand are almost in balance, but they still want to see core inflation (CPI without the volatile food and gas prices) continue to fall.
Among the risks to falling inflation are war in the Mid East that could lead to the higher oil prices, and weather events that could impact food supplies and disrupt supply chains. As well, continued wage growth and sticky core inflation that remains close to 4% are also obstacles to inflation returning to the 2% target.
The BoC was in a difficult position. If they lower the key rate, inflation could accelerate. If they raise the rate, they could trigger financial hardships for consumers and businesses.
With minimal economic growth, sluggish retail sales, and rising unemployment, the BoC opted to maintain the current rate of 5%, while warning about the possibility of an additional rate hike.
Analysts suggest that Canada could be on the brink of a recession or stagflation due to the lagged impact of the aggressive rate increases. Stagflation is a mix of stagnating, or slow, growth and heightened inflation, a toxic combination for the economy.
My takeaway: do not expect lower interest rates any time soon, even with a slowing economy. ☹
Canadian market volatility
The Canadian Volatility Index (VIXC), as measured by the TSX 60 VIXI, ended the week at 18.14, up from last week’s reading of 17.09. Market volatility in the Canadian stock market increased slightly but remains below 20. A Canadian VIX reading above 20 is considered high, while a Canadian VIX reading below 20 is considered to be low.
US Economic news
This past week’s key economic data points that the Federal Reserve (Fed) considers when deciding whether to raise or lower the interest rate.
Personal Consumption Expenditures
The Commerce Department announced September’s Personal Consumption Expenditures (PCE) price index. The PCE measures the cost of goods and services and is closely watched by economists and investors because it is a broad measure of inflation that includes both goods and services, and it is less volatile than other measures of inflation, such as the Consumer Price Index (CPI). However, the Fed prefers the core PCE price index, which excludes the volatile food and energy components, because it is a better indicator of underlying inflation trends.
In September, the PCE increased by 0.4%, following a similar rise in August. Year over year, the PCE showed a 3.4% increase, slightly down from the previous month’s 3.5%. Analysts had anticipated gains of 0.3% and 3.4%, respectively. The rise in the PCE was driven by increased spending on goods, particularly new and used vehicles, and services, with consumers investing more in international travel.
Core PCE accelerated to a 0.3% gain, after a 0.1% increase in August. In the 12 months through September, the core PCE slowed to a 3.7% rate of growth, after a 3.9% rise in August. Both the monthly and yearly core PCE estimates were in line with analysts’ estimate. Being the Fed’s preferred measure of inflation, it is closely tracked as they prepare for next week’s meeting to update the monetary policy (which decides the interest rate).
The monthly readings showed the cost of living had increased, however, the annual readings showed inflation continues to trend downward. This is good news for consumers as it indicates their purchasing power is not falling as quickly as it has been. It is also good news for us investors as the Fed will take note of the downward trend as they head into next week’s monetary policy meeting.
Hopefully, the Fed will decide to leave the benchmark rate at 5.5% and let the higher rate continue to trickle down through the economy. However, the Fed’s decision is not based on the PCE data alone. Other economic data has shown the US economy, as measured by Gross Domestic Product (GDP), and employment both remain strong, and inflation is still well above the Fed’s 2% target rate.
Gross Domestic Product
The Commerce Department’s advance estimate for the third quarter GDP increased more than expected at an annual rate of 4.9%. Analysts had expected an increase of 4.3%. An advance estimate is based on “source data that are incomplete or subject to further revision by the source agency”, and a more accurate, or second, estimate will be provided in late November.
This is the fastest pace of growth since the first quarter of 2022. The growth was driven by strong consumer spending, business investment, and government spending.
The Fed expects spending to slow in the fourth quarter given the ongoing United Auto Workers’ strike, the war in the Middle East, and another possible government shutdown in November.
Consumer Sentiment Index
The University of Michigan’s Consumer Sentiment Index (CSI) final results for October dropped slightly to 63.8 at the end of October, following a reading of 67.9 in September. It was a drop of 6.0% after being relatively stable for the previous two months. Year over year, the CSI increased by 6.5% from 59.9 in October 2022.
The monthly drop was a result of concerns over higher inflation and what was happening in the US and globally. However, the consumer sentiment is still significantly higher than it was a year ago.
American market volatility
During the week, the CBOE Volatility Index (VIX) reached 21.27, down from 21.71 last week. The lower reading suggests a decrease in the perceived volatility of the American markets.
Canada’s deficit increases
The Canadian government announced a $4.3 billion budget deficit for the first five months of the 2023/2024 fiscal year. The government’s revenue increased by 1.4% since April due to higher interest revenues and other non-tax revenues. However, the government’s program expenses increased by 4.8% during the same period. The primary reasons for the increased expenses include higher spending on climate change initiatives and on social programs, such as healthcare and education.
As a result of the deficit, Canada’s public debt charges have grown by $4.1 billion, or 27.7%, due to rising interest rates.
While the deficit is smaller than expected, its implications are significant, particularly in the long term. The government will likely continue borrowing to maintain operations, leading to a higher national debt. To address this mounting debt, it may necessitate either tax hikes or cut spending cuts; based on the last few years, the former has been this government’s preferred option. However, this increased debt could potentially harm the Canadian economy, reducing economic growth and pushing up interest rates.
Fortunately, the Canadian economy is relatively strong, and the deficit is not expected to have a significant negative impact on the economy.
It was not a great week in the North American stock markets. Let’s see what caused the markets to fall this past week….
Weekly Market Review
Monday: It was a mixed day to open the week. The Nasdaq Composite Index (Nasdaq) was the only index to end the day higher, while the Toronto Stock Exchange Composite Index (TSX), the S&P 500 Index (S&P), the Dow Jones Industrial Average (DJIA) all ended slightly lower. Investors are waiting for a few key economic reports that come out later this week to get a sense whether the Fed will hold the line or increase their benchmark rates.
In Canada, a drop in oil and other commodity prices led to sell off in resource-based companies as investors took profits after a run up in share prices last week. Later this week the BoC will announce its latest update on the benchmark rate. In trading, the defensive sectors Utilities, Telecommunications Services and Consumer Staples were the only ones to end higher. Basic Materials (miners and fertilizer manufacturers) and Healthcare had the biggest declines.
In the US, government bond yields briefly touched 5% before falling off as investors wait for third quarter reports from some of the big-name companies this week. Nearly a third of companies in the S&P report this week. The S&P closed at its lowest point since the end of May, and the DJIA notched its fourth straight day of losses. In trading, Nasdaq mainstays Technology and Consumer Cyclicals were the only two sectors to end higher, while Energy and Basic Materials had the biggest declines.
Tuesday: a mostly upbeat day in the markets with all three American indexes ending in the green as investors await the latest earnings reports from a few of the big technology companies. The TSX was the only major North American index to end in the red today. Oil prices fell after weak economic data out of Europe led to concerns of lower demand.
In Canada, the TSX fell to its lowest point in a year as oil and other commodity prices continued to pullback after last week’s surge. Tomorrow, the BoC will announce its latest decision on Canada’s benchmark interest rate. Many analysts expect the BoC to leave the rate at 5.0% but are concerned the Fed may raise its rate. A mixed day in the Canadian sectors with half the sectors in the green, led by Technology and Telecommunications Services, and the other half in the red, with Energy and Industrials the biggest losers.
In the US, investor optimism about third quarter earnings led to a surge in the interest rate sensitive mega cap technology companies, pushing the Nasdaq and S&P firmly higher. The DJIA was also lifted by a broad-based rally in the American stock markets. In trading, Telecommunications Services and Utilities posted the biggest gains while Energy was the only sector to end the day lower.
Wednesday: all four indexes ended lower, with the Nasdaq getting hammered after a disappointing quarterly report from Alphabet (NASD: GOOGL). Higher for longer interest rates and disappointing earnings is not a good combination. Investors had been clinging to the hope that the big technology companies would all have strong earnings so when Alphabet faltered the rest of the technology sector got hammered. Elsewhere, China announced new fiscal stimulus measures to boost their economic recovery.
In Canada, the BoC announced they were leaving the benchmark rate at 5%, but left the door open for additional increases if necessary. The bank also forecast slow growth for the economy. As for the TSX, the good news was it was the best performing index for the day. The bad news, the TSX ran its losing streak to six. The TSX is ended the day at its lowest level since October 2021. In trading, Energy and Utilities posted the biggest gains, while Technology and Healthcare had the biggest losses.
In the US, fears of higher for longer interest rates slammed many of the technology companies, pushing the Nasdaq into a market correction, having fallen more than 10% since its high made on July 19. Higher yields on safe government bonds also put pressure on the riskier stocks, especially those in the interest sensitive sectors like technology and consumer cyclicals. In trading, Utilities, Consumer Staples, and Energy were the only American sectors to end in the green. Of the sectors to end in the red, Technology and Consumer Cyclicals ended the deepest in the red.
Thursday: another bleak day in the markets with all four indexes ending lower. Disappointing quarterly reports from many of the big names in technology, and bond yields that continue to rise took their toll on the markets. Oil companies gave back recent gains as oil prices continued to drop.
In Canada, once again the TSX was the best of a bad lot but that was not enough to prevent it from stretching its losing streak to seven, its longest losing streak in five years. Many investors are moving from the higher risk, growth stocks into more defensive sectors or government bonds. In trading, Utilities and Financials recorded the biggest gains, while Technology and Industrials had the biggest drops.
In the US, GDP came in higher than expected suggesting American consumers continue to spend. While this is good news on the surface, it does not help with the Fed’s fight to lower inflation. They want to see a slowing economy and lower spending before they start lowering the interest rate. Given the ‘bad’ news, many investors are rotating out of interest sensitive stocks, such as technology companies, and into low-risk government bonds. In trading, Financials and Utilities posted the biggest gains, while the interest sensitive Technology and Consumer Cyclicals sectors had the biggest losses.
Friday: after two consecutive days with all four indexes ending lower, today was a marginal improvement as the Nasdaq finished in the green. Oil prices rose on increased investor concerns after the US military struck Iranian targets in Syria. Investors now turn their attention to the Fed and next week’s interest rate announcement.
In Canada, the TSX continues its downward trend as oil prices continue to fall. It was a day of broad-based losses in the Canadian sectors. Basic Materials was the only sector to end higher, while Consumer Cyclicals and Financials suffered the biggest losses.
In the US, early morning rallies in the Nasdaq and S&P fizzled in afternoon trading with the S&P joining the DJIA in the red, while the Nasdaq was able to remain in the green at the end of the day. The Nasdaq was buoyed by a better-than-expected report from Amazon (NASD: AMZN). The Fed’s favourite inflation metric came in higher than expected, putting downward pressure on the markets and increasing the likelihood of an increase to the interest rate. Mixed results from the big technology stocks also contributed to the fall. In trading on Wall Street, Consumer Cyclicals, Technology and Basic Materials were the only sectors to end in the green, while Telecommunications Services and Healthcare were the deepest in the red.
Weekly Market and Portfolio Review
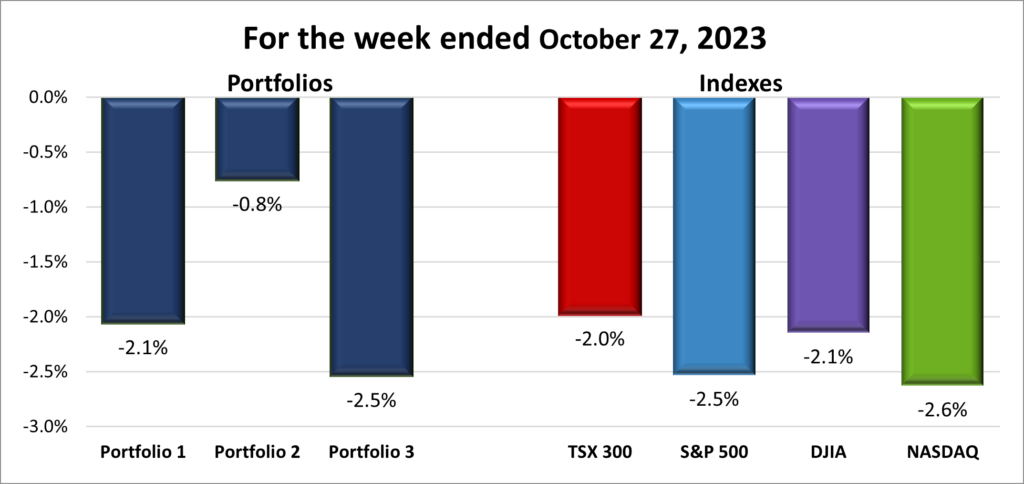
For the week, the TSX (SPTSX) lost 2.0%, the S&P 500 (SPX) fell 2.5%, the DJIA (INDU) slipped 2.1% and the Nasdaq (CCMP) declined 2.6%.
![]() Another week with all four major indexes firmly in the red, as shown above. Actually, it has been only the last two weeks that all were in the red, it just feels like it has been longer. The Magnificent 7 which led the Nasdaq and S&P rallies in the first half of the year, are now dragging them down into market ‘correction’ territory, with both indexes down over 10% since their respective highs in July. If it was not for Amazon’s stellar earnings report this week, it would have been worst. The DJIA did not fair much better as it sank to its worst level in nearly five months and is in the red for the year to date. Canada’s TSX dropped to its lowest point all year, marking a drop of 3.5% since the start of the year.
Another week with all four major indexes firmly in the red, as shown above. Actually, it has been only the last two weeks that all were in the red, it just feels like it has been longer. The Magnificent 7 which led the Nasdaq and S&P rallies in the first half of the year, are now dragging them down into market ‘correction’ territory, with both indexes down over 10% since their respective highs in July. If it was not for Amazon’s stellar earnings report this week, it would have been worst. The DJIA did not fair much better as it sank to its worst level in nearly five months and is in the red for the year to date. Canada’s TSX dropped to its lowest point all year, marking a drop of 3.5% since the start of the year.
So far, October has lived up to its reputation for volatility and this week was no better. This week’s falter was largely the result of a continuing surge in the yields of government bonds, geopolitical uncertainty, and mixed earnings reports, especially those from the Magnificent 7. With the majority of companies having reported, next week investors’ focus will be split between earnings, Apple in particular, and economic news. In the US, there will be the latest monetary policy (interest rate) update from the Fed, followed by the October jobs reports. From the GDP report mentioned earlier in this post, we know the US economy remains strong, but what about Canada? We will find out next week when the GDP data for August is released.
![]() As for the portfolios, all three dropped again this week. ☹ It is difficult to post a win when all four indexes are down at least 2%, as shown in the chart below. In Portfolio 1, an impressive quarterly report from Amazon was offset by a disappointing earnings report from Google’s parent Alphabet. While the portfolio was dragged down by the overall market decline, it still outperformed the Nasdaq and S&P. Portfolio 2’s losses were limited by an impressive earnings report from Microsoft. Finally, Portfolio 3 saw the gain from Microsoft wiped out by a loss of 10% in Shopify’s share price, causing the portfolio to be knocked lower by market headwinds.
As for the portfolios, all three dropped again this week. ☹ It is difficult to post a win when all four indexes are down at least 2%, as shown in the chart below. In Portfolio 1, an impressive quarterly report from Amazon was offset by a disappointing earnings report from Google’s parent Alphabet. While the portfolio was dragged down by the overall market decline, it still outperformed the Nasdaq and S&P. Portfolio 2’s losses were limited by an impressive earnings report from Microsoft. Finally, Portfolio 3 saw the gain from Microsoft wiped out by a loss of 10% in Shopify’s share price, causing the portfolio to be knocked lower by market headwinds.
Next week will be the end of October, and hopefully the volatility it brought with it. November is generally a good month for stocks. Mind you, if the Fed boosts the US interest rate it may be another depressing month. We will find out next week.
Companies on the Radar
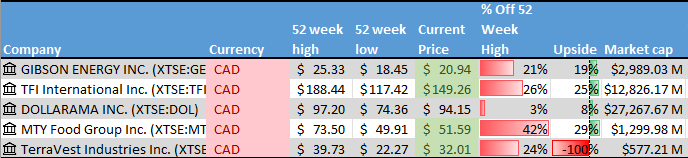
 I was hoping one or two new American companies would come across my radar to add to the five Canadian companies listed below. Unfortunately, none did so the Radar List remains:
- Gibson Energy (TSE: GEI), a small-cap Canadian company specializing in providing liquid infrastructure products and services to the North American energy sector.
- Dollarama (TSE: DOL), a large Canadian company that operates dollar stores across Canada.
- MTY Food Group Inc. (TSE: MTY), a small cap Canadian consumer cyclical company that operates and franchises quick service and casual dining restaurants throughout North America and internationally.
- TFI International Inc. (TSE: TFII), a mid-sized Canadian transportation and logistics company operating across North America.
- TerraVest Industries (TSE: TVK), a small-cap Canadian company that manufactures and sells goods and services to energy, agriculture, mining, and transportation sectors across North America. NOTE: because TerraVest is small cap Canadian company (small caps have a market capitalization in the range of $300 million to $3 billion), it is not followed by any analysts. Therefore, there is no twelve-month price target for this company’s share price.
The Radar Check was last updated October 27, 2023.
Portfolio Update
Portfolio 1
Portfolio 1 for the week ended October 27, 2023: DOWN ![]()
- Nvidia (NASD: NVDA) announced they will start building central processing units, commonly known as CPUs, to run Microsoft’s (NASD: MSFT) Windows operating system. The new CPUs from Nvidia would utilize some of Arm’s (NASD: ARM) technology. Nvidia is known for their Graphics processing Units (GPUs) which are used in artificial intelligence (AI), cloud data centres and gaming applications. Their entry into the CPU can not be good news for Intel (NASD: INTC) who have been the dominant CPU in the Windows environment for over 30 years.
- General Motors (NYSE: GM) lowered their 2023 profit forecast due to the ongoing labour strike. GM said they will slow the production of electric vehicles (EV) to preserve their profit margins rather than sales targets.
In related news from GM, as if to reinforce their plan to slow their production of EVs, GM scrapped plans to jointly build EVs with Honda Motor (NYSE: HMC). Rather than working with Honda on an ‘affordable’ EV, GM decided to focus on their existing Bolt EV line.
In California, the Department of Motor Vehicles (DMV) suspended GM’s Cruise autonomous vehicles from operating without drivers because they deemed the vehicles unsafe for public roads. The DMV said Cruise had misrepresented the safety of the driverless car’s technology and pose an “unreasonable risk to the public.”
As of this post, GM is the only one of the big three North American auto makers to not have a signed agreement with the United Auto Workers union. Ford (NYSE: F) and Stallantis (NYSE: STLA) have both settled, agreeing to a 25% wage increase over 4 ½ years, and other concessions. - It appears Apple (NASD: AAPL) has really bought into the ‘right to repair’ your own devices sentiment. Apple said it will make the parts, tools, and documentation necessary to repair its products available to consumers and third-party repair shops.
Apple lost a patent dispute over a blood oxygen sensor used in its Apple Watch. The US International Trade Commission issued a temporary exclusion order on specific watches and banned them from import into the US. Apple has said they will appeal the decision.
Separately, Apple plans to increase the price of subscriptions for Apple TV+ and Apple News+. - PayPal (NASD: PYPL) has agreed to sell their reverse logistics company Happy Returns to United Parcel Service (NYSE: UPS). Reverse logistics is the process of moving products back through companies’ supply chains when customers return purchases.
- Amazon is creating a “European Sovereign Cloud”, for its European Amazon Web Services (AWS) customers. The unit will be separate from its regular AWS business and will keep data collected in Europe, in their European cloud.
Separately, Amazon’s share price got a nice boost after its most profitable division, AWS, grew its cloud market share thanks to the expanding artificial intelligence market.
Activity
Received interest on TD 1-year cashable GIC.
Dividends
Dividends Received this week for the following companies:
Companies followed by DRIP (Dividend Re-Investment Plan) indicate additional shares were purchased with the dividend. Any cash leftover was added to the cash balance.
Canadian $
BCE Inc (TSX: BCE) DRIP
US $
No US$ dividends this past week.
Quarterly Reports
Visa Inc.
All currency listed in millions of US dollars, except for per share data.
Selected highlights from their fourth quarter 2023 financial results on October 24, 2023
- Revenue of $8,609 for the three months ended September 30, compared to $7,787 for the same period in 2022. An increase of almost 11%.
- Net income of $4,681 for the three months ended September 30, compared to net income of $3,940 in the same period in 2022.
- Diluted earnings per ordinary share of $2.27 for the three months ended September 30, compared to earnings of $1.86 per share for the same period in 2022.
- Revenue of $32,653 for the twelve months ended September 30, compared to $29,310 for the same period in 2022. An increase of over 11%.
- Net earnings of $17,273 for the twelve months ended September 30, compared to net earnings of $14,957 in the same period in 2022.
- Diluted earnings per ordinary share of $8.28 for the twelve months ended September 30, compared to earnings of $7.00 per share for the same period in 2022.
Alphabet Inc.
All currency listed in millions of US dollars, except for per share data.
Selected highlights from their third quarter 2023 financial results on October 24, 2023
- Revenue of $76,693 for the three months ended September 30, compared to $69,092 for the same period in 2022. An increase of over 11%.
- Net income of $19,689 for the three months ended September 30, compared to net income of $13,910 in the same period in 2022.
- Diluted earnings per ordinary share of $1.55 for the three months ended September 30, compared to earnings of $1.06 per share for the same period in 2022.
- Revenue of $221,084 for the nine months ended September 30, compared to $206,788 for the same period in 2022. An increase of almost 7%.
- Net earnings of $53,108 for the nine months ended September 30, compared to net earnings of $46,348 in the same period in 2022.
- Diluted earnings per ordinary share of $3.50 for the nine months ended September 30, compared to earnings of $4.16 per share for the same period in 2022.
General Motors Co.
All currency listed in millions of US dollars, except for per share data.
Selected highlights from their third quarter 2023 financial results on October 24, 2023
- Revenue of $44,131 for the three months ended September 30, compared to $41,889 for the same period in 2022. An increase of over 5%.
- Net income of $3,064 for the three months ended September 30, compared to net income of $3,305 in the same period in 2022.
- Diluted earnings per ordinary share of $2.20 for the three months ended September 30, compared to earnings of $2.25 per share for the same period in 2022.
- Revenue of $128,863 for the nine months ended September 30, compared to $113,627 for the same period in 2022. An increase of over 13%.
- Net earnings of $8,026 for the nine months ended September 30, compared to net earnings of $7,935 in the same period in 2022.
- Diluted earnings per ordinary share of $5.72 for the nine months ended September 30, compared to earnings of $4.73 per share for the same period in 2022.
Teledoc Health, Inc.
All currency listed in thousands of US dollars, except for per share data.
Selected highlights from their third quarter 2023 financial results on October 24, 2023
- Revenue of $660,238 for the three months ended September 30, compared to $611,402 for the same period in 2022. An increase of almost 8%.
- Net loss of $57,073 for the three months ended September 30, compared to a net loss of $73,476 in the same period in 2022.
- Diluted loss per ordinary share of $0.35 for the three months ended September 30, compared to a loss of $0.45 per share for the same period in 2022.
- Revenue of $1,941,888 for the nine months ended September 30, compared to $1,769,131 for the same period in 2022. An increase of almost 10%.
- Net loss of $191,478 for the nine months ended September 30, compared to a net loss of $9,849,460 in the same period in 2022.
- Diluted loss per ordinary share of $1.17 for the nine months ended September 30, compared to a loss of $61.09 per share for the same period in 2022.
CN Rail
All currency listed in millions of Canadian dollars, except for per share data.
Selected highlights from their third quarter 2023 financial results on October 24, 2023
- Revenue of $3,987 for the three months ended September 30, compared to $4,513 for the same period in 2022. A decrease of almost 12%.
- Net income of $1,108 for the three months ended September 30, compared to net income of $1,455 in the same period in 2022.
- Diluted earnings per ordinary share of $1.69 for the three months ended September 30, compared to earnings of $2.13 per share for the same period in 2022.
- Revenue of $12,357 for the nine months ended September 30, compared to $12,565 for the same period in 2022. A decrease of almost 2%.
- Net earnings of $3,495 for the nine months ended September 30, compared to net earnings of $3,698 in the same period in 2022.
- Diluted earnings per ordinary share of $5.27 for the nine months ended September 30, compared to earnings of $5.34 per share for the same period in 2022.
Amazon.com, Inc.
All currency listed in millions of US dollars, except for per share data.
Selected highlights from their third quarter 2023 financial results on October 26, 2023
- Revenue of $143,083 for the three months ended September 30, compared to $127,101 for the same period in 2022. An increase of almost 13%.
- Net income of $9,879 for the three months ended September 30, compared to net income of $2,872 in the same period in 2022.
- Diluted earnings per ordinary share of $0.94 for the three months ended September 30, compared to earnings of $0.28 per share for the same period in 2022.
- Revenue of $404,824 for the nine months ended September 30, compared to $364,779 for the same period in 2022. An increase of almost 11%.
- Net earnings of $19,801 for the nine months ended September 30, compared to a net loss of $3,000 in the same period in 2022.
- Diluted earnings per ordinary share of $1.89 for the nine months ended September 30, compared to a net loss of $0.29 per share for the same period in 2022.
Portfolio 2
Portfolio 2 for the week ended October 27, 2023: DOWN ![]()
- Disney (NYSE: DIS) is in the process of selling its India assets to Indian company Reliance Industries, their biggest competitor in the Indian market.
- Telus’s (TSE: T) ‘Pollinator Fund’ for Good invested in three clean technology startup companies. Climate Robotics is using robotics and AI to improve the health of agricultural soil. erthos is developing a plant-based resin alternative to traditional plastic. Finally, Plentify is a smart energy company that uses AI and IoT (Internet of Things) technologies to connect household appliances to cheaper, and more reliable energy.
Activity
No significant activity to report this week.
Dividends
Dividends Received this week for the following companies:
Companies followed by DRIP (Dividend Re-Investment Plan) indicate additional shares were purchased with the dividend. Any cash leftover was added to the cash balance.
No dividends this past week.
Quarterly Reports
Microsoft Corporation
All currency listed in millions of US dollars, except for per share data.
Selected highlights from their first quarter 2024 financial results on October 24, 2023
- Revenue of $56,517 for the three months ended September 30, compared to $50,122 for the same period in 2022. An increase of almost 13%.
- Net income of $22,291 for the three months ended September 30, compared to net income of $17,556 in the same period in 2022.
- Diluted earnings per ordinary share of $2.99 for the three months ended September 30, compared to earnings of $2.35 per share for the same period in 2022.
Mitek Systems, Inc.
All currency listed in thousands of US dollars, except for per share data.
Selected highlights from their third quarter 2023 financial results on October 26, 2023
- Revenue of $43,070 for the three months ended September 30, compared to $39,195 for the same period in 2022. An increase of almost 10%.
- Net loss of $428 for the three months ended September 30, compared to a net loss of $215 in the same period in 2022.
- Diluted loss per ordinary share of $0.01 for the three months ended September 30, compared to earnings of $0.00 per share for the same period in 2022.
- Revenue of $134,896 for the nine months ended September 30, compared to $105,178 for the same period in 2021. An increase of over 28%.
- Net earnings of $9,471 for the nine months ended September 30, compared to net earnings of $3,344 in the same period in 2022.
- Diluted earnings per ordinary share of $0.20 for the nine months ended September 30, compared to earnings of $0.07 per share for the same period in 2022.
Fortis Inc.
All currency listed in millions of Canadian dollars.
Selected highlights from their third quarter 2023 financial results on October 27, 2023
- Revenue of $2,719 for the three months ended September 30, compared to $2,553 for the same period in 2022. An increase of almost 7%.
- Net income of $445 for the three months ended September 30, compared to net income of $371 in the same period in 2022.
- Diluted earnings per ordinary share of $0.81 for the three months ended September 30, compared to earnings of $0.68 per share for the same period in 2022.
- Revenue of $8,632 for the nine months ended September 30, compared to $7,875 for the same period in 2021. An increase of almost 10%.
- Net earnings of $1,275 for the nine months ended September 30, compared to net earnings of $1,094 in the same period in 2022.
- Diluted earnings per ordinary share of $2.32 for the nine months ended September 30, compared to earnings of $2.01 per share for the same period in 2022.
Portfolio 3
Portfolio 3 for the week ended October 27, 2023: DOWN ![]()
- Enghouse Systems (TSE: ENGH) increased its partnership with Intertec Systems to provide enterprise video management, contact center and fleet management transportation solutions to the Mid Eastern market. Together they will provide solutions to industry sectors such as health care, government, retail and legal.
Enghouse also increased its relationship with Voxtron Middle East LLC to allow Voxtron to resell Enghouse’s Contact Center as a Service (CCaaS) solutions and bundle services around the Enghouse product.
Activity
No significant activity to report this week.
Dividends
Dividends Received this week for the following companies:
Companies followed by DRIP (Dividend Re-Investment Plan) indicate additional shares were purchased with the dividend. Any cash leftover was added to the cash balance.
Canadian $
goeasy Ltd (TSE: GSY)
US $
No US$ dividends this past week.
Quarterly Reports
Microsoft Corporation
See report under Portfolio 2.