First half review
After two years of the stock markets being dominated by Covid-19 related issues (inflation, supply chain, etc.), the first half of 2022 was the bumpiest first half ever for the markets. The four major North American Indexes look like the Canadian flag – lots of red. According to Bloomberg data, over $9 trillion has disappeared from the market since the end of 2021. Other than the Energy sector, no S&P 500 sector has gone unscathed. The ongoing prospects of war and inflation are ominous signs for the rest of the year. Buckle up for more bumps as we head into the second half of 2022.
But the future is impossible to predict so let’s see how the second half of 2022 plays out. In the meantime, lets take a look at the week ended that ended on Canada Day.
Weekly Market Review
Monday: Oil and natural resources lifted the Toronto Stock Exchange Composite Index (TSX) into positive territory. The price of oil rose because the Group of Seven nations announced plans to further tighten the restrictions on Russian oil while at the same time lowering energy prices. That will be a neat trick if they can pull it off – lower the supply of oil while lowering the price of a commodity in high demand.
In the US, all three American Indexes – the S&P 500 Index (S&P), the Dow Jones Industrial Average (DJIA), and the Nasdaq Composite Index (Nasdaq) – ended the day in the red thanks to interest rate sensitive stocks (read growth stocks) dragging down the market, especially the mega cap technology stocks.
Tuesday: The downward trend resumed with all four major North American indexes falling lower thanks to consumer expectations reaching a ten-year low. In Canada, thanks to 4.2% gains in the Canadian Energy sector, the TSX did not drop as much as its American cousins.
In the US, ten of the eleven S&P sectors dropped in a broad-based selloff. The lone winner was the Energy sector. The gains in the Technology sector from the previous week are turning into a bounce rather than upward momentum as the Technology sectors fell the most in both countries, down 2.4% in Canada and down 3.15% in the US.
Wednesday: Oil was down. The Technology sector was down. With that combination, only the DJIA was able to post a gain today. In Canada, with oil prices dropping today, the Canadian Energy sector returned some of the gains it had managed over the last few days.
In the US, both the S&P and the Nasdaq sagged slightly while the DJIA made it into the black. Mega cap technology companies provided a boost but not enough to offset declines in smaller technology companies.
Thursday: For those familiar with The Kings only hit single “This Beat Goes On/Switchin’ to Glide,” let me paraphrase a line from the song, “this beatdown goes on and on and on.” 😊 All four major North American Indexes ended in the red today. June was not a good month for any of the four Indexes, so I will not be sorry to see the end of June 2022. 😊
Fears of inflation continue to unsettle the markets as there were broad based declines in both Canada and the USA. In Canada, every Canadian sector ended lower today and in America, eight of the eleven S&P sectors fell.
Friday: The TSX was closed for Canada Day. However, the US Indexes ended the week on a positive note with all three gaining ground today as American investors prepared for the July 4 long weekend. Unfortunately, Friday’s rally was not enough to offset another down week. On the positive side, the start of the second half of the year got off to a positive start. 😊 It was a broad-based rally, with all eleven S&P sectors finishing higher.
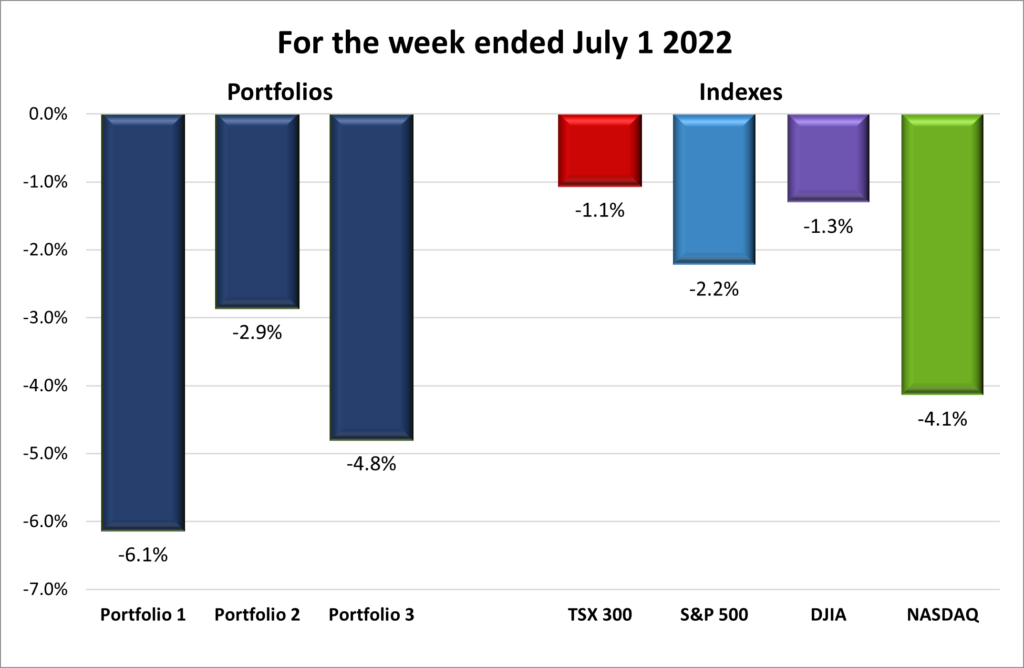
For the week, the TSX was down 1.1%, the S&P declined 2.2%, the DJIA fell 1.3%, and the Nasdaq dropped 4.1%.
Month of June
For the month, all four major North American stock indexes finished the month in negative territory. The TSX fell 9%, the S&P dropped 8.4%, the DJIA declined 6.7%, and the Nasdaq fell 8.7%.
Second Quarter
TSX had its worst quarterly performance since the pandemic slump in 2020. All three American indexes had their second straight losing quarter. The last time that happened for the S&P and the DJIA was in 2015, while the Nasdaq had not done that trick since 2016.
For the second quarter, the TSX was down 13.8%, the S&P fell 16.4%, the DJIA dropped 11.2%, and the Nasdaq plummeted 22.4%. Ouch!
First-half 2022
Clubber Lang could not have described the first half of 2022 any better – pain! The first half of 2022 definitely was painful, especially if you have a growth-oriented portfolio. The TSX performed the best thanks to its heavy weighting of energy and natural resource companies, however that was not enough to stop the TSX from a market correction (a drop of more than 10% from its recent high). In the US, the S&P had its worst first half in more than half a century, the DJIA had its biggest first half drop since 1962, and the Nasdaq simply had had its worst-ever first-half performance.
For the first half, the TSX was down 11.1%, the S&P fell 20.6%, the DJIA declined 15.3%, and the Nasdaq plummeted 29.5%. Ouch!
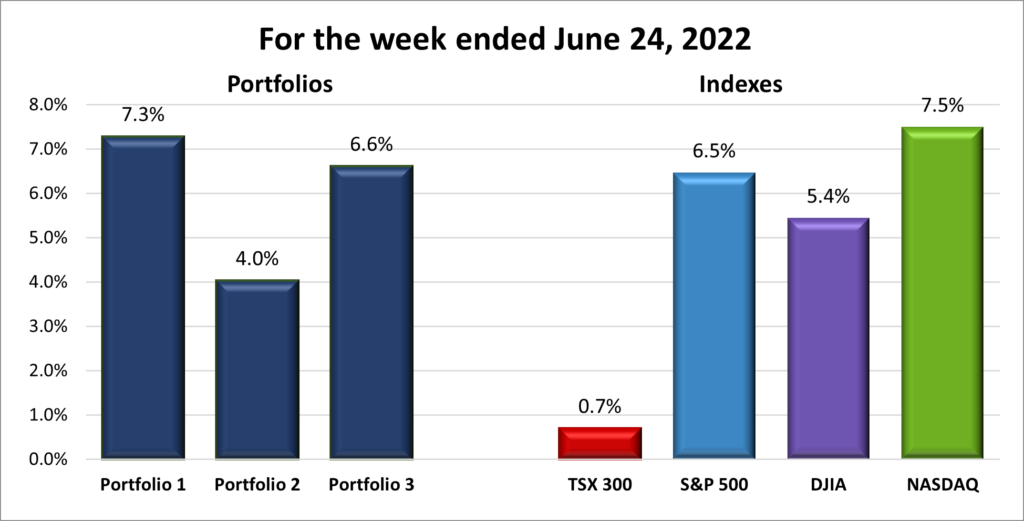
Weekly Portfolio Review
Well that sucked! Once again, all four Indexes ended the week lower. The usual suspects – rising inflation, interest rates that continue to inch upward to fight inflation, ongoing supply chain problems, and war in Ukraine – continue to drag the market lower.
With all four North American Indexes lower, there can be only one direction for the three Portfolios – down. The technology heavy Portfolios 1 and 3 fell the hardest, taking the first and second, respectively for worst performances of the week. If it were not for the Nasdaq dropping more than Portfolio 2, my Portfolios would have won the trifecta for biggest losers of the week. ☹ Unfortunately, there is not much I can do but ride out the storm.
Companies on the Radar
Currently, there is only one companies on the Radar List:
- Amazon (NASD:AMZN): The leader in e-commerce sales, the leader in cloud services (Amazon Web Services), one of the top providers of streaming services through their Prime service; and they quietly have their finger in a number of other pies. I still must perform the Multibagger Analysis deep dive on Amazon but the share price has been beaten down so much its hard to ignore this opportunity.
- Ferrari (NYSE:RACE): I was talking with Rob the web guy about cars we always wanted to own when I said I always wanted a Ferrari. As we continued to talk, it occurred to me that while owning an actual Ferrari was still a long way off, I could buy shares in the company and tell others that I am an owner of Ferrari. 😊 Like all other non energy sector, publicly traded companies in 2022, Ferrari’s share price has taken a tumble. I plan to run it through my Radar Check and go from there.
Portfolio Update
Portfolio 1
Portfolio 1 for the week ended July 1, 2022: DOWN ![]()
- This week, Cruise became the first self-driving ride-hail service to receive a permit to charge for fully autonomous rides in San Francisco. Majority-owned by General Motors (NYSE:GM), Cruise is undercutting Uber’s prices by about 15%, though its rides are limited to 30 miles per hour (mph) during the night from 10pm to 6am.
GM’s CEO, Mary Barra, has suggested that rides could cost less than $1 per mile in the long run, and former Cruise CEO, Dan Ammann, suggested the that its revenues could scale to $50 billion by 2030. To lower costs, we believe Cruise must increase its vehicle utilization rates, which will depend not only on a daytime permit but also on scaling autonomous car units to a level high enough to minimize passenger wait times. - Voyager Digital (TSX:VOYG) announced they were temporarily suspending all transactions (trades, deposits and most importantly, withdrawals) on their platform because of market conditions. Essentially, Voyager is having liquidity issues and cannot afford customers to withdraw their funds or fail to pay back loans. To that end, Voyager issued a notice of default to Three Arrows Capital (a hedge fund) for failure to make required loan payments. Voyager lent 15,250 Bitcoin at the then value of $324 million, plus $350 million in other cryptocurrencies. I am glad I never followed through on opening an account on Voyager but wish I had sold my shares in the company in 2021. ☹
- Pinterest (NYSE:PINS) is getting a new Chief Executive Officer as the current CEO, Ben Silbermann, will be replaced by Google commerce veteran Bill Ready. Analysts suggest that with this change Pinterest will change its business model from being advertising oriented to e-commerce focused. If Pinterest can start to generate revenue anywhere close to Google parent Alphabet (NASD:GOOGL), I will be very happy. Very happy indeed!
- Apple (NASD:AAPL) continues to update its CarPlay software. This time they will allow drivers to purchase gas directly from a screen in the car, avoiding the usual inserting or tapping of a credit card.
- Lattice Semiconductor (NASD:LSCC) won another award. This time it was the Gold Vendor Award from VDC Research in the Processors category. It was the second consecutive win for Lattice in this category.
Activity
No significant activity to report this week.
Dividends
Dividends Received this week for the following companies:
Companies followed by DRIP (Dividend Re-Investment Plan) indicate additional shares were purchased with the dividend. Any cash leftover was added to the cash balance.
Canadian $
Shaw Communications Inc (TSX:SJR.B)
Canadian National Railway Co (TSX:CNR)
US $
No US$ dividends this past week.
Quarterly Reports
Shaw Communications Inc.
All currency listed in Canadian dollars
Selected highlights from their third quarter 2022 financial results on June 30, 2022
- On a year-over-year basis, consolidated revenue decreased by 2.1% to $1.35 billion.
- Net income decreased $151 million, 42.7%, to $203 million due to a revision to liabilities for uncertain tax positions that became statute barred in the prior year, which reduced income tax expense by $125 million and interest expense by $35 million. These decreases in net income were offset by higher adjusted EBITDA compared to a year ago and an $11 million decrease in non-operating costs related to the Rogers-Shaw Transaction.
- Announced a divestiture agreement for the sale of Freedom Mobile to Quebecor to obtain regulatory approval for the merger with Roger Communications.
Portfolio 2
Portfolio 2 for the week ended July 1, 2022: DOWN ![]()
- Telus (TSX:T) agrees to acquire 3 million shares of Telus International (TSX:TIXT) from for US$ 22 per share. In 2021, Telus spun off Telus International. With this purchase, Telus will control 56.17% of Telus International’s outstanding share. Combined with Telus’s 74.78% of Telus international’s outstanding multiple voting shares, Telus will now have control of 72.38% of the outstanding voting rights of Telus International.
- Disney (NYSE:DIS) announced it plans to re-open its Shanghai Disneyland this week after a month-long lockdown of Shanghai. They also announced the launch of their latest cruise ship, The Wish. This is fifth cruise ship to join the Disney navy. According to Disney Chief Executive Officer Bob Chapek, Disney cruises provide the company with a double digit return on investment. Not bad. And there are two more ships scheduled to join the Disney navy in 2025.
Activity
No significant activity to report this week.
Dividends
Dividends Received this week for the following companies:
Companies followed by DRIP (Dividend Re-Investment Plan) indicate additional shares were purchased with the dividend. Any cash leftover was added to the cash balance.
Canadian $
Brookfield Infrastructure Partners LP (TSX:BIP.UN)
Brookfield Infrastructure Corp (TSX:BIPC)
US $
No US$ dividends this past week.
Quarterly Reports
Alimentation Couche-Tard Inc
View on: All currency listed in millions of US dollars
Selected highlights from their fourth quarter 2022 and fiscal year 2022 financial results on June 28, 2022
Highlights for the fourth quarter:
- Revenue of $16,434 compared to $12,237 for the same period in 2021. Up 34.3%
- Gross profit was $2.6 billion for the fourth quarter of fiscal 2022, up by $222.5 million or 9.5%, compared with the corresponding quarter of fiscal 2021, mainly attributable to higher road transportation fuel gross margins in the United States and Canada, improved merchandise and service gross margin, and organic growth in our convenience activities
- Net earnings were $477.7 million compared with $563.9 million for the fourth quarter of fiscal 2021. Down 15.3%. The results for the fourth quarter of fiscal 2022 were affected by a pre-tax impairment loss of $56.2 million resulting from the deconsolidation and impairment of Russian subsidiaries, a pre-tax impairment loss of $33.7 million on our investment in Fire & Flower Holdings Corp., a pre-tax expense of $15.1 million due to a change in the accounting policy relating to cloud computing arrangements, a pre-tax net foreign exchange gain of $3.0 million, as well as pre-tax acquisition costs of $0.9 million.
- Repurchased 5.8% of outstanding shares, reaching the Program’s authorized share repurchase limit.
Highlights for the fiscal year 2022:
- Revenue of $62,809 compared to $45,760 for the same period in 2021. Up 37.3%
- Gross profit increased by $889.5 million, or 8.8%, compared with fiscal 2021, mainly attributable to higher road transportation fuel gross margins in the United States and Canada, higher road transportation fuel demand, the contribution from acquisitions, improved merchandise and service gross margin, organic growth, and the net positive impact of approximately $44.0 million from the translation of our foreign currency operations into US dollars.
- Net earnings of $477.7 compared to $2,683 in 2021. Down 0.8%.
Portfolio 3
Portfolio 3 for the week ended July 1, 2022: DOWN ![]()
- Enghouse Systems Limited (TSX:ENGH) acquired Competella AB, a Swedish provider of SaaS and on-premises contact center and attendant console technologies. Competella, provides a Microsoft Teams based contact centre platform to the Scandinavian and Swiss markets.
- A resolution has been put forward by large institutional investors (managing over $350 billion of assets) in Microsoft (NASD:MSFT) that the company publish financial and tax information for each country outside the US so investors can assess whether it is paying fair taxes and identify any risks posed by tax reforms.
- Brookfield Asset Management (TSX:BAM.A) bought a 2.6% investment in AGL Energy just months after AGL rejected their A$5.4 billion ($3.7 billion) takeover bid. This makes Brookfield the number 4 shareholder.
- goeasy Ltd. (TSX:GSY) announced a $40 million equity investment in Canada Drives, an online car shopping site, as part of a strategic growth plan to capture a growing share of the automotive financing market.
Activity
No significant activity to report this week.
Dividends
Dividends Received this week for the following companies:
Companies followed by DRIP (Dividend Re-Investment Plan) indicate additional shares were purchased with the dividend. Any cash leftover was added to the cash balance.
Canadian $
Brookfield Renewable Corp (TSX:BEPC)
Brookfield Asset Management Inc (TSX:BAM.A)
US $
No US$ dividends this past week.
Quarterly Reports
No quarterly reports this past week.