Last week, I started discussing my process for identifying companies I would like to own, albeit a very, very, small piece of the company. I created a 4-stage process to eliminate companies from consideration relatively quickly while going through the process. These stages of the process are:
- Stage 1 – Radar Check
- Stage 2 – Multibagger Analysis
- Stage 3 – Financial Analysis
- Stage 4 – Scorecard
Last week I described Stage 1 – Radar Check. This is where companies that come to my attention, or get on my radar, are put through a 5-minute, high level look at a company. If the company still looks good after the Radar Check, the company moves on to this week’s topic – Stage 2 – Multibagger Analysis.
Multibagger Analysis
The term ‘multibagger’ originated with one of the best investors of all time – Peter Lynch – where each ‘bag’ symbolizes a 100% increase of your original investment. For example, a one bagger is doubling your original investment, while a five bagger would be 5 times your original investment. The more bags, the better and I want as many multibaggers as possible. 😊
My Multibagger Analysis (MA) is designed to find high growth companies that are utilizing technology to grow their revenues and earnings. The MA provides me with a better understanding of a company’s products, customers, management, culture, and a few financial metrics. There are four steps in this Stage:
- Quick Test
- Deep Dive
- Gut Check
- The Numbers
If a company does not score well in any step, I do not bother going further with my analysis. If the company meets or exceeds the threshold for that section, I proceed to the next step. For example, if a company scores low on the Quick Test, I do not go any further. However, if it meets or exceeds my threshold I proceed to the Deep Dive. The same process occurs going from the Deep Dive to the Gut Check, and from the Gut Check to The Numbers.
Note: It is important to compare apples to apples when comparing scores for both the Quick Test section and the Deep Dive section. For example, since my tests are weighted to prefer growth companies, a high growth technology company like Apple (NASD:AAPL) will score much higher than a mature, slow but steady, dividend paying company like CN Rail (TSX:CNR). For this reason, I complete steps 1 and 2 so I have several relevant companies to compare scores against.
The information I look for is available from the company’s corporate website and can typically be found in the About section, and the Investor Relations section where you can find investor presentations, financial statements, and Information Circulars for companies on the Toronto Stock Exchange or Proxy Statements for companies on the New York Stock Exchange or Nasdaq Stock Exchange. Financial numbers and metrics can also be found in the research section of my TD Direct Investing account, as well as Yahoo Finance.
So, without further ado, lets look at the steps in the Multibagger Analysis.
Quick Test
The Quick Test is a 10-question subset of the Deep Dive and is designed to get more of a feel for the company than the Radar Check. I am looking for: founder led or visionary leadership, such as Apple; are their sales and earnings per share growing; a return on capital of more than 15%; market size; do people enjoy working there (company culture); does the company have a strong competitive advantage (a moat to protect it from other companies stealing its’ market share). Each question receives a 1, .5 or 0. After answering each question the numbers are added up to produce a score out of 10. The threshold is 7.5 but I prefer an 8.5. If the company passes the threshold, I move on to the next step – Deep Dive.
Deep Dive
The Deep Dive is similar to the Quick Test but more in-depth, or a deeper dive (hence the name 😊). Whereas the Quick Test has a maximum of 10 questions, the Deep Dive currently has 85 questions, including the 10 questions from the Quick test. The questions are a mix of objective (for example, is the company founder led?) and subjective (for example, does the company have a loyal, enthusiastic fanbase) questions. Most of the questions receive a score between 0 and 1, however, some questions can receive a negative score (such as, declining sales) or can receive up to 3 points for questions I feel are important.
I’m not going to discuss all 85 questions of the Deep Dive but these are the major sections I’m interested in: products, customers, the company, competitive advantage, management and culture, how the company compares to its industry in regard to financial metrics, and a few questions that provide bonus points and some questions that subtract points if the company is in a high risk situation (such as, accounting irregularities).
The points are added to get a total out of 100. The threshold is 65 points but ideally, I am looking for companies that score above 80. Companies that have scored above 80 include Alphabet (NASD:GOOGL) and Shopify (TSX:SHOP). If a company scores between 65 to 79, I may or may not proceed to the next step. If the company scores above 80, I proceed to the next step, the Gut Check.
Gut Check
After doing a Deep Dive on the company, I should have a good feel for the company. The Gut Check is designed as a breather, like a sober second thought before spending any more time on the company. The Gut Check is four Yes or No questions to help me decide if the company still appeals to me.
- Do I ‘get’ the company? (Y/N)
- Do I think this company can increase its share price at 10x or more within 10 years? (Y/N)
- Will I be excited to own this company for 10 years? (Y/N)
- Is this investment more attractive than buying more of what I already own? (Y/N)
If the answer is No to any of these 4 questions, I stop. If I answer Yes to all four questions, I proceed to the next step, the Numbers.
The Numbers
This section is last because I want to get a sense of the company before looking at the numbers. Here, I’m looking to get a sense of the margins, the profitability, and the value of the company. Once I have these calculations, I compare them to the industry averages and other similar companies. This section is mainly to confirm the image of the company I have developed from the three previous sections.
And with that, the MA is complete, and I should have a very good understanding of the company (if I do not, the company is too hard for me to understand). This does not mean I will rush out and buy shares in the company, only that I have the greenlight to buy shares. The next step is to run the numbers and do some financial analysis, but I will leave that for next time.
For now, lets take a look at the past week….
Weekly Market Review
Monday: The US markets were closed for Memorial Day. However, the Toronto Stock Exchange Composite Index (TSX) was open for business, reaching its highest level in almost four weeks. The TSX was lifted higher on the strength of the Technology and Energy (oil specifically) sectors.
Tuesday: All four major North American markets ended May almost exactly where they started thanks to a late afternoon drop by the S&P which left it less than a point higher than at the end of April. In Canada, the TSX ended seven consecutive days of gains to end the month 0.2% lower than it started the month. The main culprit was a drop in the Energy (oil) and Basic Materials (natural resources) sectors thanks to renewed fears of aggressive rate hikes by the Bank of Canada (BoC).
In the US, it was similar story as the S&P 500 Index (S&P), the Dow Jones Industrial Average (DJIA), and the Nasdaq Composite Index (Nasdaq) all gave back gains from last weeks rally. Comments by the US Federal Reserve suggesting higher interest rates led to a late afternoon decline.
Wednesday: All four Indexes ended down. If I am looking for a silver lining, at least they were only down les than 1%. In Canada, the BoC raised interest rates by 0.5% for the second consecutive time. They also hinted there could be similar hikes coming at a faster pace as they battle to get inflation under control. The higher interest rates caused the Canadian technology sector to drop which offset gains in the Energy and Basic Materials sectors.
In America, fears of a 0.5% interest rate hike continued to cause investors to remain on the sidelines, as the S&P, the DJIA and Nasdaq to all lost ground. Of the eleven S&P sectors, the Energy sector was the only sector to gain ground.
Thursday: A good day for all four Indexes with each gaining a minimum of 1.3%. The TSX rose on the strength of the Basic Materials and Technology (led by Shopify’s 9.6% gain) sectors. The BoC indicated it may have to raise interest rates to 3% or higher to get inflation back down from 6% to their ideal 2% – 3% range.
In the US, the mega cap companies led the Nasdaq and S&P higher. However, trading was relatively light today as investors await the US jobs report. If the jobs report is less than expected, it could be a sign higher interest rates are starting to kick and cool off inflation. If inflation is cooling off, it could be an indicator of how aggressive the Federal Reserve will act for future interest rate hikes. A less aggressive Fed is good news for growth companies.
Friday: One step forward, one step back. All four Indexes ended the day lower after Thursday’s advance. In the US, the unemployment rate held steady and led many to believe that the Fed will proceed with additional aggressive interest rate hike of 0.5% at their next meetings in June and July. As a result, the higher interest rates headwind resumed battering high growth technology companies. Accordingly, the Nasdaq had the sharpest drop, dragged lower by the same mega cap companies that lifted the Nasdaq on Thursday. The S& Energy sector the lone sector not to fallback today.
In Canada, The Energy and Consumer Staples sectors were the lone bright spots, while the Technology and Consumer Cyclicals dropped the most.
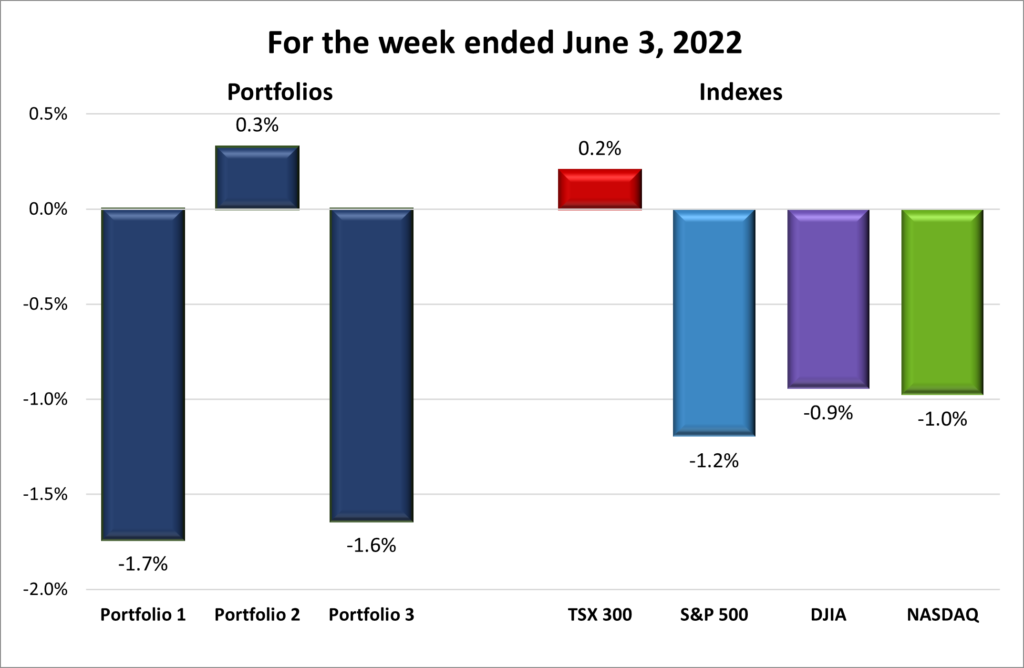
And on that down note, so ends another rollercoaster week. For the week, the TSX was up 0.2%, the S&P fell 1.2%, the DJIA dropped 0.95%, and the Nasdaq declined 0.98%.
For the month, the TSX was down 0.2%, the S&P rose 0.01%, the DJIA gained 0.04%, and the Nasdaq dropped 2.05%.
Weekly Portfolio Review
So much for a winning streak, at least for the American Indexes as all three lost close to 1%. I was hoping last week would see the market bottom, perhaps flatten for a while and then slowly inch upward but it was not to be. The 0.5% interest rate hike by the Bank of Canada, with talks of additional 0.5% hikes to come, along with the US Federal Reserve signalling its intention to raise interest rates 0.5% at least once more caused the share prices of high growth companies to keep falling. In Canada, The TSX is more focused on resource companies and less on technology companies, so the TSX gained a bit this week. Another reason to be diversified and not put all your eggs in one basket.
As for the Portfolios, once again the lower risk Portfolio 2 is the best performer with a gain of 1.2%. Prior to Friday, Portfolios 1 and 3 were looking good but the fears of aggressive interest rate hikes that caused the markets to fall on Friday dragged down both Portfolios. I suspect this will continue to be the way – Portfolio 2 leading the way – until the stock market bottoms out and starts heading upward again. For the next little while, I will have to grin and bear it. And hope for a sooner rather than later return an optimistic marketplace. 😐 (that is a grin and bear it emoji)
Companies on the Radar
No new companies came to my attention this week so the two lists remain the same, although I still need to dig into Alvopetro (TSXV:ALV) to get a better understanding of the company. The other companies in these lists have already gone through my 4-stage research process.
Growth companies on my radar include:
Less volatile companies with reasonable growth:
- Microsoft (NASD:MSFT)
- Apple
- Home Depot (NYSE:HD)
- American Tower (NYSE:AMT)
- Berkshire Hathaway (NYSE:BRK.B)
Portfolio Update
Portfolio 1
Portfolio 1 for the week ended June 3, 2022: DOWN ![]()
NVIDIA (NASD:NVDA) announced that Dell Technologies (NYSE:DELL), Hewlett Packer Enterprise (NYSE:HPE), and Lenovo were amongst a group of computer makers will be using Nvidia’s Grace superchips for the next generation of super computers used for Artificial Intelligence and High-Performance Computing.
Once again, Tesla (NASD:TSLA) CEO is in the news. This time for delicately telling employees to return to the office or you will be considered resigned. “Everyone at Tesla is required to spend a minimum of 40 hours in the office per week. If you do not show up, we will assume you have resigned. The more senior you are, the more visible must be your presence.”
General Motors (NYSE:GM) announced its Buick lineup will be all electric by 2030. In other GM news, Cruise, their line of self driving cars, faces one last hurdle to become the first company to be allowed to charge for self driving rides. The only thing left is to convince San Francisco city officials that driverless taxis are safe.
Crowdstrike is ranked #1 in corporate endpoint security and has captured 12.6% of the endpoint security market. An endpoint is any physical device connected to a network. I like owning shares in companies that are top dog in their market.
Lightspeed (TSX:LSPD) launches their B2B service to connect many of the world’s leading brands and retailers. Retailers will be able to use this platform to order directly from companies in the Lightspeed Commerce system.
Activity
No significant activity to report this week.
Dividends
Dividends Received this week for the following companies:
Companies followed by DRIP (Dividend Re-Investment Plan) indicate additional shares were purchased with the dividend. Any cash leftover was added to the cash balance.
No dividends this past week.
Canadian $
Shaw Communications Inc (TSX:SJR.B)
Quinsam Capital Corp (TSX:QCA)
TMX Group Ltd (TSX:X)
US $
Visa Inc (NYSE:V)
Quarterly Reports
CrowdStrike Holdings, Inc.
All currency listed in US dollars
Selected highlights from their first quarter 2023 financial results on June 2, 2022
- Total revenue was $487.8 million, a 61% increase, compared to $302.8 million in the first quarter of fiscal 2022.
- Net loss attributable to CrowdStrike was $31.5 million, compared to $85.0 million in the first quarter of fiscal 2022.
- Net cash generated from operations was $215.0 million, compared to $147.5 million in the first quarter of fiscal 2022. Free cash flow was $157.5 million, compared to $117.3 million in the first quarter of fiscal 2022.
- Added 1,620 net new subscription customers in the quarter for a total of 17,945 subscription customers as of April 30, 2022, representing 57% growth year-over-year.
- Annual Recurring Revenue (ARR) increased 61% year-over-year and grew to $1.92 billion as of April 30, 2022, of which $190.5 million was net new ARR added in the quarter.
Portfolio 2
Portfolio 2 for the week ended June 3, 2022: UP ![]()
Microsoft has lowered its expected revenues for its fourth quarter. With half of their revenues coming from outside the US, Microsoft has become a victim of the strong US dollar. A stronger US dollar typically lowers the profits of companies with large international operations that must convert foreign currency into US dollars. Microsoft’s foreign subsidiaries collect their sales in the respective local currencies. These are converted to US dollars to roll up into Microsoft’s overall sales. When the US dollar rises compared to other currencies, the foreign currencies end up with less US dollars. So, although sales remain strong, the number of US dollars brought in are less than past quarterly reports, thanks to foreign exchange rates.
Activity
No significant activity to report this week.
Dividends
Dividends Received this week for the following companies:
Companies followed by DRIP (Dividend Re-Investment Plan) indicate additional shares were purchased with the dividend. Any cash leftover was added to the cash balance.
Canadian $
Fortis Inc. (TSX:FTS)
US $
No US$ dividends this past week.
Quarterly Reports
MongoDB, Inc.
All currency listed in US dollars
Selected highlights from their first quarter 2023 financial results on June 1, 2022
- Revenue of $285.4 million, up 57% Year-over-Year.
- Gross profit was $207.2 million for the first quarter fiscal 2023, representing a 73% gross margin compared to 70% in the year-ago period.
- Net loss was $77.3 million, or $1.14 per share, based on 67.7 million weighted-average shares outstanding, for the first quarter fiscal 2023. This compares to a net loss of $64.0 million, or $1.04 per share, based on 61.4 million weighted-average shares outstanding, in the year-ago period.
- During the three months ended April 30, 2022, MongoDB generated $11.6 million of cash from operations, used $2.5 million of cash in capital expenditures and used $0.6 million of cash in principal repayments of finance leases, leading to free cash flow of $8.4 million, compared to free cash flow of $8.4 million in the year-ago period.
Portfolio 3
Portfolio 3 for the week ended June 3, 2022: DOWN ![]()
Brookfield Asset Management (TSX:BAM.A) plans to take public its Brazilian sanitation subsidiary BRK Ambiental. The money raised will be used to expand its operations.
GDI Integrated Facility Services (TSX:GDI) announced that over the next 12 months they plan to purchase up to 500,000 shares for the purpose of cancellation. Given the low share prices in 2022, it is a good time for GDI to buyback its own shares. This is a shareholder friendly move that will increase the earnings per share, albeit only a very small amount.
Activity
No significant activity to report this week.
Dividends
Dividends Received this week for the following companies:
Companies followed by DRIP (Dividend Re-Investment Plan) indicate additional shares were purchased with the dividend. Any cash leftover was added to the cash balance.
Canadian $
Enghouse Systems Ltd (TSX:ENGH)
US $
No US$ dividends this past week.
Quarterly Reports
No quarterly reports this past week.