Decisions, Decisions
This week, all eyes were on the US Federal Reserve (Fed) and the Bank of Canada (BoC) as both central banks faced the same question: should they finally ease up on high interest rates? With inflation cooling, jobless claims ticking higher, and consumers growing cautious, markets were betting heavily on cuts – and both banks delivered. For the Fed, it was the first cut since December 2024, while the BoC hadn’t lowered its benchmark rate since March 2025.
What Happens When Central Banks Cut Rates?
When central banks cut rates, it’s like turning down the interest on your credit card or mortgage – borrowing gets cheaper, and spending gets easier. But depending on whether it’s the BoC, the Fed, or both, the ripple effects for us investors can look a little different.
The Bank of Canada Lowers Rates
Here at home, lower rates usually mean more affordable mortgages, loans, and business borrowing. That can fire up consumer spending and give Canadian companies a boost, with investors often cheering the move.
There’s another layer, though: a rate cut often weakens the Canadian dollar. Exporters love it because their goods look cheaper abroad, but it also makes imports more expensive. For investors, a weaker loonie can make US stocks in your portfolio look more valuable once they’re converted back into Canadian dollars.
The Fed Lowers Rates
When the Fed makes a move, the whole world feels it. Lower US rates mean cheaper borrowing in the largest economy on the planet – and that often sparks a rally in American stocks. Since US markets are the heavyweight in global investing, optimism there tends to spill over everywhere.
For Canadians, there’s a twist: if the Fed cuts rates while the Bank of Canada keeps theirs steady, our dollar (the loonie) can get stronger compared to the US dollar. When that happens, Canadians who own US stocks might see smaller gains once those profits are converted back into Canadian dollars.
Both Central Banks Lower Rates
This week the stars aligned – both the BoC and the Fed cut rates at the same time. That kind of synchronized easing doesn’t happen often, but when it does, it usually gives stocks in both countries a tailwind. Cheaper borrowing fuels growth, and with both currencies moving in step, the loonie doesn’t swing too far one way or the other.
For Canadian investors, that’s often one of the friendliest backdrops around: Canadian holdings get a lift, US stocks ride the wave of Fed optimism, and currency swings don’t bite into returns as much.
The Bottom Line
Rate cuts can be like a shot of caffeine for markets – giving growth a quick jolt and often pushing stocks higher in the short run. But it’s always worth remembering why rates are being cut. If central banks are easing because the economy is losing steam, bumps in the road may still lie ahead. Still, when both central banks ease in sync, history shows it often smooths the ride for portfolios on both sides of the border.
Of course, markets don’t always stick to the script. History suggests synchronized cuts give portfolios a lift – but as we know, history doesn’t always repeat. Let’s see how things actually played out this week. 😊
Items that may only interest or educate me ….
Canadian Economic news, US Economic news, …
Canadian Economic news
This past week’s key economic data that the Bank of Canada (BoC) considers when deciding whether to raise or lower the interest rate.
Consumer Price Index (CPI)
The August CPI brought a surprise dip, with prices falling 0.1% month-over-month after a 0.3% rise in July. Analysts had expected a small 0.1% increase, so the softer number caught investors’ attention. On a yearly basis, inflation ticked up to 1.9% from 1.7% in July, just shy of the 2.0% forecast.
Food costs once again led the gains, climbing 3.4% year-over-year, while gasoline posted the steepest drop, falling 12.7%. Because the decline in gas prices wasn’t as steep as in June, it actually nudged the headline inflation rate slightly higher in July. On a monthly basis, gas prices rose 1.4%, while categories like recreation, education, and reading slipped 1.2%.
Shelter costs, which cover things like rent and mortgages, are proving stubborn. They eased to 2.6% in July from 3.0% in June, but housing expenses usually move more slowly than other prices. For many Canadians, this stickiness in shelter costs keeps the cost of living feeling high, even when overall inflation is cooling.
Core inflation, which strips out more volatile items like food and gas, gives a clearer sense of the underlying trend. In July, it fell 0.2% on the month, while the annual pace slowed to 2.4% from 2.5% in June. That’s edging closer to the BoC’s 2% target, a sign that price pressures are easing beneath the surface.
All told, inflation is still comfortably within the Bank’s 1%–3% target range, though core measures are still a little sticky. That leaves room for rate cuts, but the Bank may be cautious about moving too quickly unless underlying pressures ease further. Still, this report gave investors more confidence that a 0.25% cut was likely at the September 17 meeting – something markets were already betting on.
BoC Rate Decision
The Bank of Canada delivered a widely expected 0.25% cut this week, bringing the benchmark rate down to 2.5%. It’s the first move lower since March 2025, after several meetings on pause.
The decision comes as the economy continues to lose steam. Gross Domestic Product shrank in the second quarter, exports are struggling, and the labour market is softening with unemployment now above 7%. Inflation, meanwhile, is holding within the Bank’s 1%-3% target range, with core measures edging closer to 2% – giving policymakers some room to shift their focus from fighting inflation to supporting growth.
Governor Tiff Macklem pointed to “cracks” in the labour market. Fewer jobs are being created, unemployment is climbing, and wage growth isn’t keeping pace with living costs. A weaker job market usually leads to softer consumer spending – the engine that drives much of Canada’s economy.
Trade is another trouble spot. The US – Canada’s biggest customer, buying about three-quarters of our exports – has pulled back on buying Canadian goods and services. Ongoing trade war tensions, tariffs, and slower US demand have led to a sharp drop in Canadian shipments south of the border. Because Canada leans so heavily on that market, weaker US demand quickly ripples through Canadian businesses, jobs, and investment.
Put together, these cracks in jobs and trade paint a picture of an economy losing momentum, which is why the Bank stepped in with a rate cut to help cushion the slowdown.
For us Canadians, today’s cut means a bit of relief on borrowing costs, especially for anyone carrying variable-rate mortgages or lines of credit. For us investors, though, rate cuts are a mixed bag. Cheaper borrowing costs can give growth-oriented companies a boost, but the Bank’s cautious tone is a reminder that the slowdown is real. Markets are already betting on another cut before year-end, but whether it happens will depend on how inflation trends and whether the job market keeps weakening.
Retail Sales
According to Statistics Canada, July turned out to be a challenging month for Canadian retailers. Sales fell 0.8%, right in line with expectations, after a solid 1.5% gain in June. On a yearly basis, growth also slowed, with sales up 4.0% compared to 6.6% in June.
Eight of nine retail categories saw declines. The one exception was “other motor vehicle dealers” – businesses that sell things like RVs, motorcycles, ATVs, and Jet Skis – which posted a healthy 5.0% jump. On the flip side, sporting goods, hobby, and bookstores had the steepest drop, down 4.5%. Looking at the past year, used car dealers led the way with a 17.0% surge, while gas stations were hit hardest, down 6.5%.
If you strip out the more volatile categories like autos, fuel, and parts, what economists call “core retail sales”, the picture looks weaker. Core sales fell 1.2% in July after a strong 2.2% gain in June, showing that households pulled back on everyday spending like food and clothing. Year over year, core sales were still higher by 4.5%, though growth has cooled from June’s 6.8% pace.
The July dip highlights how stretched consumers are becoming, and if it continues, it could weigh on Canada’s economic growth. The silver lining is that an early estimate for August points to a 1.0% rebound, which could soften July’s blow and keep momentum from slipping further.
Canadian Market Volatility
Canada’s volatility gauge, the S&P/TSX 60 Volatility Index (VIXC), opened the week at 10.39, hovered between 11.5 and 10, and then finished at 9.60. It wasn’t all downhill, though. There was a brief spike to 16 following the release of the August inflation data before quickly dropping below 12, and another jump above 13 after the BoC’s and Fed’s rate decisions.
If you’re new to it, the VIXC is basically a barometer of investor nerves in Canada. When it spikes, it means traders are bracing for bumps ahead, but when it drifts lower, confidence is generally stronger. With the index closing the week near its lows, the mood on Bay Street looked more relaxed than rattled.
US Economic news
This past week’s key data points that the Federal Reserve (Fed) considers when deciding whether to raise or lower the interest rate.
Retail Sales
US consumers kept spending in August, with retail sales rising 0.6%. That’s stronger than July’s 0.5% gain and well ahead of forecasts for just 0.2% increase in sales. Compared with last year, sales were up 5.0%, showing consumers are still carrying a lot of the economic weight.
Sporting goods, hobbies, music, and bookstores posted a healthy 0.8% jump, while furniture and home furnishings slipped 0.3%. Looking over the past year, spending at miscellaneous retailers surged 10.7%, but building materials and garden supplies saw sales fall 2.3%.
Core retail sales – which exclude autos, parts, and gasoline – rose 0.7% in August, easily topping July’s 0.2% increase, and the year-over-year pace accelerated from 4.4% to 5.4%.
Part of the increase in consumer spending may reflect shoppers moving up purchases to get ahead of expected tariff-driven price hikes, meaning some demand is being “pulled forward.” Some of the rise in retail sales is also likely due to higher prices rather than more items being bought – inflation makes purchases cost more, which boosts nominal sales. Still, the strength in consumer spending sends mixed signals to the Fed. On one hand, it shows the economy isn’t rolling over; on the other, it keeps inflation risks alive. That probably rules out a large rate cut, though a smaller 0.25% trim is still very much on the table, especially as the labour market shows signs of cooling.
Federal Open Market Committee (FOMC) Decision
As widely expected, the Fed announced a 0.25% interest rate cut, lowering the benchmark rate to 4.00%–4.25%. This marks the first reduction since December 2024, signaling a shift in the Fed’s approach to economic challenges. Even more encouraging for investors, the Fed expects two more cuts before the end of the year.
Fed Chair Jerome Powell described the move as a “risk management” decision, highlighting concerns over a cooling labour market and slightly elevated inflation. Job gains have slowed, unemployment has edged up, and the Fed is carefully balancing the need to support employment while managing inflation risks.
Historically, FOMC votes are often unanimous or near unanimous. This time, the committee voted 11–1 in favor of the 0.25% cut, with newly appointed member Stephen Miran dissenting. Miran, a Trump appointee confirmed just days before the meeting, advocated for a larger 0.5% reduction.
Cheaper borrowing costs help US consumers (loans, credit cards, mortgages) and businesses (expansion, hiring). For Canada, increased US spending and corporate activity can boost exports and equities, especially in growth and industrial sectors, though trade tensions may limit the upside. Canadian investors may see indirect gains from lower financing costs and stronger cross-border demand.
American Market Volatility
The CBOE Volatility Index (VIX), better known as the market’s “fear gauge,” had a bit of a rollercoaster this week. It started at 14.74, spiked to 16.68 right before the Fed’s rate decision, and then slid back under 15 once investors exhaled on the news. The calm didn’t last long, though – the VIX climbed above 16 again as markets waited for updates from the Trump–Xi phone call, before finally settling at 15.46.
Think of the VIX as a market mood ring. When it’s in the 12 to 20 range, investors are generally calm and steady. Once it pushes higher, it’s a sign traders are growing uneasy and bracing for bumpier days ahead. A rising VIX doesn’t always mean panic, but it does mean caution is creeping back into the market.
Weekly Market and Portfolio Review
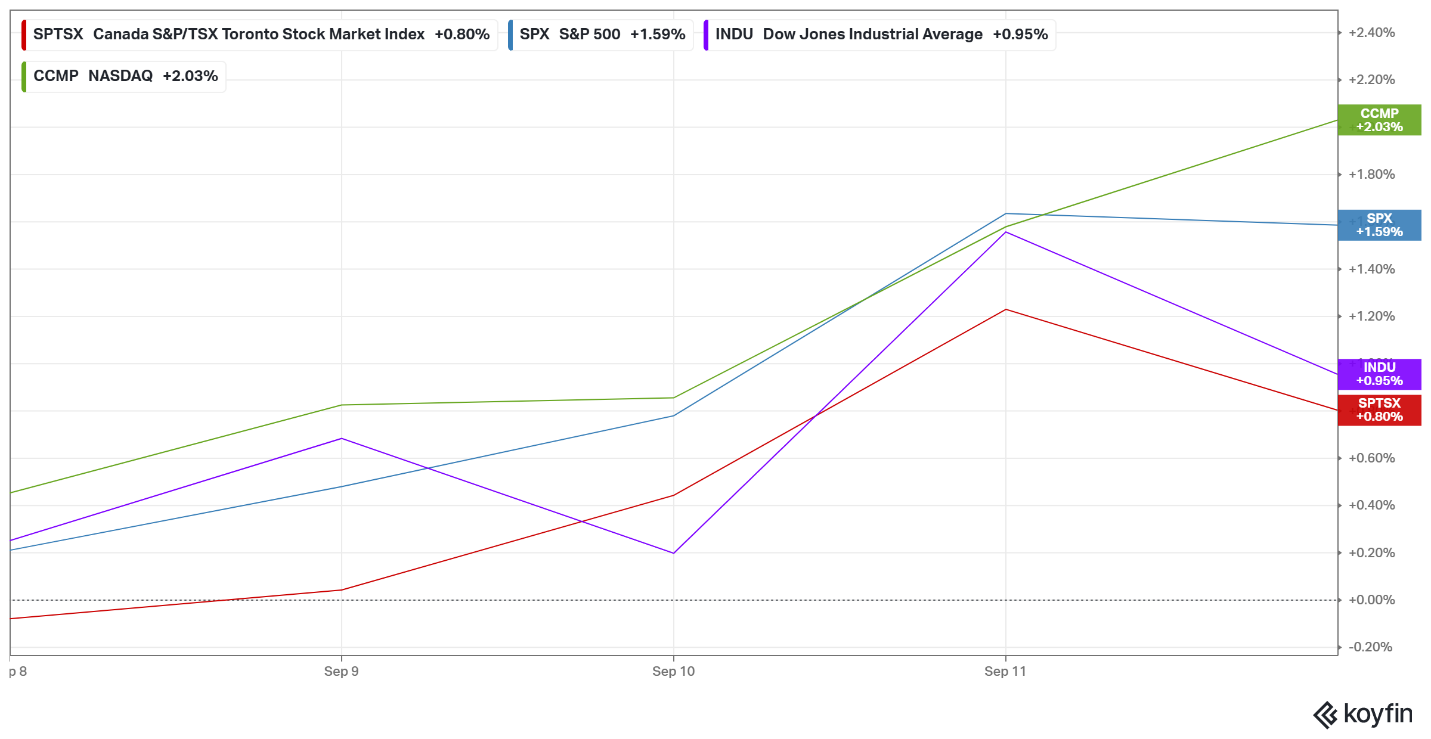
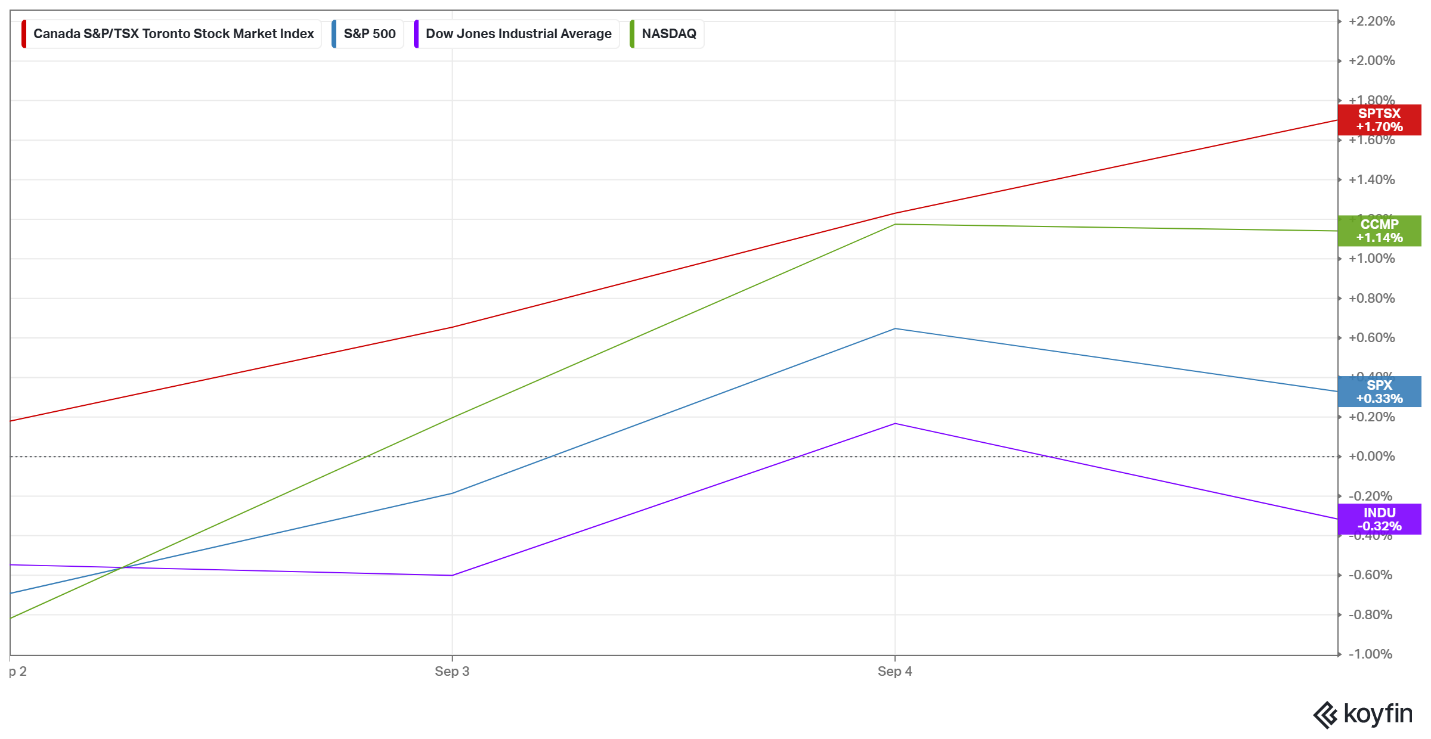
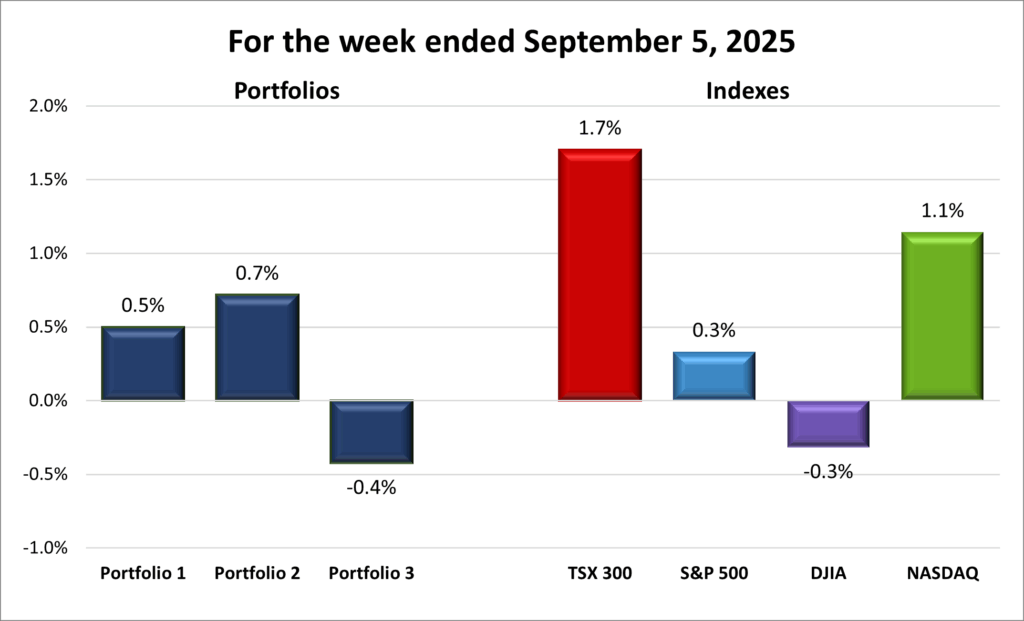
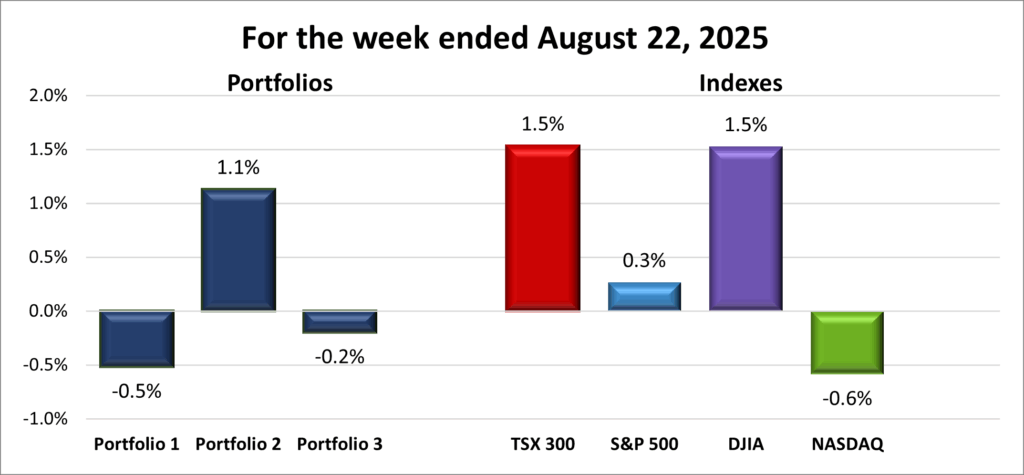
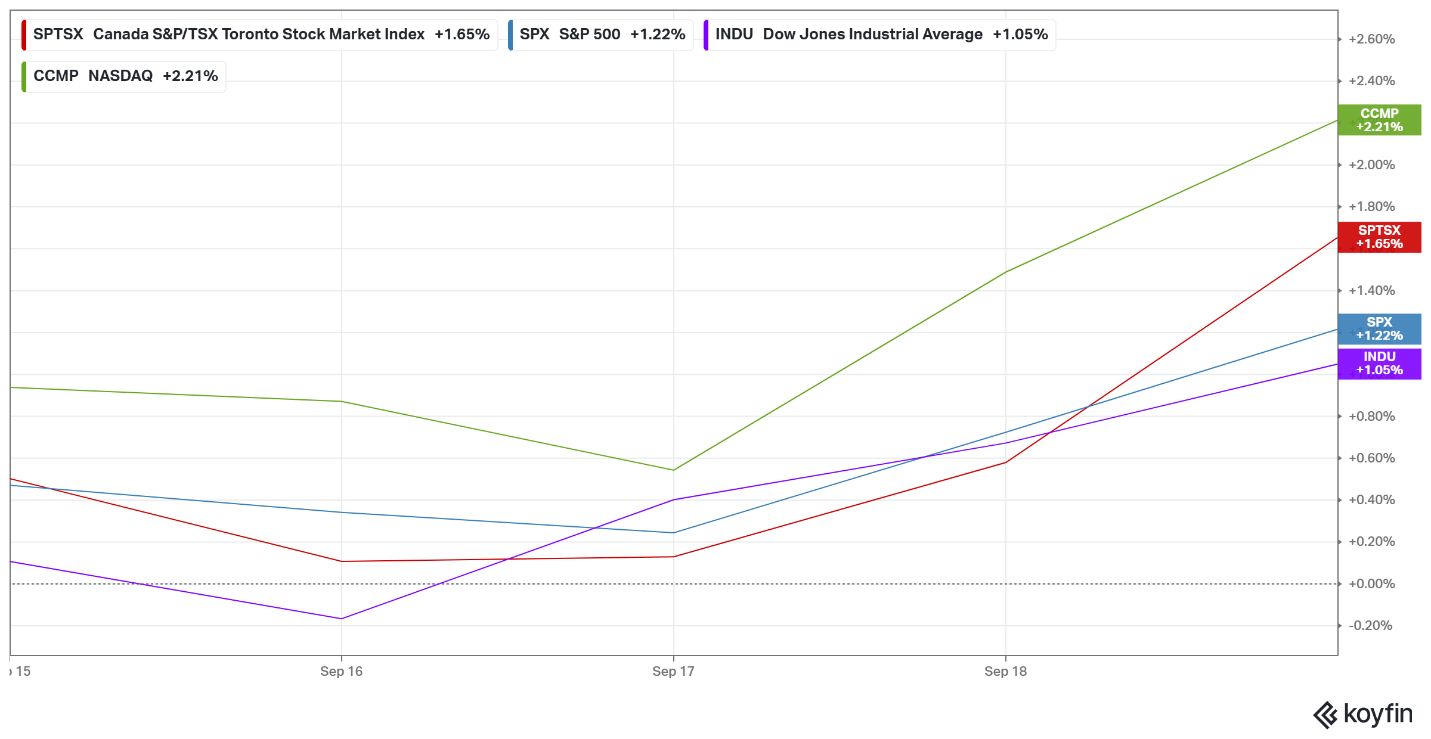
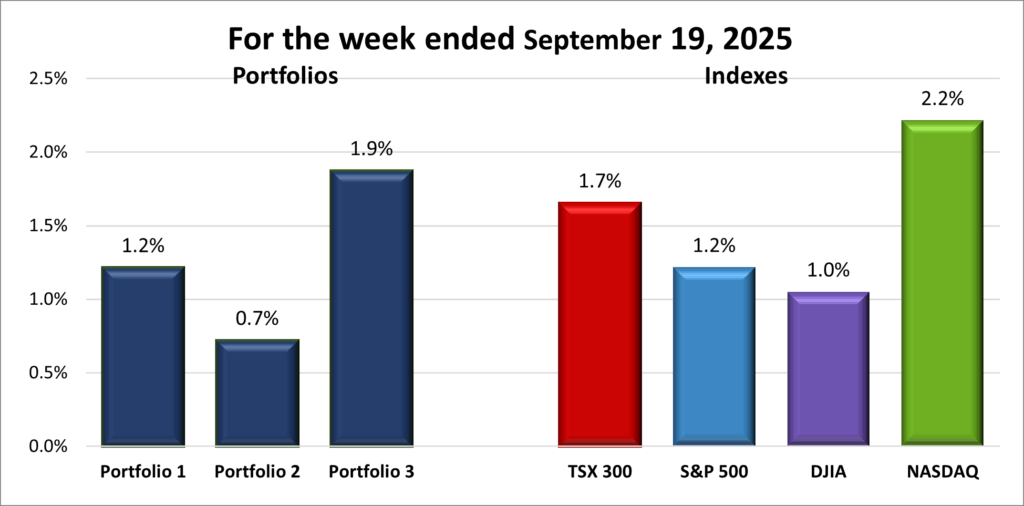
For the week, the TSX (SPTSX) gained 1.7%, the S&P 500 (SPX) rose 1.2%, the DJIA (INDU) advanced 1.0% and the Nasdaq (CCMP) surged 2.2 3.4%.
| Index | Weekly Streak |
| TSX: | 7 – week winning streak |
| S&P: | 3 – week winning streak |
| DJIA: | 2 – week winning streak |
| Nasdaq: | 3 – week winning streak |
![]() After a pullback last Friday, markets wasted no time regaining momentum. The S&P 500 (S&P) crossed 6,600 for the first time, the Nasdaq Composite Index (Nasdaq) stretched its record-setting streak to six sessions, and the Toronto Stock Exchange Composite Index (TSX) added fresh highs of its own. Then, after this week’s rate decisions, the Dow Jones Industrial Average (DJIA) joined the rally, with all four major North American indexes closing at record highs for two straight days. For the TSX, the week marked its seventh straight weekly gain – its longest winning streak since February 2024.
After a pullback last Friday, markets wasted no time regaining momentum. The S&P 500 (S&P) crossed 6,600 for the first time, the Nasdaq Composite Index (Nasdaq) stretched its record-setting streak to six sessions, and the Toronto Stock Exchange Composite Index (TSX) added fresh highs of its own. Then, after this week’s rate decisions, the Dow Jones Industrial Average (DJIA) joined the rally, with all four major North American indexes closing at record highs for two straight days. For the TSX, the week marked its seventh straight weekly gain – its longest winning streak since February 2024.
The spotlight was firmly on the Fed. Investors were looking for a Goldilocks outcome: a labour market soft enough to call for cuts but not so fragile that it signalled deeper trouble. That’s largely what they got. The Fed voted 11–1 to trim rates by 0.25%, with Chair Jerome Powell underscoring that the cooling jobs market was a top concern. He also left the door open to two more cuts before year-end, a signal that added fuel to the rally.
The lone dissenter was Stephen Miran, President Trump’s newly confirmed Fed governor. Approved by the Senate in a razor-thin 48–47 vote just two days earlier, Miran pushed for a steeper 0.5% cut. His appointment drew scrutiny since he only took a leave from his White House role instead of resigning outright, raising questions about his independence. Meanwhile, Governor Lisa Cook – whom Trump unsuccessfully tried to remove – backed the majority in supporting the quarter-point move.
Markets wobbled immediately after the announcement, with the Nasdaq and S&P slipping into the red. But hesitation quickly faded, and by the next day, all three major US indexes were back at record highs.
Adding more spark to the rally, Nvidia (NASD: NVDA) unveiled a headline-making US$5 billion investment in Intel (NASD: INTC). The move lit a fire under the semiconductor space and gave the Nasdaq and S&P another push higher. Intel had one of its strongest days in decades, helping the broader technology sector shine. Overall, it was a strong week for heavyweight technology companies, especially the Magnificent 7, as investors piled back into the big growth names.
On the trade front, tensions cooled slightly. President Trump and Chinese President Xi Jinping spoke by phone, reopening dialogue. Hints of progress on US ownership issues around TikTok and signs that both sides may soften their tariff stances lifted sentiment and chipped away at the “uncertainty tax” weighing on markets.
In Canada, Canadian markets also got a lift from developments moving in the same direction. Softer-than-expected inflation data strengthened the case for a rate cut, and the BoC delivered, lowering its benchmark rate by 0.25% to 2.50% – the lowest in three years. Governor Tiff Macklem pointed to a weakening labour market, with job losses and rising unemployment, along with shrinking exports tied to US tariffs, as reasons to act. Just hours later, the Fed matched with its own 0.25% cut. The back-to-back decisions gave investors confidence to shift money back into stocks and away from safer assets like cash and bonds, boosting optimism about the near-term outlook. Gold prices also continued their climb, logging a fifth straight weekly gain and helping push the TSX to new record highs.
| Portfolio | Weekly Streak |
| Portfolio 1: | 3 – week winning streak |
| Portfolio 2: | 7 – week winning streak |
| Portfolio 3: | 2 – week winning streak |
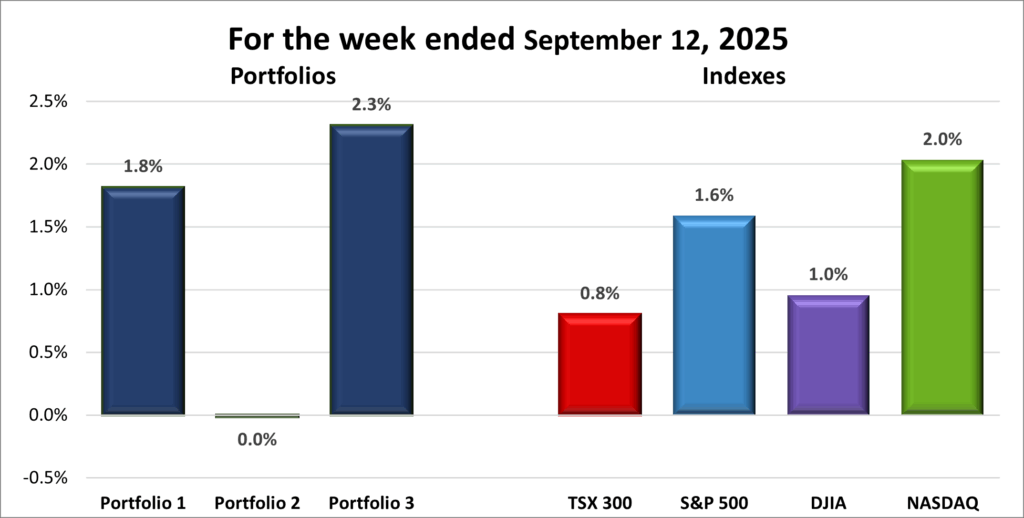
![]() It was another solid week for all three of my portfolios, each finishing in the green. The back-to-back rate cuts in Canada and the US gave investors confidence to move money back into stocks, and the growth-oriented technology sector was the biggest winner. Since all three portfolios lean into the technology sector, some more than others, they rode that wave of optimism higher.
It was another solid week for all three of my portfolios, each finishing in the green. The back-to-back rate cuts in Canada and the US gave investors confidence to move money back into stocks, and the growth-oriented technology sector was the biggest winner. Since all three portfolios lean into the technology sector, some more than others, they rode that wave of optimism higher.
Portfolio 1 gained 1.2 performances from CrowdStrike (NASD: CRWD) up 14%, Navitas Semiconductor (NASD: NVTS) up 13%, Lattice Semiconductor (NASD: LSCC) up 11%, and Grab Holdings (NASD: GRAB) up 10%. Cameco (TSE: CCO), Alphabet (NASD: GOOGL), and TD Bank (TSE: TD) also closed at record highs. The upside might have been even better if not for Nvidia, which found itself caught between US -China trade tensions. After reports that China’s internet regulator told major firms not to buy Nvidia’s China-specific chip, the stock briefly dipped before recovering to eke out a 0.1% weekly gain.
Portfolio 2 added 0.7%, not flashy but enough to extend its weekly win streak to seven. Again, 59% of holdings finished higher, led by TC Energy (TSE: TRP), which notched a record high. Slow and steady still moves the needle, and a gain is a gain. 😊
Portfolio 3 led the pack, climbing 1.9%. A strong 72% of holdings posted gains, including an 11% jump for Lithium Americas (TSE: LAC) and new record highs for the Royal Bank of Canada (TSE: RY) and TD Bank. Like Portfolio 1, the upside was capped somewhat by Nvidia’s trade-war limbo, but the portfolio still delivered the best return of the three.
All in all, it’s shaping up to be a strong month. The major indexes have each chalked up at least two straight weekly gains, and all three portfolios are riding multi-week winning streaks of their own. With both central banks cutting rates, the script played out just as hoped – and for now, momentum is clearly on the side of us investors. 😊
Companies on the Radar
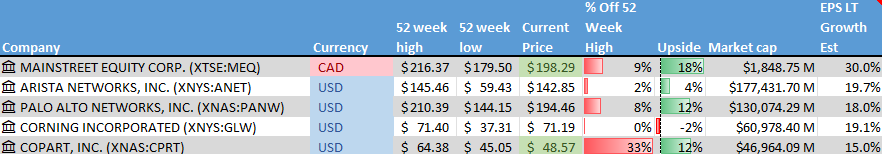
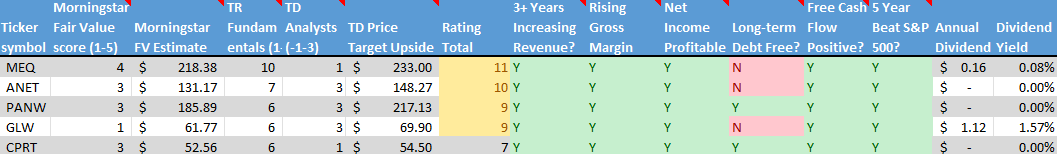
 This week brought some changes to my radar list – one company flew off while another came in for a landing. Palo Alto Networks (NASD: PANW) is no longer on my radar. It’s a strong cybersecurity player, but since I already own two companies in the space, I decided there’s no need to add another. If I didn’t already have that exposure, PANW would be tough to pass up.
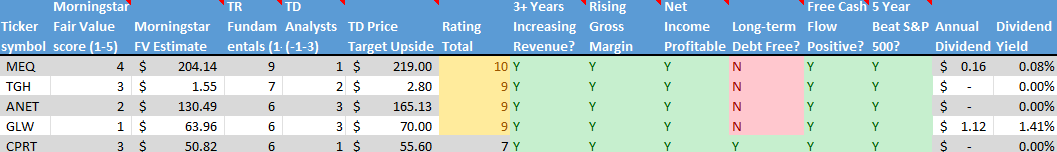
Taking its place is Tornado Infrastructure Equipment Ltd. (TSEV: TGH), a small but intriguing Canadian industrial company. Tornado designs, builds, and sells hydrovac trucks across North America, while also generating recurring revenue through rentals, parts, and maintenance – making it more than just a pure equipment play. Hydrovac trucks are essential for digging around pipes and cables without causing damage, so more projects usually mean more demand. With infrastructure spending ramping up and safer-digging technology gaining traction, Tornado has momentum and several tailwinds at its back. These include oil and gas projects as well as investments by all levels of government in replacing and expanding aging water, sewer, and telecom systems. Still, as with many smaller companies, risks remain: leverage, margin pressure, and the need for consistent execution.
As a micro-cap with a valuation around C$250–260 million, due diligence is essential – something I plan to do. For now, it looks interesting and joins the four holdovers from last week on my radar.
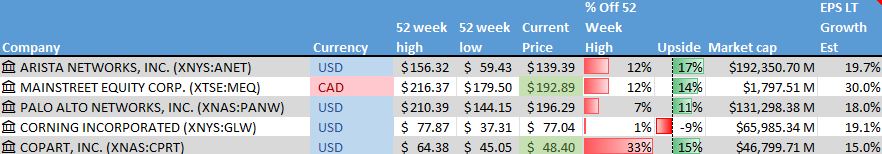
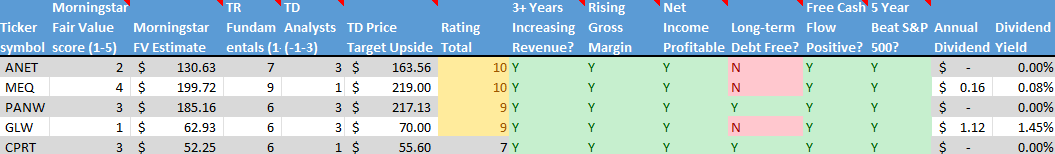
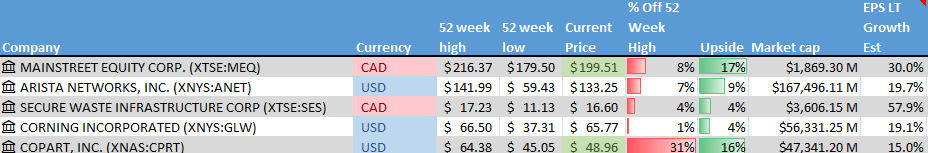
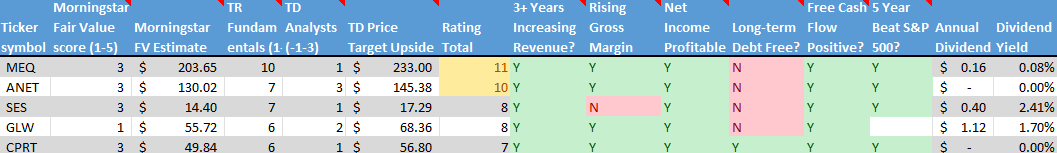
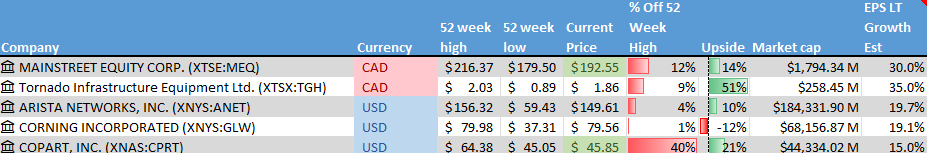
- Mainstreet Equity Corp. (TSE: MEQ): a Calgary-based real estate company focused on mid-market apartment buildings – typically under 100 units – across Western Canada. It buys underperforming properties at below-market prices, renovates them, and increases rental income through improved operations. With strong demand for rental housing, a repeatable value-add strategy, and a solid balance sheet, Mainstreet offers a compelling mix of income and growth. Shares currently trade below net asset value, giving investors a margin of safety alongside steady cash flow and long-term upside.
- Arista Networks (NYSE: ANET): an American company that designs and sells advanced networking hardware and software, with a focus on high-speed, low-latency switches for its key markets: data centres, artificial intelligence (AI), cloud computing, and financial trading. The company has been riding the AI tailwind with solid demand from its core markets, especially in AI and cloud data centres. It also has a hefty share buyback program and increasing investments from some of the top institutional investment companies.
- Corning Incorporated (NYSE: GLW): a large cap American company that is a leader in specialty glass, optical fiber, environmental technology, life sciences, and other specialty glasses. They have been the supplier of the glass used in Apple’s iPhones since 2007, and they are riding the tailwind of an AI-driven fiber optic boom.
- Copart (NASD: CPRT): this American company runs one of the world’s largest online vehicle auction platforms, specializing in salvaging cars from accidents and natural disasters. It sells on behalf of insurers, dealerships, rental companies, and individuals. Copart earns revenue through transaction fees, storage, transportation, and listing services. Its digital model, global buyer network, and asset-light approach support strong margins and steady growth. With no long-term debt and rising tailwinds from vehicle values and insurance claims, it’s a steady growth story that’s earned a spot on my radar.
As always, these are not buy recommendations. Make sure to do your own research and choose investments that fit your personal financial goals.
The Radar Check was last updated September 19, 2025.
That’s a wrap for this week, thanks for reading – may your portfolio stay green and your dividends steady. See you next time!