Rare Earths: Tiny Metals, Massive Impact, Major Contention
Last week, we talked about trade tensions between China and the US – the world’s two largest economies. One key flashpoint in those talks is rare earth elements. Rare earths might sound like something from a sci-fi movie, but they’re actually critical to everything from your smartphone to fighter jets – and they’re at the centre of the China- US trade debate.
What are rare earth elements?
Rare earth elements, often shortened to rare earths, aren’t actually rare. They’re a group of 17 metallic elements that are fairly common in the Earth’s crust but rarely found in concentrations high enough to mine economically. The real challenge isn’t finding them – it’s extracting and refining them, which is expensive, energy-intensive, and environmentally tricky. That’s why only a handful of countries dominate global supply.
Where they come from
China dominates the rare earth market, producing 60–70% of the world’s supply and controlling nearly 90% of global refining capacity. That means even if another country mines these metals, China often does the final processing. Other producers include the US (mainly the Mountain Pass mine in California), Australia, and emerging players like Myanmar and Vietnam. Canada has potential too, with several exploration projects in Quebec and the Northwest Territories, but large-scale production hasn’t started yet. The US, meanwhile, doesn’t produce enough domestically and relies heavily on imports – mostly from China – which makes it vulnerable to supply disruptions.
Why they matter
Rare earths are used in tiny amounts but are essential to modern technology. Think of them as the vitamins of modern tech – small but critical for everything from iPhones to fighter jets (and if you’re a chemistry nerd, you’ll appreciate these relatively unknown elements 😊)
- Electric vehicles (EVs): powerful magnets in motors depend on neodymium (Nd) and dysprosium (Dy) – the same magnets that make Teslas and other EVs drive smoothly.
- Wind turbines: rare-earth magnets use neodymium (Nd), dysprosium (Dy), and praseodymium (Pr) to boost efficiency, helping wind farms generate more electricity with less wind.
- Smartphones, laptops, and electronics: touchscreens, speakers, and hard drives rely on cerium (Ce), lanthanum (La), neodymium (Nd), praseodymium (Pr), and europium (Eu) – basically every device you scroll, type, or stream on daily.
- Defence and aerospace: guidance systems, jet engines, and radar require samarium (Sm), neodymium (Nd), and yttrium (Y) – the tech that keeps planes flying safely and jets hitting their targets accurately.
- Green tech (LED lights, solar panels): efficiency and colour quality come from yttrium (Y), europium (Eu), terbium (Tb), and cerium (Ce) – powering brighter lights and better solar panels for cleaner energy.
Why it matters now
China’s dominance means any move it makes, like tightening export controls, can ripple through global markets. Rare earths often become a political and economic lever during trade tensions. The US and its allies are trying to build alternative supply chains, but it’s slow and expensive work. The tension isn’t just about trade balances; it’s about control over a resource that underpins modern technology, clean energy, and defence. For the US, that dependency is a big vulnerability; for China, it’s strategic leverage.
For investors, this has real implications. Supply constraints can drive up costs, squeeze profit margins in EV and tech companies, and sometimes create short-term opportunities in mining stocks outside China. For long-term investors, it’s a reminder that geopolitics and materials security are closely tied to innovation and growth sectors – especially clean energy and semiconductors. In short, rare earths show how global politics can directly affect the companies we invest in – so it pays to keep an eye on these tiny but mighty metals.
While rare earths show the big-picture interplay of geopolitics and technology, the markets keep moving too. Let’s take a look at what happened this week across the Canadian and American markets and how it affected the three portfolios…
Items that may only interest or educate me ….
When Currencies Falter, Canadian Economic news, US Economic news, ….
When Currencies Falter, Gold Glitters
Before this past week, gold had already surged an incredible 65% in 2025, driven by strong central bank buying and a wave of investors seeking safety. Even after this week’s pullback, the precious metal remains up more than 55% year to date. Many investors view it as a hedge against the weakening of paper money – what’s often called a “debasement trade.” But what exactly does that mean? Let’s take a closer look.
The term “debasement” originally referred to when governments literally reduced the precious metal content in coins (like mixing silver with cheaper metals) to stretch their money supply – effectively making each coin worth less. Today, it’s used more broadly to describe the erosion of a currency’s purchasing power.
A debasement trade happens when investors think a country’s currency, like the American dollar, is losing real value. That can occur when government debt piles up, deficits grow, or the Federal Reserve keeps interest rates too low for too long. In those situations, investors often turn to gold for protection. It doesn’t pay interest, but it tends to hold its purchasing power over time – which makes it appealing when money seems to buy less with each passing year.
We’ve seen this play out before. During the early 2020s, when inflation was running hot and governments were spending heavily, gold prices jumped as investors tried to protect their wealth from the falling value of their dollars. More recently, in 2024 and 2025, large US and Canadian budget deficits – combined with expectations of future rate cuts – reignited those fears. That sparked a surge of buying in gold and other hard assets, a classic debasement trade, as people moved out of cash and into assets that felt more secure.
With debt rising and deficits widening on both sides of the border, it’s no wonder the price of gold is soaring – and it’s got me thinking about adding a gold company to my portfolio. 😊
Canadian Economic news
This past week’s key economic data that the Bank of Canada (BoC) considers when deciding whether to raise or lower the interest rate.
Consumer Price Index (CPI)
Statistics Canada reported that inflation in Canada came in a little hotter than expected in September. Prices rose 0.1% month over month, reversing August’s 0.1% decline and beating forecasts that called for another drop. On an annual basis, the CPI accelerated to 2.4%, up from 1.9% in August and slightly above the 2.3% analysts had expected.
Gasoline prices saw the biggest monthly increase, climbing 1.9%, while transportation costs posted the largest drop, falling 0.5%. Year over year, food prices had the biggest gain, up 3.8%, while gasoline saw the steepest decline, down 4.1% and staying cheaper than a year ago. Shelter costs, which include rent and mortgage interest, continued to weigh on overall inflation, rising 2.6%, the same pace as in August.
Core inflation, which excludes more volatile items like food and gas, fell 0.1% from August, while the annual rate held steady at 2.4% – a reminder that underlying price pressures remain.
This slightly stronger-than-expected inflation report gives the BoC a reason to stay cautious, but not necessarily to change course. While 2.4% might look good compared with the peaks we’ve seen in recent years, the uptick breaks the cooling trend and shows that price pressures haven’t fully disappeared. Still, inflation remains close to the target range, and with the economy showing signs of strain, the focus has shifted toward supporting growth rather than fighting inflation.
The Bank already trimmed its policy rate by 0.25% to 2.50% in mid-September, and most analysts expect another cut next week to help cushion a slowing economy and a soft job market. A lower rate would ease pressure on borrowers and businesses, giving households some breathing room after two challenging years of high rates and stubborn inflation.
Retail Sales
Retail sales bounced back in August, rising 1.0% after a 0.8% drop in July – right in line with expectations. On a yearly basis, sales were up 4.9% versus 4.0% in July, showing that Canadians are still spending despite higher borrowing costs.
The biggest monthly gains came from clothing and footwear stores, up 3.2%, while building and garden retailers slipped 0.3%. Over the past year, auto and parts dealers have led the way with a 6.1% gain, while gas stations were the weakest, down 5.2%.
When you strip out the more volatile auto and fuel categories – what economists call “core retail sales” – the picture looks steadier. Core sales grew 1.1% in August after a 1.2% drop in July and were up a healthy 5.9% year over year. That tells us households are still spending in other areas, even if they’ve tightened up on some everyday items.
Since consumer spending drives much of Canada’s economy, this rebound is a welcome sign of resilience after a soft July. It suggests shoppers haven’t completely shut their wallets – good news for retailers and consumer-focused businesses. But an early estimate for September points to a possible 0.7% decline, hinting that the slowdown might not be far behind.
For the Bank of Canada, the numbers are a mixed bag. August’s recovery hints that consumers still have some gas left in the tank, but the softer September preview may keep the Bank cautious. If spending cools further, it could strengthen the case for rate cuts sooner rather than later.
For us investors, this retail data shows the economy is still holding together, but cracks are beginning to show. Consumer strength has kept earnings steady for many retailers and service companies, but if spending fades, profits could come under pressure – especially in more discretionary areas like travel, apparel, and home improvement.
At the same time, weaker sales could boost the odds of a rate cut in the coming months. Lower borrowing costs would generally be a positive for markets, particularly for rate-sensitive sectors like real estate, utilities, and growth stocks.
So, while August’s bounce was encouraging, the bigger story may be what comes next – whether consumers keep spending or finally start to tap the brakes.
Canadian Market Volatility
Canada’s volatility gauge, the S&P/TSX 60 Volatility Index (VIXC), opened the week at 18.33. Investors stayed fairly calm through most of the week, with the index hovering around the 18 mark until midweek. It then took what looked like a step down to 17.28 Thursday morning followed by another sharp move lower to 16.10 late Thursday. The gauge jumped back above 16.75 on Friday after President Trump called off trade negotiations with Canada but drifted lower throughout the day to end at 16.14.
For anyone new to it, the VIXC is basically a barometer of investor nerves in Canada. When it’s sitting in the single digits or low teens, markets are calm. Once it climbs into the high teens or beyond, it shows investors are getting uneasy and bracing for more volatility ahead. With the index finishing just above 16, it suggests that while there’s still some caution in the air.
US Economic news
This past week’s key data points that the Federal Reserve (Fed) considers when deciding whether to raise or lower the interest rate.
Consumer Price Index (CPI)
The Bureau of Labor Statistics’ latest CPI report, delayed by the government shutdown, showed inflation rose slightly less than expected in September. Prices increased 0.3% month-over-month, following a 0.4% gain in August, while year-over-year inflation came in at 3.0%, just below analysts’ 3.1% forecast.
On a monthly basis, gasoline prices saw the biggest increase, with a gain of 4.1%, while electricity prices fell 0.5%. Over the past year, utility (piped) gas service – the natural gas delivered through pipelines to homes and businesses for heating, cooking, and other energy needs – surged 11.7%, while gasoline fell 0.5%. Shelter costs, which includes mortgages, rent, and homeowner expenses, rose another 0.4% in September, keeping steady pressure on households, though the annual pace edged slightly lower to 3.6%.
Core CPI, which strips out the more volatile food and energy prices, rose 0.2% month-over-month after two consecutive 0.3% gains. On an annual basis, core inflation held at 3.0%, just below expectations of 3.1%.
While inflation is still stubbornly high, softer labour-market data adds a twist. The most recent jobs data showed growth slowed to roughly 22,000 in August, and weekly unemployment claims were approaching four-year highs. Put together with the 3.0% year-over-year pace of inflation, it suggests the economy is in a delicate spot: prices are still rising, but people are starting to spend less because job growth is slowing, and wages aren’t increasing as fast. For the Fed, that means walking a fine line. However, they’ve said they have shifted to prioritizing supporting the weakening labour market, which has investors widely anticipating a 0.25% rate cut at the upcoming meeting next week.
Consumer Sentiment Index (CSI)
The University of Michigan’s final CSI reading for October came in at 53.6, down from the early estimate of 55.0 and just below September’s 55.1. That’s a big drop from a year ago, when sentiment sat at 70.5 – a 24% decline that shows just how much confidence has cooled over the past year.
The Current Economic Conditions gauge, which reflects how people feel about their job security and personal finances, fell to 58.6. Meanwhile, the Expectations Index, which looks ahead to what consumers think the next six months may bring, slipped further, highlighting growing unease about the road ahead. On the inflation front, consumers expect prices to rise by about 4.6% over the next year, and around 3.9% over the next five years.
All this suggests that people aren’t feeling great about their finances, and they’re even less upbeat about the future. That kind of sentiment doesn’t inspire high spending, which means growth tied to consumer behaviour could stay muted. With the CSI stuck in the mid-50s, well below its long-run average, households appear cautious – and that matters for investors because when people hold back on spending, company earnings and market growth can slow too.
American Market Volatility
The CBOE Volatility Index (VIX) – often called the market’s “fear gauge” – started the week at 20.53 before easing into a calmer range between 19.5 and 17.5, eventually closing at 16.37. Markets stayed relatively steady, aside from a brief flare-up above 20 after President Trump said he was prepared to consider steep restrictions on software exports to China. The fear gauge cooled off again once Trump confirmed that the US and China would meet next week to get trade talks back on track.
Think of the VIX as the market’s mood ring – it reflects how nervous or relaxed investors are feeling. With readings now slipping below 20, it suggests investors have stepped back from panic mode, though a sense of caution still lingers. In short, the market isn’t fearful, but it’s not exactly carefree either.
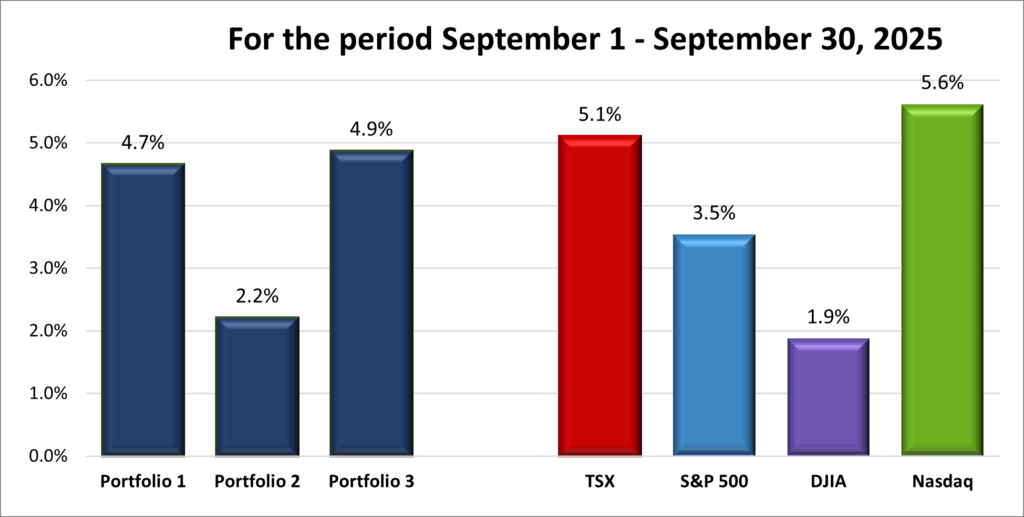
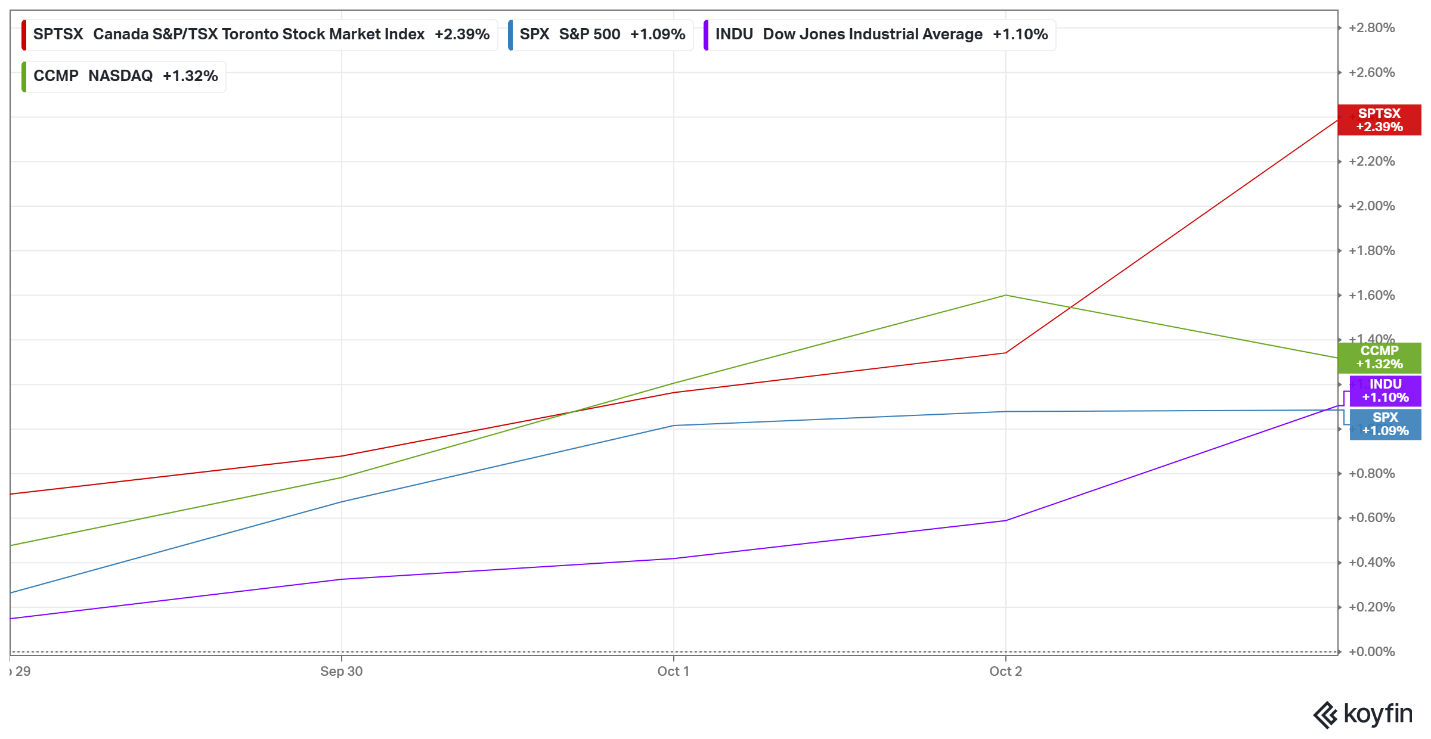
Weekly Market and Portfolio Review
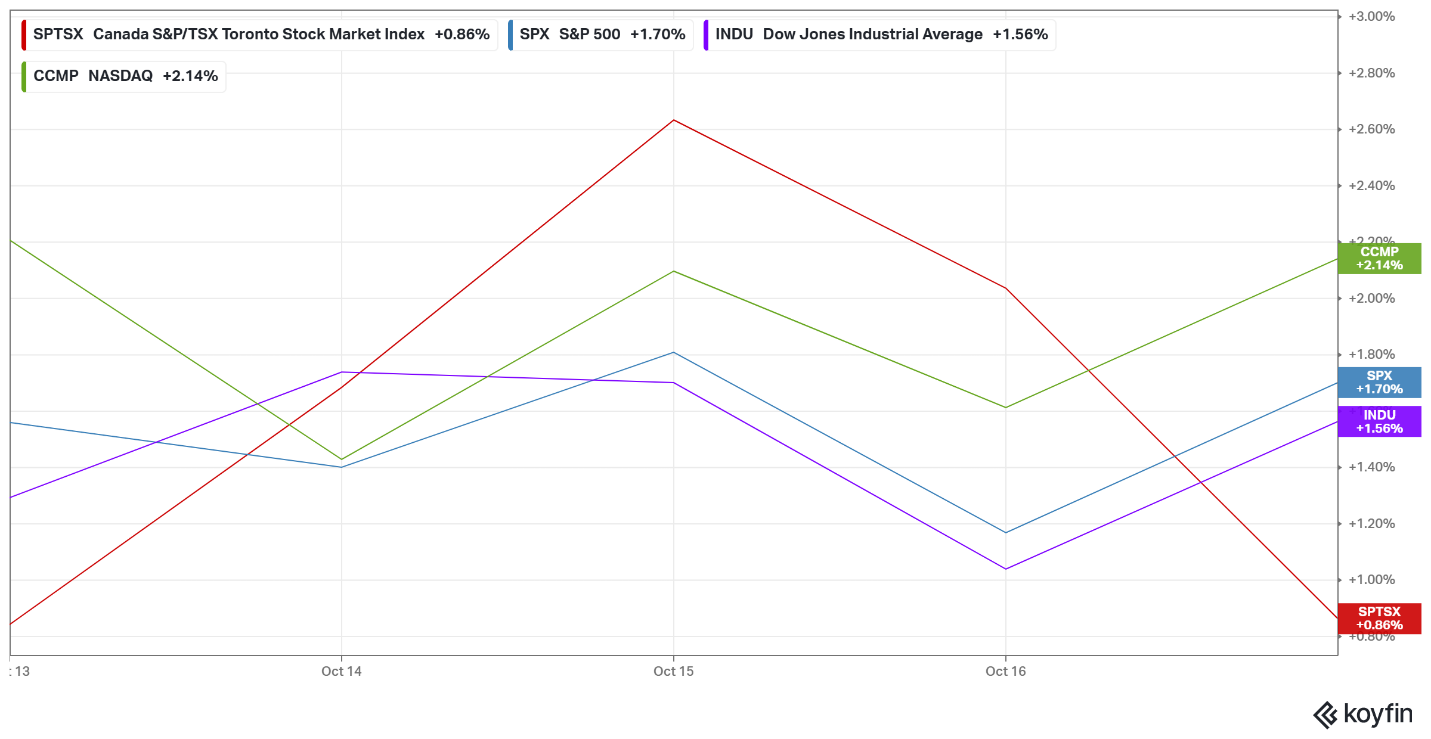
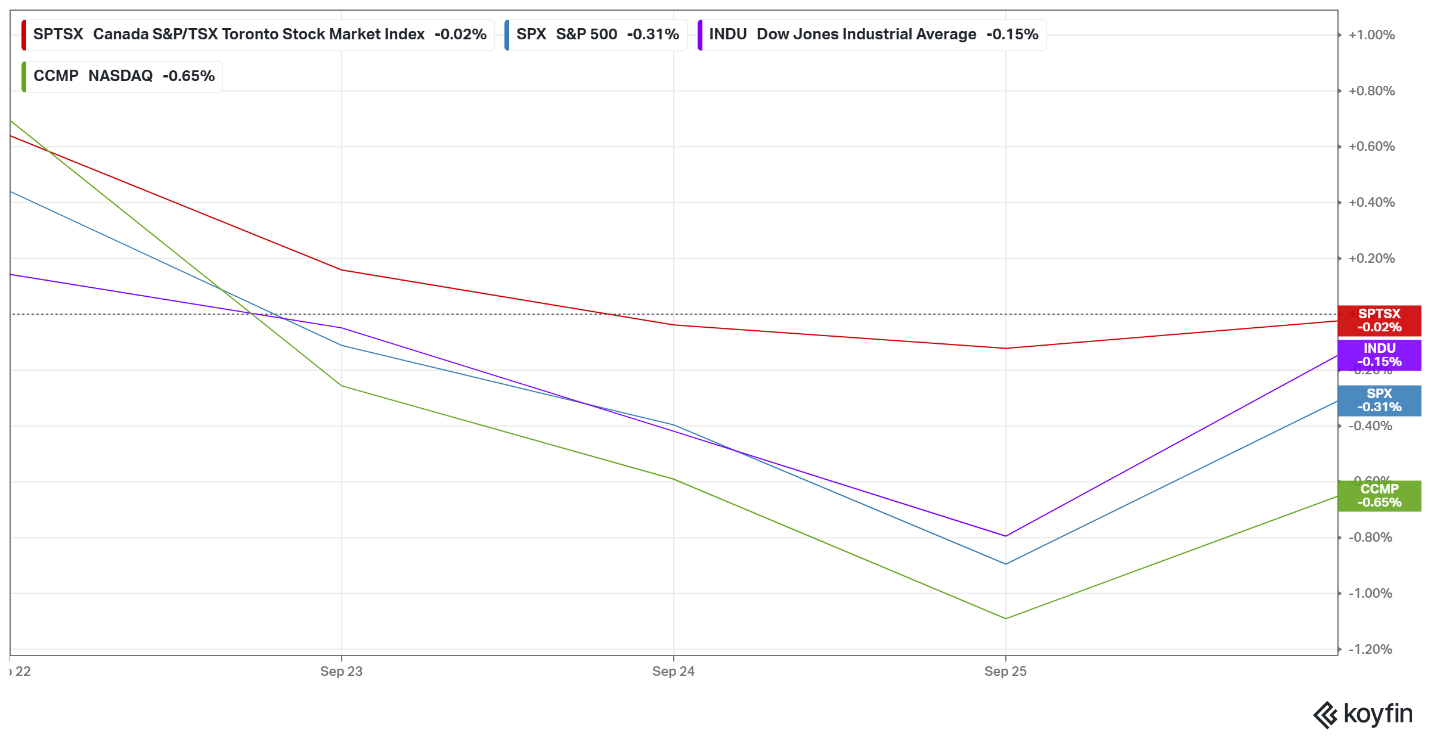
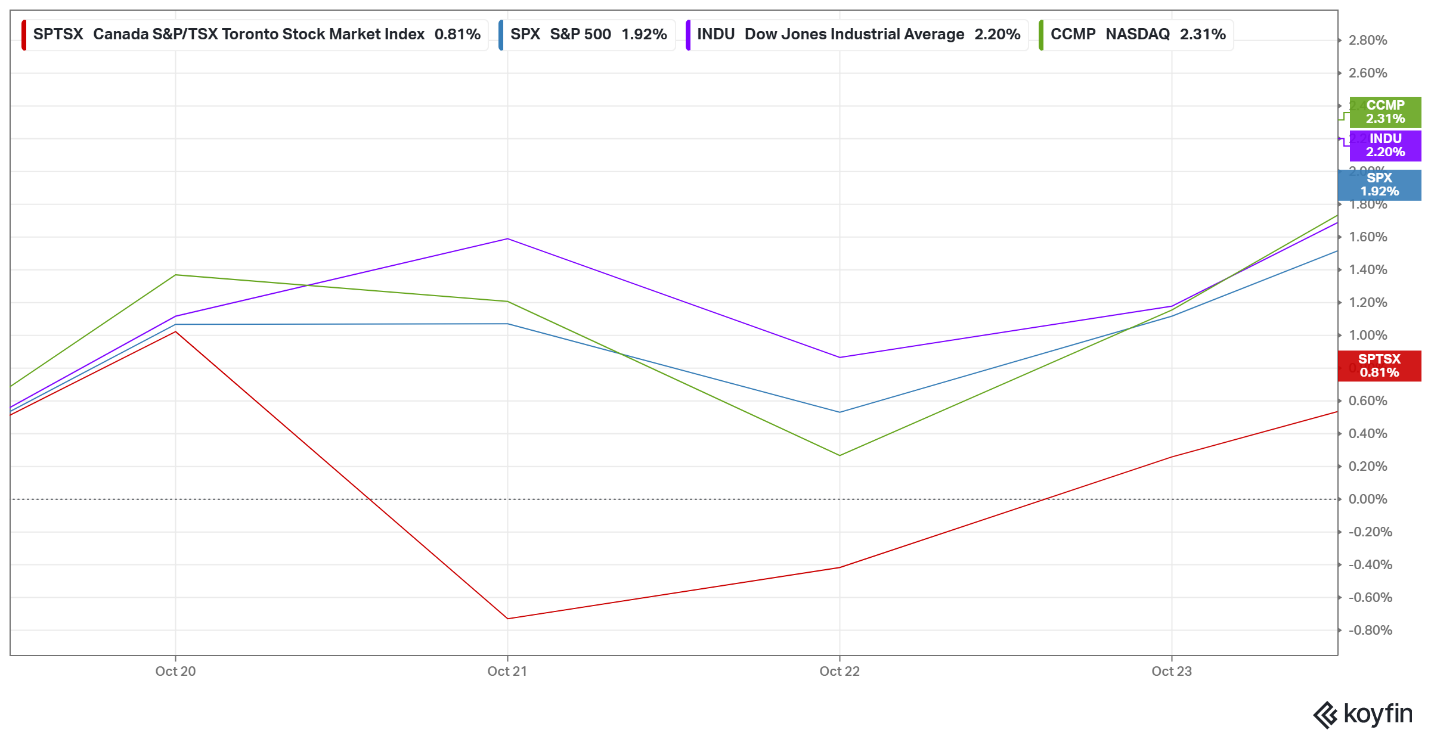
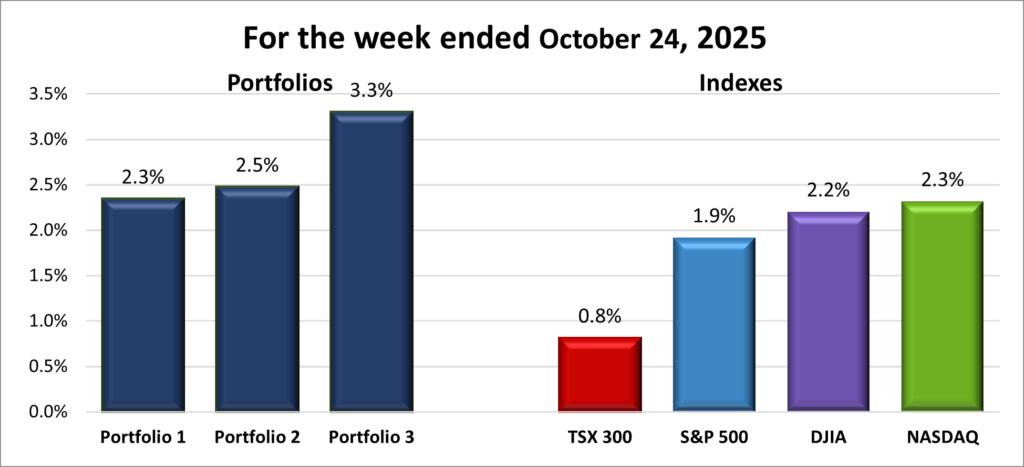
For the week, the TSX (SPTSX) gained 0.8%, the S&P 500 (SPX) climbed 1.9%, the DJIA (INDU) jumped 2.2% and the Nasdaq (CCMP) surged 2.3%.
| Index | Weekly Streak |
| TSX: | 2 – week winning streak |
| S&P: | 2 – week winning streak |
| DJIA: | 2 – week winning streak |
| Nasdaq: | 2 – week winning streak |
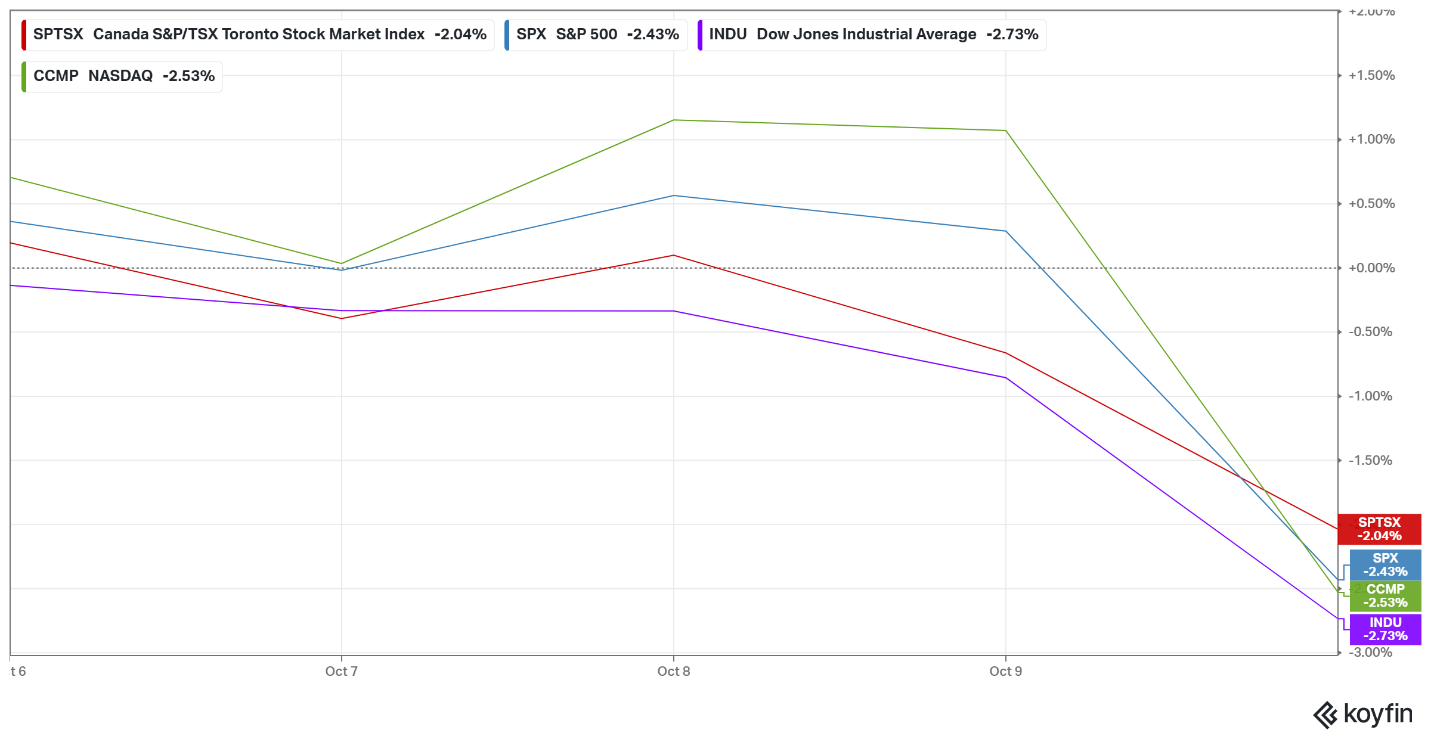
![]() This week was another wild ride for the markets, fuelled by a fresh batch of major earnings reports, new inflation data from south of the border, and ongoing trade tensions. The Toronto Stock Exchange Composite Index (TSX), the S&P 500 (S&P), the Dow Jones Industrial Average (DJIA), and the Nasdaq Composite (Nasdaq) all kicked off the week with gains of 1% or more. To bookend the week that saw all four indexes extend their winning streaks to two, all three major American indexes finished the week at record highs.
This week was another wild ride for the markets, fuelled by a fresh batch of major earnings reports, new inflation data from south of the border, and ongoing trade tensions. The Toronto Stock Exchange Composite Index (TSX), the S&P 500 (S&P), the Dow Jones Industrial Average (DJIA), and the Nasdaq Composite (Nasdaq) all kicked off the week with gains of 1% or more. To bookend the week that saw all four indexes extend their winning streaks to two, all three major American indexes finished the week at record highs.
Investors were upbeat heading into a wave of high-profile earnings this week, hoping to get a clearer sense of the American economy’s strength. With much government economic data still delayed by the ongoing shutdown, analysts leaned on corporate results for clues about the health of the economy.
Third-quarter earnings generally came in stronger than expected, boosting confidence in technology, industrial, and financial stocks. The S&P and Nasdaq climbed on solid results from several big names that showed resilience in both revenue and profit margins.
On the economic front, the US government shutdown – now the second longest in history – continued to cast a shadow over markets. While much of the usual data has been on hold, the Bureau of Labor Statistics released the September Consumer Price Index (CPI) this week, a week later than usual, so the Social Security Administration could determine its 2026 cost-of-living adjustment. The report revealed that inflation is still elevated but came in slightly below expectations. Meanwhile, job growth is slowing and unemployment claims are rising. Combining this information suggests the Fed faces a delicate balancing act – inflation is still high, but the economy is showing signs of cooling. Investors are now pricing in a likely 0.25% rate cut at next week’s meeting.
Trade headlines once again grabbed attention as the US–China negotiations took another turn. After fresh tariff threats from both sides early in the week, news that President Trump and Chinese officials would meet to get talks back on track helped calm some nerves. Things were less friendly on the US–Canada front, though – the US abruptly declared trade negotiations with Canada “terminated” after the Ontario government aired television ads in the US featuring former President Ronald Reagan, much admired by Republicans, criticizing tariffs and warning they cause job losses and trade wars. Trump, a strong proponent of tariffs, was reportedly not impressed. 😊
Meanwhile, the latest University of Michigan survey shows consumers remain cautious. People aren’t feeling confident about their finances or jobs, which can weigh on spending – a key driver of economic growth.
In Canada, the TSX had a mixed week. A sharp midweek drop driven by gold’s biggest one-day percentage fall in over 12 years, combined with higher-than-expected inflation, pushed the index into negative territory. Rising oil and other commodity prices, along with a recovery in gold prices, later helped the TSX recover and finish the week slightly positive.
All in all, markets reflected optimism from strong earnings and rising commodity prices, which more than offset inflation worries and trade uncertainty. Next week could be even better, with the first of the Magnificent 7 companies set to report third-quarter earnings and both central banks expected to lower their benchmark interest rates. Fingers crossed. 😊
| Portfolio | Weekly Streak |
| Portfolio 1: | 2 – week winning streak |
| Portfolio 2: | 2 – week winning streak |
| Portfolio 3: | 2 – week winning streak |
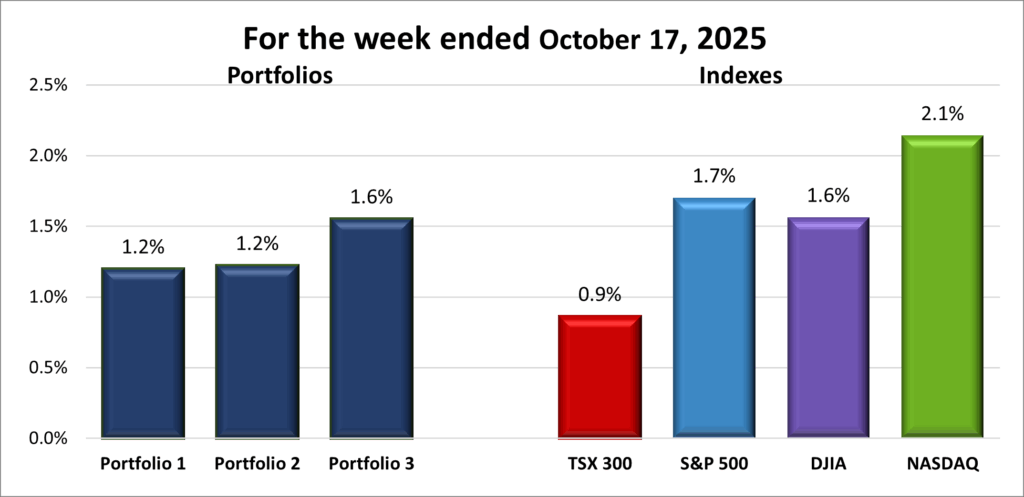
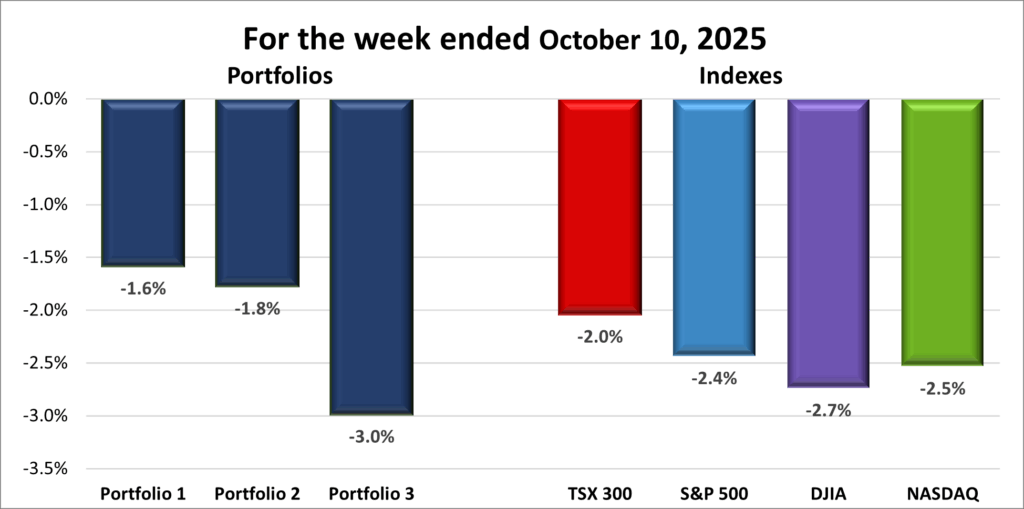
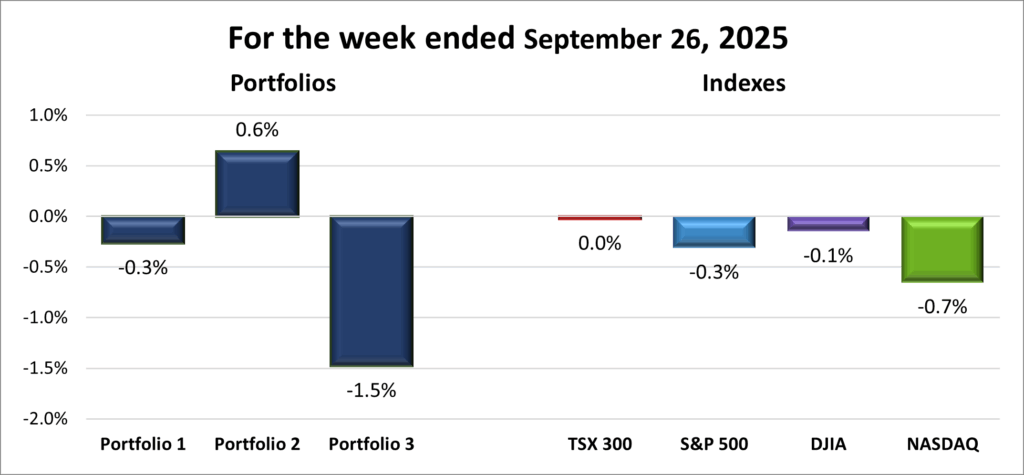
![]() As I’ve often said, when markets have a good week, the portfolios usually follow — and this week was no exception. All three extended their winning streaks to two straight weeks, boosted by strength in the mega-cap technology names, and even the weakest portfolio kept pace with the best-performing index.
As I’ve often said, when markets have a good week, the portfolios usually follow — and this week was no exception. All three extended their winning streaks to two straight weeks, boosted by strength in the mega-cap technology names, and even the weakest portfolio kept pace with the best-performing index.
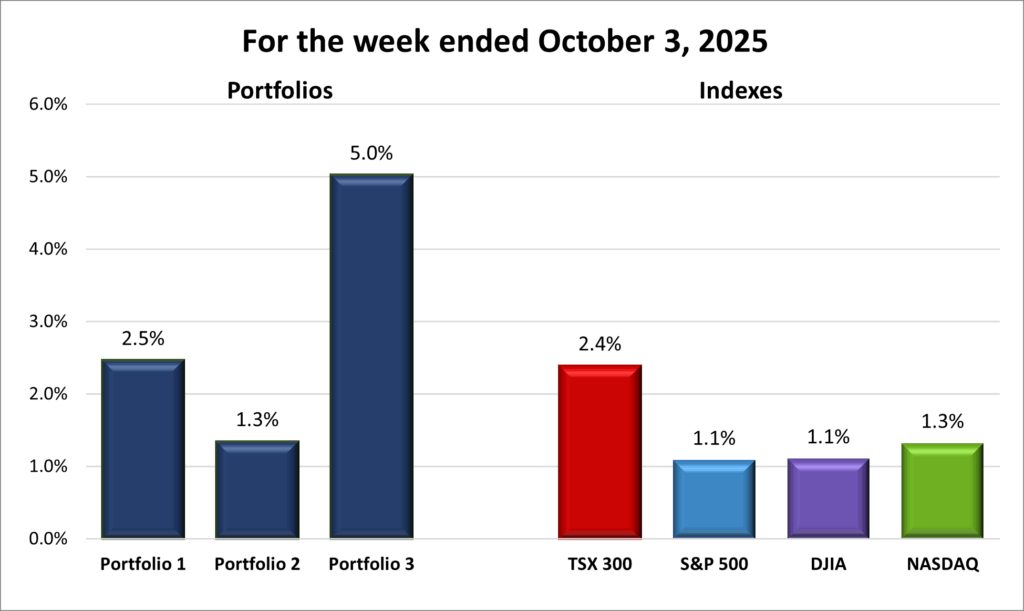
Portfolio 1 was the laggard this week, rising 2.3%, equalling Nasdaq, the top performer of the indexes. The portfolio saw 62% of its holdings post a weekly gains, led by Hammond Power Solutions (TSE: HPS.A) with a massive 28% jump, while Kraken Robotics (TSE: PNG) climbed 13%. Several holdings also set fresh record highs, including Apple (NASD: AAPL), which surged on strong demand for its new iPhone 17, and Alphabet (NASD: GOOGL), after signing a major deal with AnthropicAI to supply up to a million of Google’s custom artificial intelligence (AI) chips for its Claude chatbot. Celestica (TSE: CLS), Shopify (TSE: SHOP), and CrowdStrike (NASD: CRWD) also joined the record-high club this week.
Portfolio 2 had another steady week, rising 2.5% as 68% of its holdings finished higher. Hammond Power Solutions once again stood out with its impressive 28% gain, helping drive the portfolio higher overall.
Portfolio 3 took top honours, gaining 3.3% for the week. An impressive 78% of its holdings advanced, including record highs from Vertiv Holdings (NYSE: VRT) and Shopify.
All in all, it was a solid week across the board – momentum is clearly building, and the portfolios are benefiting as investor confidence returns. With earnings season picking up and both central banks set to announce rate decisions, next week should offer plenty of opportunities for more movement, preferably upward. Here’s hoping those winning streaks continue. 😊
Companies on the Radar
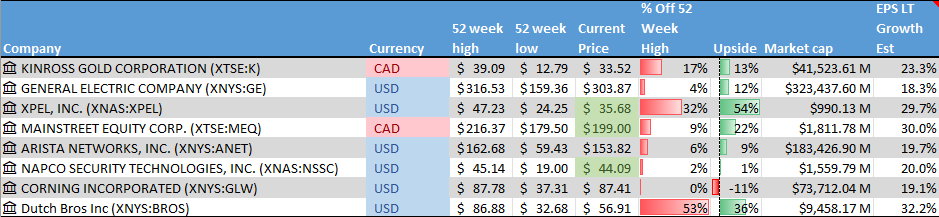
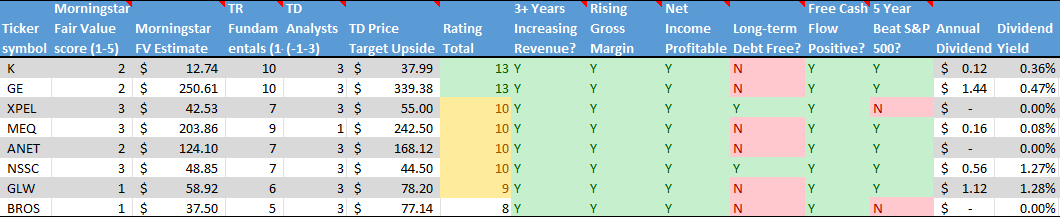
 This week, a few new names came across my radar – almost to the point of being too many! 😊 Joining the five holdovers from last week are three new possibilities, spanning a fast-growing food services company, a multi-billion-dollar industrial giant, and a gold miner.
First up is Dutch Bros Inc. (NYSE: BROS), a mid-cap American company rapidly expanding its drive-thru coffee chain. Known for high-quality, hand-crafted beverages and top-notch customer service, Dutch Bros plans to open at least 160 new locations across the US by the end of 2025, aiming for over 2,000 stores by 2029. With strong brand loyalty, especially in the Western US, this is a high-growth, aggressively expanding company with the potential for significant gains, but with that potential comes higher risk.
Next, we have GE Aerospace (NYSE: GE), which emerged after General Electric’s breakup in 2024. It focuses on aviation propulsion, systems, and services for commercial and military aircraft — and is also moving into the fast-growing drone sector. As a global leader in jet engines, aircraft systems, and maintenance, repair, and overhaul (MRO) services, GE Aerospace offers exposure to global aviation growth, defense spending, and cutting-edge technology. It offers a mix of stability and long-term growth.
Finally, Kinross Gold Corporation (TSE: K) is a Canadian gold miner with operations across the Americas and Africa. Gold often serves as a safe haven in uncertain times, and Kinross offers a way to gain exposure without buying the metal directly. With steady production, global diversification, and growth potential, it can act as a defensive play while still benefiting from rising gold prices. The recent pullback in gold has made this an interesting potential entry point.
These three join the five companies already on my radar, bringing the total to eight names – a mix of growth, industrial strength, and defensive plays. With each offering something different, it’s shaping up to be an exciting set of possibilities to explore over the long term.
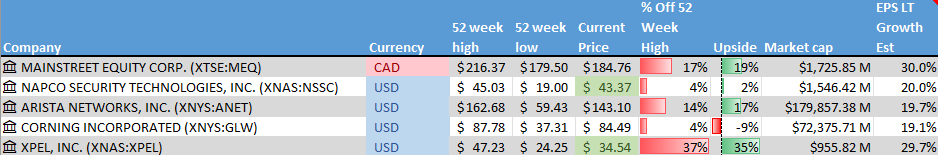
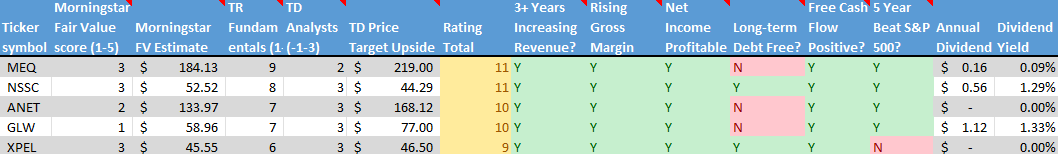
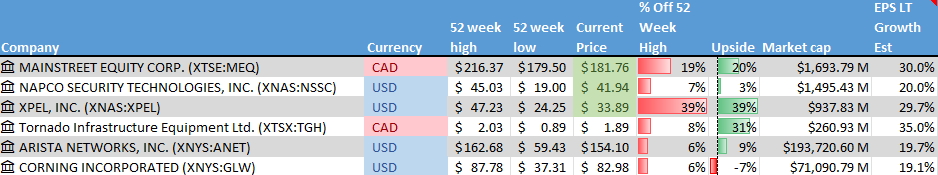
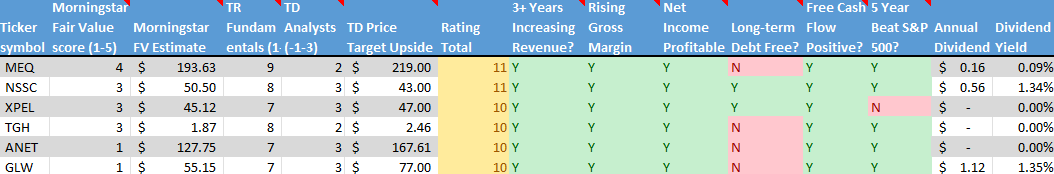
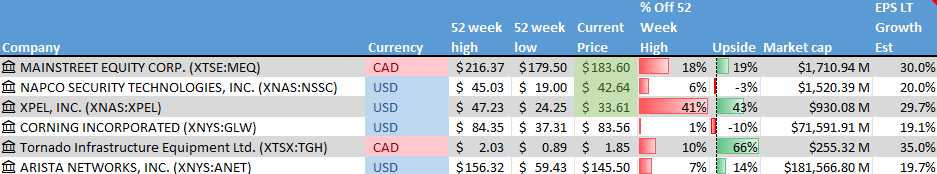
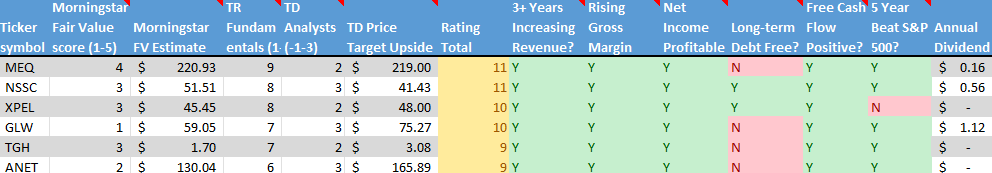
- XPEL, Inc. (NASD: XPEL): a growing American founder run company that produces high-quality protective films, coatings, and related products, primarily for cars but increasingly for architectural and other applications, such as paint protection film (PPF), window tint, and ceramic coatings. The company sells through multiple channels giving it both reach and control.
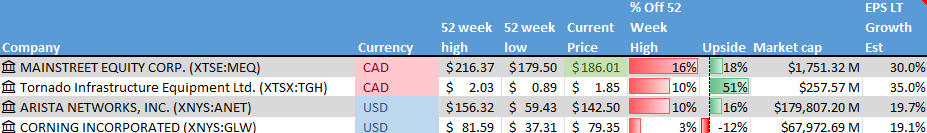
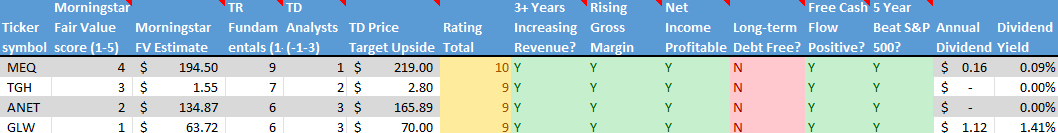
- Mainstreet Equity Corp. (TSE: MEQ): a Calgary-based real estate company focused on mid-market apartment buildings – typically under 100 units – across Western Canada. It buys underperforming properties at below-market prices, renovates them, and increases rental income through improved operations. With strong demand for rental housing, a repeatable value-add strategy, and a solid balance sheet, Mainstreet offers a compelling mix of income and growth. Shares currently trade below net asset value, giving investors a margin of safety alongside steady cash flow and long-term upside.
- Arista Networks (NYSE: ANET): an American company that designs and sells advanced networking hardware and software, with a focus on high-speed, low-latency switches for its key markets: data centres, AI, cloud computing, and financial trading. The company has been riding the AI tailwind with solid demand from its core markets, especially in AI and cloud data centres. It also has a hefty share buyback program and increasing investments from some of the top institutional investment companies.
- Napco Security Technologies, Inc. (NASD: NSSC): a small American owner/operator security firm that provides electronic locks, intrusion and fire alarms, access control systems, and video surveillance solutions for homes, businesses, and institutions. With a broad network of distributors and installers, growing recurring service revenue, and smart home integrations, the company has several avenues for growth. The company is riding the tailwind of an increasing demand for security products.
- Corning Incorporated (NYSE: GLW): a large cap American company that is a leader in specialty glass, optical fiber, environmental technology, life sciences, and other specialty glasses. They have been the supplier of the glass used in Apple’s iPhones since 2007, and they are riding the tailwind of an AI-driven fiber optic boom.
As always, these are not buy recommendations. Make sure to do your own research and choose investments that fit your personal financial goals.
The Radar Check was last updated October 24, 2025.
Portfolio Update
Portfolio 1
Sold: Docebo (TSE: DCBO) I first invested in Docebo, the corporate learning company, in May 2020. As the share price climbed, I added to my position twice more – in June and again in August of that year. The stock peaked at just over C$110 in June 2021, but its growth has cooled since those early years.
The company isn’t where I’d hoped it would be by now, and it doesn’t look like it’s headed there anytime soon. I made money on the first two investments but lost a bit on the last one, finishing about even overall.
As part of my effort to trim down the number of holdings in Portfolio 1 – and with better opportunities showing up on my radar – I decided it was time to sell and redirect the capital into stronger prospects.
Sold: PayPal (NASD: PYPL) I first invested in PayPal back in 2018, when it was growing fast and viewed as one of the dominant players in digital payments. It performed so well in those early months that I picked up more shares just four months later. For a few years, the growth story looked rock solid – especially during the pandemic in 2020, when online shopping surged and PayPal was adding millions of new users each quarter. By the summer of 2021, the share price had climbed above US$300, and everything was looking great.
Over time though, competition in the digital payments space intensified, and PayPal hasn’t been able to keep up the same pace of innovation or growth it once had. Margins have narrowed, user growth has slowed, and newer fintech players and payment options have taken a bigger share of the market. The 2022 bear market didn’t help either – the stock dropped below US$100 and has stayed there ever since.
At this point, it seems like PayPal’s strongest growth years are behind it, so I decided to sell my position and put that money back to work in opportunities with more upside potential. It’s always tough letting go of a long-term holding, but getting rid of underperformers is essential to finding new winners and growing your wealth through investing. 😊
Portfolio 3
Sold: Enghouse (TSE: ENGH) As I mentioned when I sold some of my Enghouse shares back in March 2025, while the markets continue to rise, Enghouse has continued to fall. The stock has underwhelmed and underperformed, and even with its dividend – currently yielding over 5% – my investment is still down more than 48%. I gave the company a few more months, but in hindsight, I should have sold all my shares back in March, if not earlier. I’m now redeploying that cash into better opportunities. Onward and upward.
That’s a wrap for this week, thanks for reading – may your portfolio stay green and your dividends steady. See you next time!