Spare change….
After falling 20% from its April highs to its June lows, thanks to a July rally, the Toronto Stock Exchange Composite Index (TSX), is now up 10% from it June lows. Before getting too excited, the TSX is still down almost 6% in 2022.
The good news continues in the US where the S&P 500 Index is now only 12% below its all-time high in January, despite being largely in a bear market (down 20% or more since all time high) for most of 2022. The Nasdaq Composite Index (Nasdaq) is now up more than 20% since bottoming in June. Dare I say it? OK, I will say it. When an Index or market rises by 20% it can be considered a bull market. However, the Nasdaq is still down 18% in 2022 and still needs to pass its prior peak in November to confirm a new bull market.
Its not unusual for a retail investor (also known as an individual investor, like me) fueled rally to occur in the summer because the professional and institutional investors have gone away for summer vacations. As well, during this year’s bear market, bounces (especially in the US markets) have been brief, before reversing course and resuming their downward trajectory. These mini rallies are also known as bear traps. This leads me to wonder if this rally will last. Once September comes around and the pros return from vacation, then we will find out if this rally has legs or if it is a bear trap.
In other news, it was a big week for investors as the American Consumer Price Index (CPI) report for July was released. While inflation remained high at 8.5%, it was below June’s 9.1%, and it came in at less than expected (8.8%). A major reason was a significant drop in the price of gasoline. As well, recent data indicated the US Producer Price Index (PPI) fell 0.5% in July. The PPI calculates the average change over time in the selling prices received by domestic producers of goods and services. The drop in PPI, combined with inflation cooling off as indicated by the CPI report, raised hopes that the US Federal Reserve’s (Fed) next interest rate hike would be 0.5% rather than another 0.75% increase that was feared after Wednesday’s CPI report.
With signs of decelerating inflation in the US, investors are hoping that may have opened the door for the Fed to slow their roll with coming interest rate hikes. Keep in mind that one report of slowing inflation is not enough for the US Federal Reserve to declare victory, and it is a long way from the Fed’s target of 2 – 3% inflation rate. Canada will release its inflation numbers next week.
With a double shot of good news out of the way, let’s see what happened this past week in the North American stock markets….
Weekly Market Review
Monday: The week started with mixed, yet essentially flat, results for the four major North American Indexes. In Canada, the Toronto Stock Exchange Composite Index (TSX) inched above the bar thanks to the rising price of oil, causing many companies in the Canadian Energy sector to end higher.
In the US, all three Indexes – the S&P 500 Index (S&P), the Dow Jones Industrial Average (DJIA), and the Nasdaq Composite Index (Nasdaq) – started out higher before retreating as investors digested the possibility of additional aggressive rate hikes. The DJIA was able to nudge into positive territory while the S&P and the Nasdaq ended the day just under the bar thanks to a revenue warning from my favourite chipmaker – Nvidia (NASD:NVDA), indicative of a slowing US economy.
Tuesday: Fears of another interest rate hike by the Fed in September sideswiped the Technology sector stocks in both Canada and the US, sending all four Indexes lower. In Canada, the Energy and Basic Materials sectors helped limit the damage caused by the decline in the Technology and the Healthcare sectors.
In the US, fears of a third consecutive 0.75% interest rate hike by the Fed increased after last week’s strong jobs report. If Wednesday’s inflation report continues its upward trend it is likely the Fed will aggressively raise the interest rate. As a result of these fears, interest rate sensitive sectors such as Technology and Consumer Cyclicals had a rough day, dragging down all three American Indexes into the red. Not helping was weaker than expected reports from semiconductor companies.
Wednesday: A good day in the stock markets as the Technology and Consumer Cyclical sectors led the way in what were broad-based rallies in both Canada and the USA after the release of lower than expected inflation numbers in the US (8.5% rather than 8.8%). On Canada’s TSX, only the Utilities sector (a defensive sector) lost ground. In the US, news of slowing inflation led to the largest single day gain in two weeks for the Nasdaq and S&P, the largest single day in three weeks for the DJIA, and the entire US market was up 1%. Quite the little rally!
Thursday: The technology heavy Nasdaq and S&P returned a bit of Wednesday’s gains, while the more diversified DJIA, along with the energy & mining oriented TSX inched into the black. In Canada, the TSX was lifted to its highest close in two months thanks to higher oil prices driving up the share price of TSX listed energy companies.
In the US, yesterday’s euphoria over the lower than anticipated inflation rate ran into realty today as it dawned on investors that inflation is still high, and the Fed will still raise the baseline interest rate in September. The interest rate sensitive Technology and Consumer Cyclical sectors weighed down the S&P and Nasdaq despite a valiant attempt by the Energy sector lift them into positive territory with the DJIA.
Friday: The week ended on a good note with all four major North American Indexes gaining ground. In Canada, all Canadian sectors advanced with Basic Materials (natural resources) and Financials (bank stocks) leading the way.
In the US, with today’s advances, the S&P and the Nasdaq posted their fourth consecutive week of gains! The lower-than-expected CPI has given investors increased confidence that the worst of inflation is over, and a bull market may be around the corner. All eleven US S&P sectors gained ground, led by old favourites Consumer Cyclical and Technology sectors. It was a bit of surprise to see the US Energy sector at the bottom of the eleven sectors after being the leading sector for most of 2022.
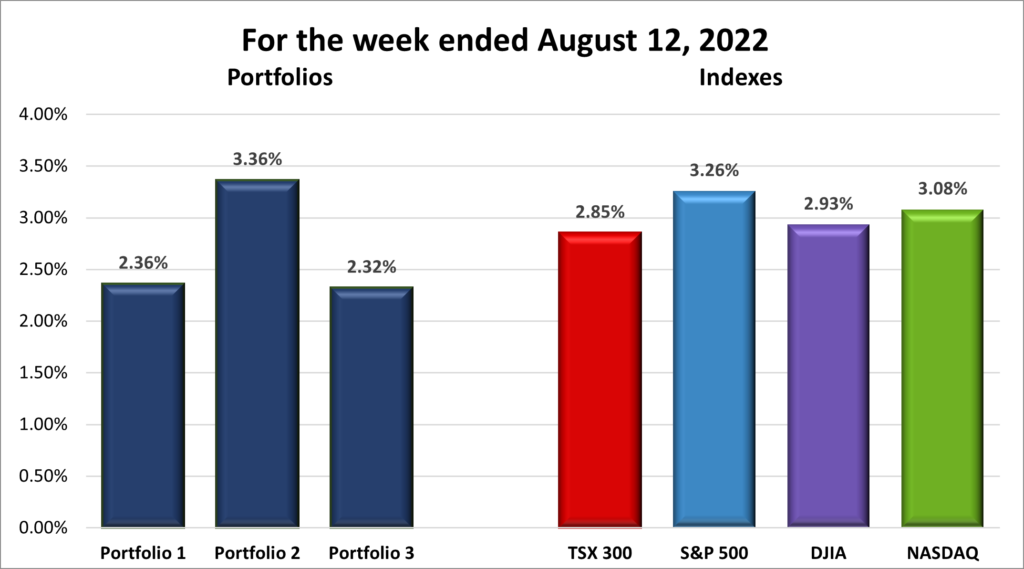
For the week, the TSX climbed 2.9%; for the fourth straight week the S&P 500 gained, this time 3.25%; the Dow rose 2.92%; and the Nasdaq jumped 3.08%.
Weekly Portfolio Review
Another good week for all four Indexes with each gaining 3+/- percent. As mentioned in the opening Spare Change section, since the start of the second half of 2022, the markets and Indexes have been making strong moves upward. The interest rate hikes by both countries’ central banks (Bank of Canada and the US Federal Reserve) appear to be baked into existing stock prices and investors appear to be cautiously optimistic the economy will continue to grow. Whatever it is, I am glad to see the Indexes heading north.
As glad as I am to see the Indexes heading upward, I am very happy to see the Portfolios growing. This week Portfolio 2 led the way, beating all four Indexes. This continues to surprise me as it is the most conservative of the three portfolios. It is anchored by two big growth companies but otherwise it is slow and steady, relatively safe and reliable, dividend paying companies (at least I call them safe and reliable). But slow growth is still growth, and that keeps moving Portfolio 2 forward while at the same time the dividends limit the downside in tough times like the start of 2022. There might be something to this strategy. 😊
As for Portfolio 1 and Portfolio 3, they did well, growing 2+%. Not as good as last weeks 4.9% and 5.7% but growth is still growth, and the portfolios are better off than they were at the start of the week. 😊
Companies on the Radar
Amazon (NASD:AMZN) and Ferrari (NYSE:RACE) remain on my Radar but they are moving away rather than closer. Joining them on mt radar this week is Canadian Natural Resources (TSX:CNQ).
Canadian Natural Resources is a Canadian explorer, developer and seller of natural gas, light crude oil, heavy crude oil, bitumen, and synthetic crude oil (SCO). Russia was one of the top natural gas producing and exporting countries in the world. However, the Russian invasion of Ukraine has led to increased global demand for natural gas from other natural gas producing countries, such as Canada, causing prices to remain high. Demand for natural gas and other CNQ products is expected to continue for several years, as the world scrambles to secure long-term liquified natural gas (LNG) supplies. Without the need to invest money in drilling more wells, CNQ is becoming cash rich. They can return cash to shareholders via dividends (currently at 4+%), or indirectly via share buybacks which increases shareholders’ piece of the pie. I like both! 😊
Portfolio Update
Portfolio 1
Portfolio 1 for the week ended August 12, 2022: UP ![]()
- Nvidia warned second-quarter revenue would end up 19% lower than the past quarter. While Data Center revenue reached a record high, it still fell short of analysts’ expectations thanks to supply chain issues. However, the reason for the revenue drop was a result of a 44% drop in revenue from their gaming business.
- Alphabet (NASD:GOOGL) offshoot Google Fiber announced plans to roll out high speed internet service across 5 states – Arizona, Colorado, Idaho, Nebraska, and Nevada.
In other Alphabet news, the Google was fined A$ 43 million for misleading Australians about how Google collected users’ location data. - In a sign of growing use of Marqeta’s (NASD:MQ) products among big name companies, Marqeta announced a partnership with Western Union in Europe; and, was named as the payment processor of choice by Mastercard Prepaid Management Services for Opal Plus, a new transit program in Australia. Two big deals with two large financial companies, in two distant parts of the world. I am taking this as a positive sign. 😊
- Tesla (NASD:TSLA) was back in the news, this time two American lawmakers are asking the National Highway Traffic Safety Administration for a briefing on their investigation into crashes involving Tesla vehicles that were using Tesla’s Autopilot and related driver assistance systems at the time of the crashes.
- Rogers Communications Inc (TSX:RCI.B) and Shaw Communications Inc (TSX:SJR.B) finalised an agreement to sell Freedom Mobile to Videotron, a unit of Quebecor Inc. This was the biggest issue standing in the way of the Rogers/Shaw merger receiving the blessing of Canada’s antitrust agency. It will be interesting to see how quickly the merger moves forward from here, both as a Shaw shareholder, Shaw internet subscriber and a Shaw mobile customer.
- The conglomerate Berkshire Hathaway (NYSE:BRK.B) lost US$ 43.8 billion last quarter, yes, billion. The fall in overall stock prices during the second quarter hammered the bottom line of Berkshire. However, Warren Buffet, president of Berkshire Hathaway and considered the best investors of all time, says to ignore fluctuations like this and remain focused on the long term. Despite the loss, the share price of Berkshire Hathaway hardly moved. You would think a loss of $43 billion would send some investors fleeing but Berkshire shareholders remain confident in Mr. Buffet’s ability to grow their wealth (as I do).
Activity
Sold: Auxley Cannabis Group (TSX:XLY): This was part of a basket of cannabis stocks. The highpoint was back when cannabis was legalized in Canada in October 2018. I should have sold it then but was in my buy and hold forever phase (I am no longer in a buy and hold forever in small niche companies). Since cannabis companies are no longer the ‘hot stocks,’ and the company has not shown any sign of growth, I finally decided to unload this stock. Lost about 90% on this one. Fortunately, wisely did not invest much in this company.
Sold: Greenlane Holdings (NASD:GNLN): Originally bought as Kushco Holdings, part of the same cannabis basket of stocks as Auxley. Unfortunately, same story – highpoint was October 2018, management never grew company. Hoped with numerous US states legalizing cannabis it would grow but it did not. Last straw was the recent 1 for 20 reverse split so the company could maintain its Nasdaq Exchange listing. Held onto this company way too long, losing 90+%. However, like Auxley, did not invest a lot in this company because it was high risk (and rightly so!).
Dividends
Dividends Received this week for the following companies:
Companies followed by DRIP (Dividend Re-Investment Plan) indicate additional shares were purchased with the dividend. Any cash leftover was added to the cash balance.
Canadian $
No C$ dividends this past week.
US $
Apple Inc.
Quarterly Reports
Crew Energy Inc.
All currency listed in thousands of Canadian dollars
Selected highlights from their second quarter 2022 financial results on August 9, 2022
- Revenue was $198,329 for the three months ended June 30, compared to $68,550 in the second quarter of 2021.
- Net income was $88,695 for the three months ended June 30, compared to a net loss of $23,138 in the second quarter of 2021.
- Revenue was $328,671 for the six months ended June 30, compared to $154,067 in the second quarter of 2021.
- Net income was $87,318 for the six months ended June 30, compared to a net loss of $27,185 in the second quarter of 2021.
- 89% reduction in bank debt relative to year end 2021, with only $8.1 million drawn on a $185 million credit facility at the end of June.
Unity Software Inc.
All currency listed in thousands of US dollars
Selected highlights from their second quarter 2022 financial results on August 9, 2022
- Revenue was $297,043 for the three months ended June 30, an increase of 9% from the second quarter of 2021.
- Loss from operations was $204,158 for the three months ended June 30, or 67% of revenue, compared to loss from operations of $149, or 55% of revenue, in the second quarter of 2021.
- Revenue was $617,169 for the six months ended June 30, compared to $508,334 in the second quarter of 2021.
- Loss from operations was $381,713 for the three months ended June 30, compared to a net loss from operations of $255,802 in the second quarter of 2021.
Magnite, Inc.
All currency listed in millions of US dollars
Selected highlights from their second quarter 2022 financial results on August 9, 2022
- Revenue of $137.8 for the three months ended June 30, up 20% year-over-year.
- Net loss of $25 for the three months ended June 30, compared to net income of $36.8 in the same period in 2021.
- Revenue of $255.9 for the six months ended June 30, up 46% year-over-year.
- Net loss of $69.5 for the six months ended June 30, compared to net income of $23.9 in the same period in 2021.
The Trade Desk, Inc.
All currency listed in millions of US dollars
Selected highlights from their second quarter 2022 financial results on August 9, 2022
- Revenue of $377 for the three months ended June 30, up 35% year-over-year.
- Net loss of $19 for the three months ended June 30, compared to net income of $48 in the same period in 2021.
- Revenue of $692 for the six months ended June 30, up 39% year-over-year.
- Net loss of $34 for the six months ended June 30, compared to net income of $70 in the same period in 2021.
Andlauer Healthcare group Ltd.
All currency listed in thousands of Canadian dollars
Selected highlights from their second quarter 2022 financial results on August 9, 2022
- Revenue increased 58.1% to $169.4 million, compared to $107.1 million for the three months ended June 30, 2021
- Net income increased 60.8% to $21.0 million, compared to $13.1 million for the three months ended June 30, 2021.
- Revenue increased 56.6% to $317,753, compared to $202,891 million for the six months ended June 30, 2021.
- Net income increased 51.9% to $37,456, compared to $24,662 for the six months ended June 30, 2021.
Nuvei Corporation
All currency listed in millions of US dollars
Selected highlights from their second quarter 2022 financial results on August 9, 2022
- Revenue of $211.3 for the three months ended June 30, up 19% year-over-year.
- Net income of $35.1 for the three months ended June 30, compared to net income of $38.9 in the same period in 2021.
- Revenue of $425.8 for the six months ended June 30, up 30% year-over-year.
- Net income of $39.6 for the six months ended June 30, compared to net income of $66.7 in the same period in 2021.
Celsius Holdings, Inc.
All currency listed in thousands of US dollars
Selected highlights from their second quarter 2022 financial results on August 9, 2022
- Revenue of $154.0 for the three months ended June 30, up 137% year-over-year.
- Net income of $9.2 for the three months ended June 30, compared to net income of $0.8 in the same period in 2021.
- Revenue of $287.4 for the six months ended June 30, up 150% year-over-year.
- Net income of $15.8 for the six months ended June 30, compared to net income of $1.4 in the same period in 2021. A gain of 1029%!
AcuityAds Holdings Inc.
All currency listed in Canadian dollars
Selected highlights from their second quarter 2022 financial results on August 10, 2022
- Revenue of $28,260,345 for the three months ended June 30, compared to $30,285,222 for the same period in 2021.
- Net income of $910,782 for the three months ended June 30, compared to net income of $3,361,572 in the same period in 2021.
- Revenue of $52,081,233 for the six months ended June 30, compared to $57,739,814 for the same period in 2021.
- Net loss of $3,579,611 for the six months ended June 30, compared to net income of $4,725,453 in the same period in 2021.
Copperleaf Technologies Inc.
All currency listed in Canadian dollars
Selected highlights from their second quarter 2022 financial results on August 10, 2022
- Revenue of $20,583,744 for the three months ended June 30, compared to $16,700,617 for the same period in 2021. An increase of 23%.
- Net loss of $7,425,678 for the three months ended June 30, compared to net loss of $1,505,576 in the same period in 2021.
- Revenue of $36,153,127 for the six months ended June 30, compared to $30,682,312 for the same period in 2021. An increase of 17%
- Net loss of $18,331,380 for the six months ended June 30, compared to net income of $3,393,368 in the same period in 2021.
Magnet Forensics Inc.
All currency listed in thousands of US dollars
Selected highlights from their second quarter 2022 financial results on August 10, 2022
- Revenue of $23,147 for the three months ended June 30, compared to $16,464 for the same period in 2021.
- Gross Margin of 93% in the second quarter 2022, compared to 94% in the second quarter 2021.
- Net loss of $1,018 for the three months ended June 30, compared to net income of $1,590 in the same period in 2021.
- Revenue of $42,933 for the six months ended June 30, compared to $31,126 for the same period in 2021.
- Net loss of $1,912 for the six months ended June 30, compared to net income of $4,368 in the same period in 2021.
- Anticipates revenues of $92.5 – $94.5 million, representing 32% – 34% growth over Fiscal 2021.
Marqueta, Inc
All currency listed in thousands of US dollars
Selected highlights from their second quarter 2022 financial results on August 10, 2022
- Revenue of $186,678 for the three months ended June 30, compared to $122,266 for the same period in 2021. An increase of 53%.
- Net loss of $44,688 for the three months ended June 30, compared to net loss of $68,554 in the same period in 2021.
- Revenue of $352,780 for the six months ended June 30, compared to $230,249 for the same period in 2021.
- Net loss of $105,286 for the six months ended June 30, compared to net loss of $81,392 in the same period in 2021.
Berkshire Hathaway Inc.
All currency listed in millions of US dollars
Selected highlights from their second quarter 2022 financial results on August 10, 2022
- Revenue of $76,180 for the three months ended June 30, compared to $69,114 for the same period in 2021. An increase of 53%.
- Net loss of $43,376 for the three months ended June 30, compared to net income of $28,425 in the same period in 2021.
- Revenue of $146,990 for the six months ended June 30, compared to $133,713 for the same period in 2021.
- Net loss of $37,791 for the six months ended June 30, compared to net income of $40,265 in the same period in 2021.
Kneat.com, Inc.
All currency listed in Canadian dollars
Selected highlights from their second quarter 2022 financial results on August 11, 2022
- Revenues increased 76% to $5.5 million, as compared to $3.1 million for the second quarter of 2021.
- Net loss of $3,633,888 for the three months ended June 30, compared to net loss of $1,519,315 in the same period in 2021.
- Revenue of $6,553,901 for the six months ended June 30, compared to $2,842,205 in the same period in 2021.
- Net loss of $7,060,148 for the six months ended June 30, compared to net loss of $5,799,153 in the same period in 2021.
Docebo Inc.
All currency listed in thousands of US dollars
Selected highlights from their second quarter 2022 financial results on August 11, 2022
- Revenue of $34,936 for the three months ended June 30, compared to $25,631 for the same period in 2021. An increase of 53%.
- Net income of $2,103 for the three months ended June 30, compared to net loss of $3,152 in the same period in 2021.
- Revenue of $66,991 for the six months ended June 30, compared to $47,373 for the same period in 2021.
- Net loss of $4,856 for the six months ended June 30, compared to net loss of $12,834 in the same period in 2021.
- Now used by 3,106 customers, an increase from 2,485 customers at the end of June 30, 2021.
Rivian Automotive, Inc.
All currency listed in millions of US dollars
Selected highlights from their second quarter 2022 financial results on August 11, 2022
- Revenue of $364 for the three months ended June 30, compared to $0 for the same period in 2021.
- Net loss of $1,712 for the three months ended June 30, compared to net loss of $580 in the same period in 2021.
- Revenue of $459 for the six months ended June 30, compared to $0 for the same period in 2021.
- Net loss of $3,305 for the six months ended June 30, compared to net loss of $994 in the same period in 2021.
- 98,000 Rivian R1 vehicles pre-ordered in Canada and the US as of June 30, 2022.
- As of June 30, 2022, approximately 8,000 vehicles produced since the start of production.
Algonquin Power & Utilities Corp.
All currency listed in millions of US dollars
Selected highlights from their second quarter 2022 financial results on August 11, 2022
- Revenue of $624,259 for the three months ended June 30, compared to $527,523 for the same period in 2021. An increase of 18%.
- Net income of $792 for the three months ended June 30, compared to net income of $18,320 in the same period in 2021.
- Revenue of $1,359,956 for the six months ended June 30, compared to $1,162,065 for the same period in 2021. An increase of 17%.
- Net income of $67,302 for the six months ended June 30, compared to net income of $35,604 in the same period in 2021.
WELL Health Technologies Corp.
All currency listed in thousands of Canadian dollars
Selected highlights from their second quarter 2022 financial results on August 11, 2022
- Revenue of $140.3 for the three months ended June 30, compared to $61.8 for the same period in 2021. An increase of 127% driven by acquisitions during the past year and organic growth.
- Net loss of $792 for the three months ended June 30, compared to net loss of $11,520 in the same period in 2021.
- Revenue of $266,834 for the six months ended June 30, compared to $87,353 for the same period in 2021. An increase of 305%.
- Net loss of $3,116 for the six months ended June 30, compared to net income of $19,040 in the same period in 2021.
- WELL Health delivered 833,819 total omni-channel patient visits in Q2-2022, representing a year over year increase of 49%.
- WELL Health is increasing its guidance for 2022 annual revenue to exceed $550 million from the previous guidance for annual revenue to exceed $525 million.
- In May 2022, began trading on the US OTCQX Market, a key step towards strengthening and broadening the Company’s American investor base.
Boston Omaha Corporation
All currency listed in US dollars
Selected highlights from their second quarter 2022 financial results on August 12, 2022
- Revenue of $9,825,164 for the three months ended June 30, compared to $7,952,832 for the same period in 2021. An increase of 23%.
- Net loss of $11,496,339 for the three months ended June 30, compared to net income of $8,637,563 in the same period in 2021. Includes the unrealized changes in market prices of investments in public equity securities in Boston Omaha’s reported earnings, primarily investment losses of $16,933,563 in the second quarter of 2022, which are mainly related to unrealized losses from public securities held by Boston Omaha and our United Casualty and Surety Insurance Company subsidiary.
- Revenue of $18,963,313 for the six months ended June 30, compared to $15,106,517 for the same period in 2021.
- Net income of $4,806,254 for the six months ended June 30, compared to net income of $93,075,190 in the same period in 2021.
Portfolio 2
Portfolio 2 for the week ended August 12, 2022: UP ![]()
A deposit was made on Friday. This amount was subtracted from the end of the week total and has been added to the starting amount of next to avoid skewing growth rate.
- Guardant Health (NASD:GH) announced the US Food and Drug Administration approved its Guardant360 CDx liquid biopsy test as a companion diagnostic for Daiichi Sankyo and AstraZeneca’s (NASD:AZN) Enhertu medication for treatment of certain patients with unresectable or metastatic HER2-mutant non-small cell lung cancer.
- The mouse roared! Thanks to Disney’s (NYSE:DIS) new guest experience package Genie+, Disney’s theme parks saw overall attendance increase dramatically in the latest quarter, increasing revenues by 70%. Genei+ is a premium ticket add-on allowing visitors to skip lines and reserve time slots for specific attractions. I remember using a similar package the last time I was at Disney World, and it was fantastic to go to the head of hour+ long lineups.
- Along with increase in revenue from its theme parks, Disney added more than 14 million subscribers to its Disney+ streaming service this past quarter. Combing all of Disney’s streaming services (including ESPN and Hulu), Disney has unseated Netflix (NASD:NFLX) as the #1 streaming service. People cannot get enough of Disney, either in person or on screen. 😊
Activity
No significant activity to report this week.
Dividends
Dividends Received this week for the following companies:
Companies followed by DRIP (Dividend Re-Investment Plan) indicate additional shares were purchased with the dividend. Any cash leftover was added to the cash balance.
No dividends this past week.
Quarterly Reports
Take Two Interactive Software, Inc.
All currency listed in millions of US dollars
Selected highlights from their first quarter 2023 financial results on August 8, 2022
- Revenue of $1,102.4 for the three months ended June 30, compared to $813.3 for the same period in 2021. An increase of 36%.
- Net loss of $104.0 for the three months ended June 30, compared to net income of $152.3 in the same period in 2021.
- Completed its combination with Zynga on May 23, 2022.
- Guidance for revenues between $5.73 billion to $5.83 billion and a net loss of $438 – 398 million.
Walt Disney Company
All currency listed in millions of US dollars
Selected highlights from their third quarter 2022 financial results on August 10, 2022
- Revenue of $21,504 for the three months ended June 30, compared to $17,022 for the same period in 2021. An increase of 26%.
- Net income of $1,502 for the three months ended June 30, compared to net income of $1,128 in the same period in 2021.
- Revenue of $62,572 for the nine months ended June 30, compared to $48,884 for the same period in 2021. An increase of 28%.
- Net income of $3,251 for the nine months ended June 30, compared to net income of $2,252 in the same period in 2021.
Kneat.com, Inc.
All currency listed in Canadian dollars
Selected highlights from their second quarter 2022 financial results on August 11, 2022
- Revenues increased 76% to $5.5 million, as compared to $3.1 million for the second quarter of 2021.
- Net loss of $3,633,888 for the three months ended June 30, compared to net loss of $1,519,315 in the same period in 2021.
- Revenue of $6,553,901 for the six months ended June 30, compared to $2,842,205 in the same period in 2021.
- Net loss of $7,060,148 for the six months ended June 30, compared to net loss of $5,799,153 in the same period in 2021.
Portfolio 3
Portfolio 3 for the week ended August 12, 2022: UP ![]()
- One of Shopify’s (TSX:SHOP) main growth drivers, merchants using the Shopify platform, is starting to feel the bite of rising costs and lower consumer spending. Shopify helps companies’ setup their online stores and payment systems in return for monthly fees. Through the first half of 2022, Shopify added 71,000 net merchants, well below the 314,000 merchants added in 2021, putting the company on pace for their lowest merchant additions since 2018.
- Enghouse Systems Ltd. (TSX:ENGH) is expanding its telemedicine service Vidyohealth’s capabilities to provide a better experience for patients, doctors, and providers. The service integrates health records, scheduling, and video conferencing, among other capabilities.
- Brookfield Asset Management (TSX:BAM.A) will essentially be broken into a parent company and a separate company. The parent company will be Brookfield Corporation, and they will own 75% of the spin off company. The spin off company will be the asset management component of the current Brookfield Asset Management. Making it more confusing, the spinoff will be called Brookfield Asset Management.
While going over their latest interim financial statements and press release, I noticed they have been calling the company Brookfield rather than Brookfield Asset Management.
Activity
No significant activity to report this week.
Dividends
Dividends Received this week for the following companies:
Companies followed by DRIP (Dividend Re-Investment Plan) indicate additional shares were purchased with the dividend. Any cash leftover was added to the cash balance.
No dividends this past week.
Quarterly Reports
Alvopetro Energy Ltd.
All currency listed in thousands of US dollars
Selected highlights from their second quarter 2022 financial results on August 9, 2022
- Revenue of $14,824 for the three months ended June 30, compared to $7,582 for the same period in 2021. An increase of 95%.
- Net income of $6,631 for the three months ended June 30, compared to net income of $1,834 in the same period in 2021.
- Revenue of $29,759 for the six months ended June 30, compared to $13,884 for the same period in 2021. An increase of 201%.
- Net loss of $17,746 for the six months ended June 30, compared to net income of $2,837 in the same period in 2021.
- Repaid an additional $2.5 million of their credit facility, bringing the balance outstanding to $2.5 million. As of June 30, 2022, had a net working capital surplus of $11.6 million, including $13.7 million in cash and cash equivalents.
Unity Software Inc.
All currency listed in thousands of US dollars
Selected highlights from their second quarter 2022 financial results on August 9, 2022
- Revenue was $297,043 for the three months ended June 30, an increase of 9% from the second quarter of 2021.
- Loss from operations was $204,158 for the three months ended June 30, or 67% of revenue, compared to loss from operations of $149, or 55% of revenue, in the second quarter of 2021.
- Revenue was $617,169 for the six months ended June 30, compared to $508,334 in the second quarter of 2021.
- Loss from operations was $381,713 for the three months ended June 30, compared to a net loss from operations of $255,802 in the second quarter of 2021.
Magnite, Inc
All currency listed in millions of US dollars
Selected highlights from their second quarter 2022 financial results on August 9, 2022
- Revenue of $137.8 for the three months ended June 30, up 20% year-over-year.
- Net loss of $25.0 for the three months ended June 30, compared to net income of $36.8 in the same period in 2021.
- Revenue of $255.9 for the six months ended June 30, up 46% year-over-year.
- Net loss of $69.5 for the six months ended June 30, compared to net income of $23.9 in the same period in 2021.
goeasy Ltd.
All currency listed in thousands of Canadian dollars
Selected highlights from their second quarter 2022 financial results on August 10, 2022
- Revenue of $251,652 for the three months ended June 30, compared to revenue of $205,356 in the same period in 2021.
- Net income of $38,300 for the three months ended June 30, compared to net income of $19,467 in the same period in 2021.
- Revenue of $483,794 for the six months ended June 30, compared to revenue of $372,530 in the same period in 2021.
- Net loss of $64,396 for the six months ended June 30, compared to net income of $131,442 in the same period in 2021.
Kneat.com, Inc.
All currency listed in Canadian dollars
Selected highlights from their second quarter 2022 financial results on August 11, 2022
- Revenues increased 76% to $5.5 million, as compared to $3.1 million for the second quarter of 2021.
- Net loss of $3,633,888 for the three months ended June 30, compared to net loss of $1,519,315 in the same period in 2021.
- Revenue of $6,553,901 for the six months ended June 30, compared to $2,842,205 in the same period in 2021.
- Net loss of $7,060,148 for the six months ended June 30, compared to net loss of $5,799,153 in the same period in 2021.
Fortuna Silver Mines Inc
All currency listed in millions of US dollars
Selected highlights from their second quarter 2022 financial results on August 10, 2022
- Sales of $167.9 million, an increase of 39% from the $120.5 million reported in the second quarter 2021.
- Net income of $1.7 million or $0.01 per share, compared to $16.2 million or $0.09 net income per share reported in the second quarter 2021.
- Free cash flow from ongoing operations of $21.9 million compared to $19.2 million reported in the second quarter 2021.
- Gold and silver production of 62,171 ounces and 1,652,895 ounces, respectively. An increase of 100% and a decrease of 13% respectively compared to the second quarter of 2021.
AcuityAds Holdings Inc.
All currency listed in Canadian dollars
Selected highlights from their second quarter 2022 financial results on August 10, 2022
- Revenue of $28,260,345 for the three months ended June 30, compared to $30,285,222 for the same period in 2021.
- Net income of $910,782 for the three months ended June 30, compared to net income of $3,361,572 in the same period in 2021.
- Revenue of $52,081,233 for the six months ended June 30, compared to $57,739,814 for the same period in 2021.
- Net loss of $3,579,611 for the six months ended June 30, compared to net income of $4,725,453 in the same period in 2021.
Brookfield Asset Management
All currency listed in millions of US dollars
Selected highlights from their second quarter 2022 financial results on August 11, 2022
- Revenue of $32,256 for the three months ended June 30, compared to $18,286 for the same period in 2021.
- Net income of $1,475 for the three months ended June 30, compared to net income of $2,429 in the same period in 2021.
- Revenue of $45,138 for the six months ended June 30, compared to $34,696 for the same period in 2021.
- Net income of $4,435 for the six months ended June 30, compared to net income of $6,205 in the same period in 2021.
- Investable Cash and Capital Increases to over $110 billion
- $21 billion of Assets Sold Since Last Quarter, Realizing $5 billion of Gains