
Market Manipulation: What It Is and Why It Matters to Investors?
After everything that’s gone down in the markets over the past couple of weeks – wild swings, big headlines, and whispers of manipulation – I figured it was a good time to talk about something that doesn’t come up often enough: how the stock market can be manipulated, and what that actually means for us investors.
At its core, market manipulation is when someone deliberately tries to mess with normal buying and selling to move stock prices in their favour. It’s like rigging the game so they win – at the expense of everyone else.
There are a few common ways this happens. One of the best-known is the pump and dump: someone hypes up a stock (usually a small, unknown one), gets people excited, watches the price shoot up – and then dumps all their shares for a profit, leaving everyone else holding the bag. Then there’s spoofing, where traders place large fake orders to make it look like there’s strong demand or supply, only to cancel those orders before they go through. It’s all designed to trick other traders into reacting.
Other tactics include wash trading – where someone buys and sells the same stock repeatedly to create the illusion of high activity – and spreading false info online to sway investor sentiment. Whatever the method, the goal is the same: push prices in a direction that benefits the manipulator.
Regulators like the Canadian Securities Administrators (CSA) here in Canada and the Securities and Exchange Commission (SEC) in the US are supposed to keep an eye on this kind of behaviour. They work with other watchdogs to investigate suspicious activity and help keep markets as fair as possible. But with social media and fast-moving headlines, it’s getting harder to separate genuine market reactions from something more calculated.
Market manipulation isn’t new. One of the earliest documented cases happened way back in 1814, when a man faked news of Napoleon’s death to trigger a surge in British bond prices – then cashed in once everyone bought in on the lie.
In Canada, manipulation has mostly shown up in old-school pump and dump schemes, especially with low-volume penny stocks on the TSX Venture Exchange. Promoters spread hype – usually online – and once the stock shoots up, they quietly sell off their shares and disappear. Regulators like the Ontario Securities Commission have cracked down on a few of these, but by then, the damage is usually already done.
Fast-forward to today, and some of those same tactics are showing up again – just dressed up in more high-tech ways. Take early April 2025: markets tanked after President Trump announced sweeping tariffs against all of America’s trading partners. But a few days later, he reversed course with a post online saying most of the tariffs were paused – except for those on Chinese imports. The sudden back-and-forth sent markets into a tailspin, with some people wondering if it was a kind of “reverse pump and dump.” Was it just poor communication, or something more strategic? We don’t know – but it definitely raised eyebrows.
So, is the recent market drama the result of manipulation? Maybe. Maybe not. Markets can react sharply to unexpected news, especially when it comes from high places. But when those wild swings seem to follow vague announcements or cryptic tweets, it’s fair to raise an eyebrow. Still, volatility alone doesn’t equal manipulation. Sometimes it’s just the market doing what it does best – responding to new information in real time. Proving actual intent, though, takes more than suspicion – it requires a thorough investigation.
Why does this matter to us investors? Because manipulation – whether intentional or not – can trigger overreactions that distort the real value of a stock. If you’re caught up in the frenzy, it’s easy to buy in too high or sell out too low. These swings can mess with your emotions, your decision-making, and even your long-term strategy. That’s why it pays to stay focused on quality companies, tune out the hype, and remember: the market’s short-term drama doesn’t change the fundamentals of a solid business.
Now that we’ve explored both historical and possible current examples of market manipulation, let’s shift gears and look at what actually drove markets during this Easter-shortened trading week.
Items that may only interest or educate me ….
Canadian Economic news, US Economic news, ….
Canadian Economic news
This past week’s key economic data that the Bank of Canada (BoC) considers when deciding whether to raise or lower the interest rate.
Bank of Canada rate decision
The BoC decided to hit the pause button, holding its benchmark interest rate at 2.75% after seven straight cuts since June 2024, when the rate stood at 5.0%. It’s the first break in the interest rate easing cycle and comes amid cooling inflation, slower consumer spending, and a softening job market. However, the central bank’s bigger concern was the uncertainty surrounding US trade policy. BoC Governor Tiff Macklem made it clear that the recent wave of US tariffs – and the chaotic way they’ve been rolled out – was a key factor in today’s decision.
In its latest Monetary Policy Report, the BoC laid out two possible paths forward: one where the impact of tariffs is relatively short-lived, leading to a temporary economic slowdown, and another where a prolonged trade war drags Canada into recession and pushes inflation above 3% next year.
Looking ahead, the BoC said it will be cautious with future moves, closely monitoring how trade disruptions affect demand, inflation trends, and consumer confidence.
Consumer Price Index (CPI)
Inflation in Canada cooled more than expected in March, according to the latest CPI report from Statistics Canada. Prices rose just 0.3% month over month – down sharply from February’s 1.1% increase and well below analysts’ expectations of 0.6%. On a yearly basis, inflation eased to 2.3%, down from 2.6% in February, while most economists had been expecting it to hold steady.
Drilling into the details: the biggest monthly price jump came from the ‘Alcoholic beverages, tobacco products and recreational cannabis’ category, which rose 2.3%. On the flip side, ‘Gasoline’ saw the largest monthly drop, falling 1.8%. Year over year, ‘Shelter’ – which includes mortgage costs and rent – remained the biggest contributor to inflation with prices up 3.9% – though that’s a slight slowdown from February’s 4.2%. ‘Gasoline’ again saw the largest annual decline, dropping 1.6%.
Core inflation – which excludes more volatile food and energy prices – rose just 0.2% in March, down from 0.9% the month before. On a yearly basis, the core rate cooled to 2.4% from 2.9%. The overall slowdown was mainly driven by lower gasoline and travel tour prices, which helped offset increases elsewhere – like restaurant food, which was up 3.2% compared to last year.
From an interest rate perspective, some analysts thought this report might push the BoC one step closer to cutting rates at its meeting the following day. With inflation continuing to ease toward the Bank’s 2% target, opinions were split on whether policymakers would stay the course or go ahead with another cut. In the end, those expecting the central bank to hit pause were right.
Canadian market volatility
The S&P/TSX 60 VIX (VIXC), Canada’s volatility gauge, started the week at an elevated 30.37 and gradually eased to close at 20.86. While still above the 20-mark – suggesting investors remain cautious – the lack of major developments on tariffs or other fronts helped keep volatility in check. After several weeks of sharp swings, it seems investors may be adjusting to the ongoing uncertainty around trade.
For those new to the VIXC, it’s essentially the Canadian market’s stress meter. Readings below 10 point to strong investor confidence, 10 to 20 signals business as usual, and anything over 20 means uncertainty is creeping in.
US Economic news
This past week’s key data points that the Federal Reserve (Fed) considers when deciding whether to raise or lower the interest rate.
Retail Sales
The Commerce Department’s advance estimate suggests Americans were in a buying mood last month, with retail sales jumping 1.4% in March – well ahead of February’s modest 0.2% rise and slightly beating analysts’ expectations of a 1.3% increase. Year over year, sales climbed 4.6%, up from 3.1% in February, as shoppers appeared to pull purchases forward to avoid looming US tariffs.
Core retail sales—which exclude autos, vehicle parts, and gas stations – also showed solid momentum, rising 0.8% in March after a 0.5% increase in February. On a yearly basis, core sales grew 4.5%, compared to 3.5% the month before.
Analysts widely agree that this spike wasn’t fueled by renewed consumer confidence but by shoppers rushing to lock in prices before tariffs kick in – especially on big-ticket items like motor vehicles, which jumped 5.3% in March compared to February. In other words, the strength in sales seems driven more by pre-emptive buying than by a fundamentally strong economy. And with consumer sentiment falling for the fourth straight month, it’s likely this spending surge will be short-lived.
American market volatility
The CBOE Volatility Index (VIX), often called the market’s “fear gauge,” opened this week at 34.76 – still high, but noticeably calmer than last week’s spike above 60, which marked full-blown panic levels. With no new tariff bombshells to jolt the markets, the VIX drifted lower into the low 30s and held there for most of the week, before dropping below 30 at the last minute on Friday to close at 29.65. While it’s a step down from last week’s chaos, the VIX is still well above normal levels, signalling that investors are still on edge.
For anyone new to the VIX, think of it as the market’s stress meter. Below 12 means calm, 12–20 reflects normal volatility, and anything above 20 points to growing uncertainty.
Weekly Market and Portfolio Review
For the week, the TSX (SPTSX) gained 2.6%, the S&P 500 (SPX) dropped 1.5%, the DJIA (INDU) fell 2.7% and the Nasdaq (CCMP) sank 2.6%.
| Index | Weekly Streak |
| TSX: | 2 – week winning streak |
| S&P: | 1 – week losing streak |
| DJIA: | 1 – week losing streak |
| Nasdaq: | 1 – week losing streak |
![]()
![]() This past week, the markets finally caught their breath. There were no dramatic tweets to send stocks soaring or tumbling, and after weeks of being tossed around like a yoyo, things calmed down – at least for a bit. All four major indexes – the Toronto Stock Exchange (TSX), the S&P 500 (S&P), the Dow Jones Industrial Average (DJIA), and the Nasdaq Composite (Nasdaq) – started the week on a positive note. But as the days went on, Canadian and US markets began to diverge, as shown in the weekly progress chart above.
This past week, the markets finally caught their breath. There were no dramatic tweets to send stocks soaring or tumbling, and after weeks of being tossed around like a yoyo, things calmed down – at least for a bit. All four major indexes – the Toronto Stock Exchange (TSX), the S&P 500 (S&P), the Dow Jones Industrial Average (DJIA), and the Nasdaq Composite (Nasdaq) – started the week on a positive note. But as the days went on, Canadian and US markets began to diverge, as shown in the weekly progress chart above.
The shortened trading week leading into the Easter holiday began with a tailwind. The Trump administration granted temporary tariff exemptions on a range of electronics – including smartphones, laptops, and networking gear – helping to lift investor sentiment. The market largely shrugged off the fact that these exemptions were, well, temporary, and that new tariffs on semiconductors and other tech products are still waiting in the wings.
While the week lacked the wild swings we’ve seen recently, there was no shortage of tension. Strong earnings from the big banks helped bring some stability, even as investors kept a wary eye on ongoing trade uncertainty. Midweek, it wasn’t a presidential tweet but Fed Chair Jerome Powell who stirred the pot. Powell warned that the current trade policy could result in “higher inflation and slower growth,” creating a “challenging scenario” for the Fed as it tries to balance its dual mandate – keeping inflation under control and supporting job growth. Needless to say, that didn’t sit well with President Trump, who continues to argue that tariffs are the best thing ever for America.
Meanwhile, the tech sector took a hit, dragging down the rest of the American markets, after Nvidia (NASD: NVDA) disclosed a US$5.5 billion write-down linked to new US restrictions on artificial intelligence (AI) chip exports to China. The crackdown specifically targets Nvidia’s H20 chips, which were previously designed to comply with earlier rules. Now they’re stuck in licensing limbo. AMD (NASD: AMD) also got caught up in the AI restrictions, announcing an $800 million write-down of its own. Tech stocks stumbled on the news, and investors were reminded just how much global tensions can rattle the AI boom.
Despite the headwinds, the long-term AI outlook remains solid, as companies adapt by shifting supply chains and investing more heavily in domestic production. Nvidia is already expanding US -based manufacturing, with plans for new facilities in Arizona and Texas.
North of the border, the TSX was the week’s standout among the indexes. Soaring gold prices – continuing their record-setting run – combined with a rally in oil, helped push the index to its biggest weekly gain since September 2024. The jump in oil came on the heels of new US sanctions on Iranian oil exports which is expected to tighten global supply. Cooling inflation also gave investors some relief. The only minor downside was the BoC ending its streak of seven consecutive rate cuts and, on a more ominous note, warning that a prolonged trade war with the US could tip the Canadian economy into recession. Still, investors seemed to take the pause and the recession risk in stride.
All things considered, it was nice to get a calmer, less volatile week. Trade uncertainty is still weighing on sentiment, but progress on major deals – particularly with larger partners – could shift the tone. It would’ve been even better if US markets had followed Canada’s lead into the green. But there’s always next week. 😊
| Portfolio | Weekly Streak |
| Portfolio 1: | 1 – week losing streak |
| Portfolio 2: | 1 – week winning streak |
| Portfolio 3: | 2 – week winning streak |
![]()
![]() After last week’s big gains, I was cautiously optimistic that all three portfolios would keep the momentum going – especially Portfolios 1 and 3, which were aiming for back-to-back wins. But a clean sweep wasn’t in the cards, as you can see in the chart below. One company ended up being the spoiler.
After last week’s big gains, I was cautiously optimistic that all three portfolios would keep the momentum going – especially Portfolios 1 and 3, which were aiming for back-to-back wins. But a clean sweep wasn’t in the cards, as you can see in the chart below. One company ended up being the spoiler.
Portfolio 1 was the only one to finish in the red, down 2.7% on the week. And it wasn’t for lack of effort: 75% of the holdings posted gains, with International Petroleum Corp (TSE: IPCO) surging 16% and Magnite (NASD: MGNI) climbing 15%. Unfortunately, the tech giants weighed it down. Amazon.com (NASD: AMZN), Alphabet (NASD: GOOGL), and especially Nvidia – Portfolio 1’s largest holding – tumbled, with Nvidia dropping 6%. How Nvidia goes, so goes the portfolio… and this week, it went down. ☹
Portfolio 2 had the strongest showing this week, rising 1.4% and putting an end to a weekly losing streak that had stretched to three straight weeks. An impressive 85% of the holdings were in the green for the week, helped along by a strong showing from its energy stocks. Whitecap Resources Inc. (TSE: WCP) led the way with a 10% gain, giving the portfolio a solid lift.
Portfolio 3 also finished higher, up 1.0%. Like Portfolio 2, it had 85% of companies posting weekly gains, but it didn’t get quite the same boost from the energy sector. Still, it was helped by Magnite’s 15% rally, which made its presence felt across more than one portfolio.
Despite a mixed week for both the indexes and my portfolios, I’m staying focused on the long game – investing in quality companies and letting time do the heavy lifting. Market dips are a double-edged sword. On one hand, they can present great buying opportunities, like my purchase of a few shares of Interactive Brokers (NASD: IBKR). On the other, they can be frustrating in the moment (thanks, Nvidia). That said, I’m confident the strong companies I own will keep delivering over time. If the market wants to head higher again soon, I won’t complain. 😊

Companies on the Radar
 Another week with minimal changes to my radar list, as I added a company that’s been on my radar before and removed one that’s fallen off. I’ve decided to take Barrick Gold Corporation (TSE: ABX) off the list. With gold hitting record highs in March and again as recently as April 11, I expected a top-tier gold miner like Barrick to see a stronger lift. And while the stock has climbed, it also dropped sharply the previous week. Maybe that dip was a missed buying opportunity – but if it’s falling when I think it should be rising, that might be a sign the gold sector is outside my circle of competence. 😊
Barrick’s performance also seems tightly tethered to the price of gold, and I generally prefer companies that aren’t so closely tied to the unpredictable nature of commodities. Whether it’s oil, gold, or agriculture, commodity-driven stocks can be volatile – and a lot tougher to evaluate. So, with all that in mind, I’m moving on. There are plenty of other companies out there.
One of those other companies out there was Interactive Brokers, which jumped back onto my radar last week. After listening to its first quarter earnings call, I liked what I heard. With Mr. Market offering shares at a discount, I decided it was the right time to become an owner. 😊
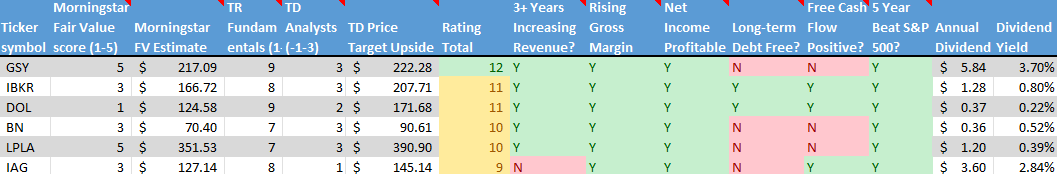
With Interactive Brokers briefly appearing on my radar before quickly moving into Portfolio 1, and Barrick Gold dropping off, my radar list now consists of five companies:
- goeasy Ltd. (TSE: GSY): A mid-cap Canadian company offering non-prime leasing and lending services. Higher risk, but high potential if they manage credit cycles well.
- Dollarama (TSE: DOL): A growing large-cap Canadian discount retailer that’s also expanding into South America. With a recession expected in Canada, discount retailers are seeing an increase in business.
- Brookfield Corporation (TSE: BN): A large-cap Canadian heavyweight in alternative asset management and real estate investing. Big, diversified, and built for the long haul.
- LPL Financial Holdings Inc. (NASD: LPLA): A large-cap US firm providing a brokerage and advisory platform for independent financial advisors. Benefiting from long-term trends in wealth management.
- iA Financial Corporation (TSE: IAG): A large-cap Canadian financial services firm with a solid insurance business in both Canada and the US. Steady and reliable.
As always, these are not buy recommendations – be sure to do your own research and make decisions that align with your personal financial goals!
The Radar Check was last updated April 17, 2025.

Portfolio Update
Portfolio 1
Buy: This past week, I added Interactive Brokers to my portfolio – a move I’ve been mulling over for a while now. Founded in 1977 by Thomas Peterffy, a pioneer in electronic trading, the company has grown into a global powerhouse. Though Peterffy passed away earlier this year, he was still Chair of the Board at the time, and his legacy lives on in the tech-driven brokerage he built. Today, IBKR offers direct access to stocks, options, futures, forex (foreign exchange trading), bonds, ETFs, and even crypto, spanning 160+ exchanges across 36 countries.
What drew me to Interactive Brokers is its blend of low-cost trading, global reach, and innovative technology. It’s not just popular with institutions – many individual investors I follow and respect use the platform themselves. Despite ongoing market volatility, the company continues to post record-breaking trading volumes and impressive client growth. In Q1 2025 alone, IBKR added 279,000 new accounts – a 32% increase year-over-year.
The moat here feels real. Its advanced platform, competitive pricing, and vast market access create high switching costs. Once you’re in the IBKR ecosystem, it’s tough to leave. The company is also pushing hard into Canada, Europe and Asia, and making strides in crypto trading – particularly in the European Union.
Financially, IBKR looks strong: consistent revenue and earnings growth, a return on capital over 15%, and a rock-solid balance sheet. It recently raised its quarterly dividend to $0.32 per share, though it hasn’t been active on the share buyback front – something I’ll be keeping an eye on. A recent 4-for-1 stock split will also expand the share count further.
That said, no investment is without its risks, and IBKR has a few yellow flags. The rising share count – including the split – could lead to shareholder dilution if not offset by strong earnings growth or buybacks. The dividend, while growing, remains relatively modest. As a global company, IBKR also faces exposure to regulatory shifts, currency moves, and geopolitical tensions. Plus, since much of its revenue is tied to trading activity, quieter markets can affect results. And while the platform is known for its depth and tools, it may feel overwhelming to newer investors. In a competitive field with players like TD Bank (TSE: TD), Charles Schwab (NYSE: SCHW) and Morgan Stanley (NYSE: MS), IBKR has to keep innovating to maintain its edge.
All in all, I see IBKR as a long-term compounder in the brokerage space, with optionality in new asset classes and geographies. It’s the kind of stock I’m happy to own – not just as an investor, but possibly as a future user of the platform too.
That’s a wrap for this week—may your portfolio stay green and your dividends steady. See you next time!