
Sometimes Saying Goodbye Is the Hardest Part
The previous week I decided to sell some shares in Telus (TSE: T), as explained in the May 8 Weekly Update. One of the hardest parts of investing is knowing when to sell. When you first start investing, you hear endless discussions about what stocks to buy, what sectors are hot, and which companies could become the next big winner. But far fewer people talk about the other side of investing: when it actually makes sense to sell.
For me, as a long-term investor, selling initially felt almost wrong. After all, aren’t long-term investors supposed to just hold forever? That’s what I believed for a long time, but it’s not exactly true.
In reality, even the best investors sell stocks from time to time. The key is understanding why you are selling. Good sell decisions are usually based on the company changing – not simply because the stock price moved up or down.
One of the clearest reasons to sell is when the original reason you bought the company no longer exists. Maybe growth has slowed dramatically, management has changed for the worse, debt has piled up, or the company lost its competitive advantage. When the story changes, it’s okay for your investment decision to change too. That was the case with my decision to sell FuboTV (NASDAQ: FUBO). I originally invested because the company planned to integrate real-time gambling into its live sports broadcasts. But when management dropped the gambling angle to focus solely on streaming, I felt the company would struggle against much larger competitors, so I decided to move on.
Another reason investors sell is valuation. Even great companies can become overpriced. If a stock runs too far ahead of the company’s actual growth, future returns can become harder to achieve. That doesn’t automatically mean you should rush to sell, but it can justify trimming a position or looking for better opportunities elsewhere. I’ve never fully exited a stock for valuation reasons alone, but it was part of the reason I trimmed my position in Shopify (TSE: SHOP).
Sometimes a stock simply no longer fits your investing goals or risk tolerance. That was part of my decision to trim my Telus shares. As investors, our portfolios should evolve alongside our financial goals, experience, and comfort with risk.
Sometimes selling has nothing to do with the company itself. Since we only have so much money to invest, every holding competes against other opportunities. If another company offers stronger growth prospects, better financials, or a more attractive valuation, reallocating your capital can make sense. That was my thinking when I sold Cargojet (TSE: CJT) back in March 2024 and used the cash to invest in Celestica (TSE: CLS). That decision turned out alright – Cargojet shares are down 24%, while Celestica has climbed 773%. 😊
There’s also an emotional side to selling that newer investors often underestimate. Watching a stock fall can tempt investors to panic sell, while watching one soar can encourage holding on forever. Successful investing usually means separating emotions from the actual business performance underneath the stock ticker. I remember those feelings well. 😊 Fortunately, I’ve avoided panic selling during major downturns like the start of the COVID-19 pandemic or, more recently, when the US upended global trade in April 2025.
One mindset that has helped me is remembering that investing in a company does not have to be forever. As investors, we are constantly learning, adapting, and updating our opinions as new information becomes available. Selling does not mean you failed. Often, it simply means your capital may have a better opportunity somewhere else.
At the end of the day, buying gets most of the attention, but selling is just as important to long-term investing success. Knowing when to move on can be every bit as valuable as knowing when to buy in the first place.
With that in mind, let’s take a look at how the week unfolded across the markets and the impact it had on my three portfolios.
Items that may only interest or educate me ….
Alphabet is #1?, Canadian Economic news, US Economic news, ….
Alphabet is #1?
When people think about the world’s most valuable company, the first name that usually comes to mind is Nvidia (NASDAQ: NVDA). After all, the company sits at the centre of the rapidly growing AI industry thanks to its dominant position in AI chipmaking – the “brains” powering today’s artificial intelligence (AI) boom. Nvidia constantly seems to be in the headlines, often accompanied by the phrase “the world’s most valuable company.”
But that title may not belong to Nvidia forever.
Alphabet (NASDAQ: GOOGL), best known as the parent company of Google, has been quietly closing the gap. While it may not manufacture the chips everyone is rushing to buy, it has built a collection of large, scaled businesses that have helped it reach the #2 spot and continue to gain on Nvidia.
Of course, there is Google Search, which has become so dominant that “Google it” is now part of everyday language, alongside major platforms like YouTube, Google Cloud, and Waymo, the self driving car service.
But what makes Alphabet more interesting is what sits beneath those headline names. The company also owns DeepMind, one of the world’s leading AI research labs; Verily in healthcare and life sciences; Wing in drone delivery; Fitbit in wearables; Nest in smart home devices; and Google Fiber in high-speed internet infrastructure. Individually, these are significant businesses – but together they span search, video, cloud computing, AI research, healthcare, autonomous systems, consumer hardware, and connectivity.
What stands out is not any single growth engine, but the scale and diversity of these already-mature businesses operating side by side. While Nvidia currently dominates the AI moment through its leadership in chips, Alphabet has steadily built exposure across nearly every layer of the modern digital economy.
Each segment on its own is already a major business, and they continue to expand independently. AI is certainly part of the story – from DeepMind to Alphabet’s own chip development efforts – but it sits within a much broader foundation rather than defining it.
If these businesses continue compounding over time, Alphabet’s strength may come less from any single breakthrough and more from the scale and balance of its entire portfolio. That combination is what has already made it the second most valuable company in the world – and what increasingly puts it within striking distance of Nvidia for the top spot.
Canadian Economic news
This past week’s key economic data that the Bank of Canada (BoC) considers when deciding whether to raise or lower the interest rate.
Canadian Market Volatility
Canada’s version of the market “fear gauge” is the S&P/TSX 60 VIX Index (VIXC), often shown on trading platforms as VIXI.TO. Like the better-known CBOE Volatility Index in the US, it measures expected volatility in the Canadian stock market over the next 30 days.
The index opened the week at 17.24 following renewed geopolitical tensions after the US rejected Iran’s response to a peace proposal and briefly moved closer to 18 on concerns around rising inflation in the US. From there, the VIXC gradually drifted lower through the rest of the week, eventually closing at 15.50.
Overall, volatility steadily eased as the week progressed. The decline in the VIXC suggests investors became more comfortable with the market backdrop despite ongoing geopolitical risks and swings in commodity prices. It also highlights the relatively defensive composition of the Canadian market, where sectors like financials, energy, and mining tend to produce smoother overall market movements compared to more tech-heavy indexes in the US.
US Economic news
This past week’s key data points that the Federal Reserve (Fed) considers when deciding whether to raise or lower the interest rate.
Consumer Price Index (CPI)
The April inflation report came in hotter than investors were hoping for, adding to concerns that inflation may be starting to move in the wrong direction again. Data from the Bureau of Labor Statistics showed headline inflation rose 0.6% in April, in line with expectations but down from March’s 0.9% jump. On a yearly basis, however, inflation re-accelerated to 3.8%, up from 3.3% in March and slightly above forecasts of 3.7%.
As in March, energy was the primary culprit. Fuel oil for home heating jumped 5.8% on the month and is now up 54.3% year over year, with the ongoing war with Iran keeping pressure on fuel markets. Shelter also stayed sticky. This category, which includes rent and homeowner costs and makes up the largest share of the CPI basket, rose 0.6% in April after a 0.3% increase in March, pushing the annual rate up to 3.3%.
There were still a few pockets of relief. Medical care commodities (healthcare-related goods, but not services) fell 0.4% in the month, while used car and truck prices continued to cool, down 2.7% year over year and extending one of the clearer disinflation trends since 2023.
Looking at the underlying picture, core CPI – which excludes food and energy and is closely watched by the Fed – also edged higher. It rose 0.4% in April, up from 0.2% in March, while the annual rate ticked up to 2.8% from 2.6%. That uptick suggests inflation pressures may be becoming more broad-based again rather than isolated to a few categories.
Overall, inflation is still sticky enough to complicate the outlook for both consumers and investors. Households continue to feel it in essentials like gas, groceries, and utilities, which naturally leaves less room for discretionary spending, while higher prices also keep upward pressure on interest rates and weigh on growth-oriented parts of the market.
As a result, rate-cut expectations have continued to drift further out this year, even with incoming Fed Chair Kevin Warsh set to take over. Many analysts are now pointing to oil as the key swing factor from here since sustained energy prices would make it difficult for inflation to trend meaningfully lower in the near term.
That’s what makes the next few inflation reports so important. Investors will be watching closely to see whether this is just an energy-driven spike tied to geopolitics, or the start of a more persistent second wave of inflation.
Retail Sales
The Census Bureau’s retail sales data for April showed sales rose 0.5%, following a strong 1.7% gain in March. That matched expectations and marked the third straight monthly increase. On a year-over-year basis, sales were up 4.9%, suggesting consumers are still spending at a healthy pace, even if momentum has cooled slightly from earlier in the year. Higher fuel prices helped support headline spending in the month, with strength at the pump offsetting softer trends in more discretionary categories.
But the details tell a more nuanced story.
A large part of the monthly gain came from higher prices at the pump, with gas stations leading all categories. Sales at the pump rose 2.8% in April, while furniture and home furnishings stores saw the biggest drop, falling 2.0%. Over the past year, gas stations posted the strongest growth at 20.9%, while furniture retailers saw the steepest decline at 3.6%, highlighting the pressure higher prices are putting on discretionary spending.
Core retail sales – which exclude autos and gasoline – also rose 0.5% in April, after a 0.6% increase in March. Annual core sales increased 4.9%, suggesting consumer spending remained relatively resilient even beyond the boost from higher fuel prices. Still, weakness in some discretionary categories points to consumers becoming more cautious with non-essential spending.
Overall, the consumer hasn’t cracked, but spending is becoming more sensitive to inflation. Higher energy prices are acting like a quiet tax on households, with more income going toward essentials like fuel and less left for discretionary purchases.
American Market Volatility
The CBOE Volatility Index (VIX), often referred to as the market’s “fear gauge,” measures expected volatility in the S&P 500 over the next 30 days. In simple terms, it reflects how much uncertainty investors are pricing into the market. The VIX typically rises when fear increases and falls when markets feel more stable. Readings above 20 are often associated with elevated concern, and throughout the week the index stayed below that level, suggesting investors remained relatively composed despite ongoing geopolitical tensions.
The VIX began the week at 18.21 following renewed headlines around the US-Iran situation. It briefly moved higher, touching just above 19 after hotter-than-expected inflation data, before easing back as markets stabilized and sentiment improved through the middle of the week. On Friday, volatility picked up again after renewed US-Iran rhetoric around the Strait of Hormuz pushed oil prices higher, sending the VIX back above 19.
By the end of the day, however, the index faded from that spike and settled at 18.43, close to where it started. Overall, while there were brief bursts of volatility tied to inflation and end-of-week energy market concerns, conditions remained relatively contained, reflecting a market that was cautious at times but not broadly fearful.
Weekly Market and Portfolio Review
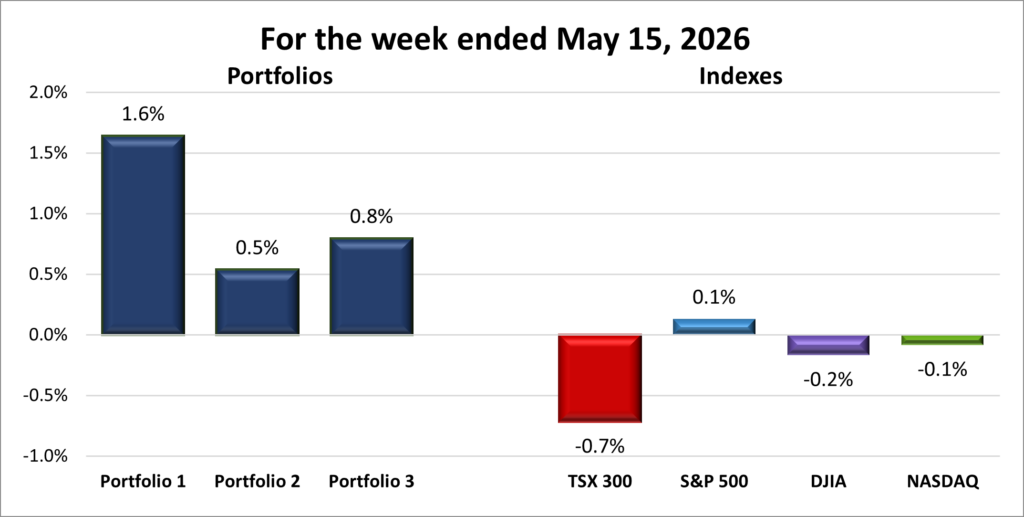
For the week, the TSX (SPTSX) fell 0.7%, the S&P 500 (SPX) increased 0.1%, the DJIA (INDU) dropped 0.2% and the Nasdaq (CCMP) slipped 0.1%.
| Index | Weekly Streak |
| TSX: | 1 – week losing streak |
| S&P: | 7 – week winning streak |
| DJIA: | 1 – week losing streak |
| Nasdaq: | 1 – week losing streak |
![]()
![]() The week got off to a slow start, but momentum picked up as the days went on before a late pullback dragged the Toronto Stock Exchange Composite Index (TSX), the Dow Jones Industrial Average (DJIA), and the Nasdaq Composite Index (Nasdaq) into the red, ending their respective win streaks. For the Nasdaq, that marked the end of its six-week run. The S&P 500 Index (S&P) was the only major index to hold onto gains, extending its weekly winning streak to seven weeks – its longest since December 2023.
The week got off to a slow start, but momentum picked up as the days went on before a late pullback dragged the Toronto Stock Exchange Composite Index (TSX), the Dow Jones Industrial Average (DJIA), and the Nasdaq Composite Index (Nasdaq) into the red, ending their respective win streaks. For the Nasdaq, that marked the end of its six-week run. The S&P 500 Index (S&P) was the only major index to hold onto gains, extending its weekly winning streak to seven weeks – its longest since December 2023.
The S&P and Nasdaq continued their recent hot streaks, briefly extending their daily record closing streaks before pausing early in the week. After that breather, both indexes rebounded with another pair of record closes before easing on Friday. Along the way, the S&P crossed above 7,500 for the first time ever. The DJIA also joined the rally, climbing back above 50,000 for the first time since February and setting a record high on Thursday.
Much of the momentum continued to come from the AI trade. Investors rotated back into semiconductor and technology companies tied to AI infrastructure, including chips, networking equipment, cloud computing, and data centres. The rally received an additional boost after the US approved sales of Nvidia’s H200 AI chips to several Chinese firms, easing concerns around restrictions on global AI demand. Strong earnings and upbeat forecasts from several technology companies added further support.
At the same time, inflation and interest rates remained a key overhang. Both consumer and producer inflation data came in hotter than expected, with producer prices posting their largest increase in four years. Earlier in the week, investors largely looked through the data as AI optimism and strong earnings carried sentiment higher. However, those concerns resurfaced at the end of the week, contributing to the late pullback across major indexes as investors reassessed the outlook for interest rates.
Geopolitics also remained an important backdrop. Investors tracked US-China discussions around trade, AI, and global supply chains, with early signs of easing tensions supporting sentiment. Later in the week, attention shifted back to energy markets as concerns around Iranian oil supply added to inflation risks.
The US/Israel-Iran conflict entered its 11th week, and with negotiations stalled, there was still no clear path to resolution. The key risk for markets is that prolonged disruption could keep oil prices elevated and make inflation harder to bring under control. For now, markets appear to be betting the situation will eventually stabilise, but the longer it persists, the more it adds to overall uncertainty.
In Canada, the TSX continued to trade near record territory, but a late pullback pushed the index into the red for the week. Unlike US markets, where AI and large-cap technology stocks continue to dominate, the TSX was driven by a broader mix of sectors including energy, mining, financials, and select technology names.
Commodities were the main driver early in the week. Energy stocks benefited from elevated oil prices as tensions involving Iran kept supply risks in focus. With the TSX heavily weighted toward oil and gas compared to US markets, movements in crude continue to have an outsized impact. Investors also remained focused on the Strait of Hormuz, where any disruption to shipments could further tighten global supply.
Gold was more volatile. Prices held firm early in the week amid geopolitical uncertainty but softened later as investors grew more cautious about the outlook for inflation and interest rates. Earlier in the week, markets largely ignored the hotter US inflation data, but those concerns resurfaced toward the end of the week and contributed to the broader pullback in commodities.
Technology stocks contributed modestly, though the sector is still a smaller part of the TSX compared to US benchmarks. Canadian technology names tied to AI infrastructure, semiconductors, and digital services continued to attract interest as AI remained a global market theme.
Overall, the week was a reminder that markets are still being pulled in two directions. On one hand, AI and strong earnings continue to fuel optimism and push indexes higher. On the other, inflation and geopolitical uncertainty remain close enough to quickly shift sentiment back toward caution. For now, leadership is still concentrated in a relatively small group of sectors, led by technology and energy.
| Portfolio | Weekly Streak |
| Portfolio 1: | 2 – week winning streak |
| Portfolio 2: | 7 – week winning streak |
| Portfolio 3: | 2 – week winning streak |
![]() All three portfolios looked poised to extend their winning streaks before Friday’s selloff, when all four major indexes dropped more than 1%. In the end, it was enough to push the TSX, DJIA, and Nasdaq into the red for the week, while the S&P narrowly held onto gains. Fortunately, all three portfolios also managed to hold on to their weekly gains. It’s not often the broader markets finish lower while all three portfolios manage to swim against the current. A pleasant surprise for the week. 😊
All three portfolios looked poised to extend their winning streaks before Friday’s selloff, when all four major indexes dropped more than 1%. In the end, it was enough to push the TSX, DJIA, and Nasdaq into the red for the week, while the S&P narrowly held onto gains. Fortunately, all three portfolios also managed to hold on to their weekly gains. It’s not often the broader markets finish lower while all three portfolios manage to swim against the current. A pleasant surprise for the week. 😊
Portfolios 1 and 3 both received a solid boost from Nvidia, the largest holding in each portfolio, as the stock continued riding the AI tailwind driving much of the market’s momentum. Nvidia received an additional lift after the US approved sales of its H200 AI chips to several Chinese firms, helping push the shares to another record high. The stock finished the week up 4%, providing a meaningful boost to both portfolios.
Portfolio 1 was the standout performer, gaining 1.6% despite only 49% of its holdings finishing higher on the week. Several AI-related names helped drive the gains, including Apple (NASDAQ: AAPL), Nvidia, Lattice Semiconductor (NASDAQ: LSCC) and Datadog (NASDAQ: DDOG), all of which reached record highs. CrowdStrike (NASDAQ: CRWD) also continued its strong momentum, climbing 13% during the week.
Portfolio 2 had a quieter week, advancing 0.5%. Instead of one major winner, gains were spread more evenly across the portfolio, with 53% of holdings finishing higher. Elevated oil prices continued supporting energy stocks, helping South Bow (TSE: SOBO) and TC Energy (TSE: TRP) reach record highs. That strength helped offset a sharp 21% decline in Birkenstock (NYSE: BIRK).
Portfolio 3 also rode the AI wave, climbing 0.8% as half of its holdings posted weekly gains. Alongside Nvidia, both 5N Plus (TSE: VNP), and Vertiv Holdings (NYSE: VRT) reached fresh record highs during the week.
Next week could be another major test for the markets as Nvidia reports first-quarter earnings. Expectations are high, with analysts expecting some of the company’s strongest revenue growth in over a year thanks to continued demand for AI chips. Given how much weight Nvidia carries in the broader AI-fuelled rally, not to mention Portfolios 1 and 3, its results could make for a volatile week across both the markets and the portfolios. As a shareholder, I’m certainly hoping the company can once again deliver the kind of strong results and guidance that have helped fuel the AI rally, and the value of the portfolios, over the past few years. Fingers crossed. 😊
Companies on the Radar
 This week, with only two companies on my Radar List, I decided to clean house. Medpace Holdings, (NASDAQ: MEDP), the American healthcare company that helps biotech and pharmaceutical companies run clinical trials goes to the backburner, while I decided to drop Xylem Inc. (NYSE: XYL), the American water technology. The company had been on the list for a few months, but despite scoring reasonably well on my Quick Test, nothing about the business or growth story really grabbed my attention, so I decided it was time to move on.
With my Radar List suddenly looking bare, I started revisiting a few names that I had previously pushed to the backburner, mostly because they looked overpriced at the time. But with the list starting to look a little thin, it felt like a good opportunity to take another look.
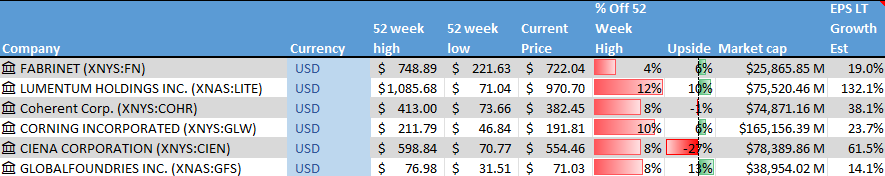
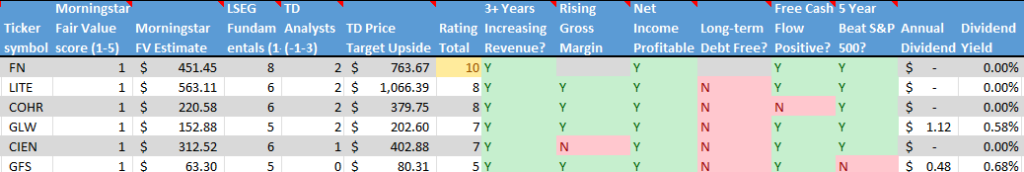
Making their return are Corning (NYSE: GLW) and Lumentum Holdings (NASDAQ: LITE). While researching both companies, I discovered they are part of the ‘optical ecosystem’ helping power today’s AI infrastructure build out. Digging a little deeper opened the door to several other companies benefiting from the current optical bottleneck tied to AI scaling, including Coherent Corp. (NYSE: COHR), GlobalFoundries (NASDAQ: GFS), Ciena (NYSE: CIEN), and Fabrinet (NYSE: FN).
I like to think of this group as the specialized team building the “digital highways” of the future. While companies like Nvidia make the high-powered cars (AI chips), these companies build the fibre-optic roads, interchanges, and networking systems that allow enormous amounts of data to move between those chips at incredible speeds. To keep up with growing AI demand, data centres are increasingly replacing traditional copper cables with glass fibres thinner than a human hair. Instead of electricity, these fibres use pulses of light to transmit information, allowing data to travel farther, faster, and with far less heat and energy loss. In fact, a single fibre can carry thousands of times more data than older copper wiring, which is why these infrastructure companies have quietly become one of the most important foundations of the entire AI boom.
Over the next few weeks, I’ll be running these companies through my Quick Test scripts to see which of these AI highway builders may offer the best opportunity to further grow my wealth through investing. 😊
As always, these are not buy recommendations. Make sure to do your own research and choose investments that fit your personal financial goals.
The Radar Check was last updated May 15, 2026.
That’s a wrap for this week, thanks for reading – may your portfolio stay green and your dividends steady. See you next time!