
The AI Boom: Is Every Company Riding the Wave a Winner?
The artificial intelligence (AI) revolution may be one of the biggest investment opportunities of our generation, but does that mean every company riding the wave will be a winner? It’s a question worth asking as investors pour money into AI and the infrastructure supporting it. Now, with Anthropic (NASDAQ: ANT) entering the public markets, investors can also buy shares in one of the companies developing the technology itself.
AI is advancing rapidly, demand for computing power continues to grow, and the world’s largest technology companies are committing extraordinary sums to stay ahead. Four of the biggest US technology companies spent a combined US$208.7 billion on capital expenditures in the third quarter alone, up 84% from a year earlier. Much of that spending is going towards data centres, specialized computer chips and other infrastructure needed to develop and run AI systems.
There’s little doubt AI has enormous potential. It could transform how businesses operate, improve productivity, reduce costs and create entirely new products and services. The opportunities for companies supplying the chips, equipment, software and infrastructure could be substantial. But here’s where things get interesting for investors: a great industry, a great business and a great investment aren’t necessarily the same thing.
A great industry has strong growth potential, expanding demand and opportunities to create significant value. AI certainly fits that description. However, a growing industry doesn’t guarantee every company will succeed. Competition can intensify, technology can change quickly, and companies may spend billions trying to gain an advantage without earning an attractive return. Some will emerge as clear winners, others will struggle, and some may disappear altogether.
A great business is different. It has a competitive advantage, a sound business model, capable management and the ability to generate growing profits and cash flow. Some AI-related companies already have these qualities, while others are still trying to turn their investments into sustainable profits. Even companies with promising products and strong market positions must show that their spending will eventually pay off.
But even a great business doesn’t automatically make a great investment. What you pay matters. Anthropic’s stock market debut offers an interesting example. Best known for its Claude models, the company priced its IPO at US$83 per share, above its original US$70–US$78 target range following strong demand. Shares opened at US$111.50, more than 34% above the IPO price, before retreating to close at US$97.17, still roughly 17% higher than the IPO price.
That strong debut reflects investor enthusiasm for Anthropic and AI’s potential but also shows how quickly expectations can push share prices higher. Anthropic faces enormous computing costs, intense competition and the challenge of turning rapid revenue growth into sustainable profits. Even a company with tremendous potential can disappoint investors if too much optimism is already reflected in its share price.
This doesn’t mean investors should avoid AI or dismiss the companies benefiting from its growth. The opportunity could be enormous, and some businesses may deliver exceptional results for years to come. However, it’s important to look beyond the excitement, understand the underlying business and how it makes money, and consider whether its share price offers reasonable potential returns.
For me, it’s important not to confuse a promising future with an attractive investment today. The next big technological revolution may create extraordinary businesses, but identifying them is only half the challenge. Finding them at a price that makes sense is what separates a great company from a great investment.
While AI continues to dominate investor attention, this week’s market movements were also driven by inflation and interest rate expectations. Let’s take a look at their impact on the markets and how my three portfolios fared. Hint: It’s not good.
Items that may only interest or educate me ….
Canadian Economic news, US Economic news, ….
Canadian Economic news
This past week’s key economic data that the Bank of Canada (BoC) considers when deciding whether to raise or lower the interest rate.
Consumer Price Index (CPI)
Statistics Canada reported that Canada’s annual inflation rate held steady at 3.1% in October, unchanged from September and slightly below analysts’ expectations of 3.2%. On a monthly basis, the CPI rose 0.2%, slowing from September’s 0.4% increase and coming in below expectations.
Over the past year, gasoline prices surged 30.9%, while household operations, furnishings and equipment recorded the smallest increase, at just 0.1%. Clothing and footwear saw the largest monthly price increase, climbing 2.3%, while gasoline prices fell 2.5%, marking their biggest monthly decline. Shelter costs rose 1.3% year over year, down from 1.8% in September.
Core CPI, which excludes the more volatile food and energy categories, increased 0.4% during the month and 1.8% year over year.
While headline inflation is still above the BoC’s 2% target, core CPI has fallen below it. Energy prices, particularly gasoline, continue to put upward pressure on the headline number, reflecting the sharp increase in gasoline prices over the past year. This helps explain why headline inflation remains at 3.1% even as core inflation has eased to 1.8%. However, the renewed increase in grocery prices is a reminder that not all inflationary pressures have eased. Overall, the report offers some encouraging signs for the Bank, but there is still work to do to keep inflation under control.
Retail Sales
Statistics Canada reported that retail sales rose 0.8% in September, following a 1.2% increase in August. The annual picture was even stronger, with sales up 7.5% from a year earlier, accelerating from August’s 5.4% increase. The monthly gain also came in slightly ahead of analysts’ expectations of 0.7%.
Gasoline stations and fuel vendors led the monthly gains, with sales climbing 6.9%, while furniture, home furnishings, electronics and appliance retailers recorded the largest decline, down 1.3%. Over the past year, gasoline stations also posted the strongest growth, with sales up 30.3%, largely reflecting higher prices. Furniture, home furnishings, electronics and appliance retailers were the only subsector to record an annual decline, down 1.2%.
However, the headline increase doesn’t tell the whole story. Core retail sales, which exclude motor vehicle and parts dealers as well as gasoline stations and fuel vendors, edged up just 0.1% in September after rising 1.1% in August. Annual core sales growth also remained more modest, at 4.5%. Much of September’s increase came from higher spending at the pumps, rather than a meaningful pickup in purchases of other goods.
Perhaps the most concerning part of the report is the advance estimate for October. Statistics Canada expects retail sales to have fallen 1.5%, a significant reversal after two consecutive monthly increases. While this preliminary estimate could change when the full data become available, it suggests consumer spending may be losing momentum heading into the final quarter of the year.
Canadian Market Volatility
Canada’s version of the market’s “fear gauge,” the S&P/TSX 60 VIX Index (VIXC), measures expected volatility in Canadian stocks over the next 30 days. Higher readings point to greater uncertainty and the potential for larger market swings, while lower readings suggest calmer conditions.
The VIXC opened the week at 16.17, close to the previous Friday’s finish of 16.61, before climbing towards 20 and spiking above that level later in the week as selling intensified across the Canadian market. On Friday, the fear gauge jumped nearly 20%, climbing above 25 following the release of September retail sales data and Statistics Canada’s preliminary estimate that sales would fall 1.5% in October suggesting a slowdown in consumer spending, a key element of the economy. Concerns about AI valuations and technology spending, combined with interest rate uncertainty and weakness in mining and energy stocks to further weigh on the TSX. The VIXC ended the week at 22.21, reflecting heightened expectations of larger market swings.
Note: The VIXC typically trades at lower levels than the VIX, partly because of differences in the makeup of the Canadian and US markets. The S&P 500 has a much larger weighting in technology, while the TSX has greater exposure to financials, energy and materials. These sectors respond differently to economic conditions and commodity prices, which can result in different levels of expected volatility.
US Economic news
This past week’s key data points that the Federal Reserve (Fed) considers when deciding whether to raise or lower the interest rate.
Federal Open Market Committee (FOMC) Minutes
The Fed released the minutes of its October 27–28 FOMC meeting this week, revealing a more hawkish outlook than the decision to hold interest rates steady might suggest. Although officials kept the benchmark rate at 3.75%–4.00%, almost all believed another increase would likely be needed to bring inflation back to the Fed’s 2% target. Some even raised the possibility of a larger hike if inflation data disappoints. While no decision had been made, another increase in December was still on the table.
Inflation continues to be the Fed’s biggest concern. Officials pointed to persistent price pressures, higher energy costs and tariffs, while noting that economic activity remains relatively strong, supported by consumer spending and business investment.
The minutes also highlighted concerns about the AI boom. While recognizing its potential to improve productivity, officials discussed the risks of massive infrastructure spending, complex financing arrangements and investments that may not deliver expected returns. The spending could also add to inflationary pressure.
For consumers and investors alike, the message was that interest rate cuts may be further away than hoped, while another increase was still possible. With inflation still stubborn and the economy holding up, the Fed is unlikely to rush into lowering the rate any time soon.
Retail Sales
The US Census Bureau’s October Retail Sales report showed that American consumers continued to spend despite higher prices and pressure on household budgets. Retail sales rose 6.8% year over year in October, accelerating from 6.3% in September. On a monthly basis, sales increased 0.2%, in line with expectations but considerably slower than September’s 0.8% gain.
Gasoline station sales recorded the largest annual increase, climbing 30.3%, largely reflecting higher fuel prices, while food and beverage stores had the smallest gain, at just 0.9%. Looking at monthly results, miscellaneous store retailers led the gains, with sales jumping 4.7%, while furniture and home furnishings retailers recorded the largest decline, falling 2.3%.
Core retail sales, which exclude motor vehicles and parts and gasoline stations, provide a clearer picture of underlying consumer spending. They increased 5.9% over the past year, up from 5.0% in September. On a monthly basis, sales rose 0.5%, more than double September’s 0.2% increase.
Consumer spending accounts for roughly two-thirds of US economic activity, making retail sales an important indicator of economic health. Although the headline number showed a considerable slowdown, the stronger core sales figures suggest consumers are still spending, particularly outside the automotive and gasoline sectors. However, keep in mind that retail sales measure how much consumers spend, not how much they actually buy. Since the figures aren’t adjusted for inflation, higher prices can boost sales even when consumers aren’t buying more goods. With consumer prices rising in October, some of the increase reflects higher costs rather than increased buying activity.
Consumer Sentiment Index (CCI)
The University of Michigan’s final November Consumer Sentiment Index (CSI) improved to 51.5 from 48.0 in October, a 1.0% increase from a year earlier. Despite the gain, consumer confidence remains historically weak.
The Current Economic Conditions Index, which reflects consumers’ views of their finances and buying conditions, rose to 49.4 from 46.7 but is still 3.3% below November 2025. The Expectations Index, measuring the outlook for the economy over the next six months, climbed to 52.9 from 48.8, putting it 3.7% above a year ago.
Inflation expectations also improved. Consumers’ one-year outlook fell to 3.7% from 4.7% in October, meaning they expect prices to rise by an average of 3.7% over the next 12 months. Five-year expectations declined to 3.3% from 3.5%. Although both measures are still above their levels before the Iran conflict began and the Fed’s 2% inflation target, the declines suggest consumers are becoming less concerned about future price increases.
Stronger expectations for business conditions following the midterm elections helped lift sentiment, while lower gasoline prices eased pressure on household finances. However, consumers with larger stock portfolios reported a weaker financial outlook amid market volatility and AI-related concerns. Overall, sentiment remains 9% below its February level, before the Iran conflict began. Americans are feeling somewhat better about the economy, but persistent cost-of-living concerns continue to weigh on confidence.
American Market Volatility
The VIX, often called the market’s “fear gauge,” measures expected volatility in the S&P 500 over the next 30 days. Higher readings signal greater uncertainty, while levels above 20 are typically associated with heightened market volatility.
The VIX opened the week at 20.0, slightly above the previous Friday’s close of 19.43, before climbing steadily as concerns about AI valuations and Nvidia’s (NASDAQ: NVDA) leadership turmoil continued to rattle investors. Growing doubts about the enormous sums being invested in AI triggered further selling in technology stocks, while renewed inflation concerns and expectations of another interest rate hike helped spread the sell-off across the broader market. The VIX surged to an intraday high of 40.03, a 52-week high, before closing the week at 35.89, its highest close since April 7, 2025.
The sharp increase left the VIX well above the previous Friday’s close, reflecting a significant shift in investor sentiment. Concerns that had initially centred on AI spending and technology valuations had broadened to include inflation, interest rates and uncertainty surrounding Nvidia. By the end of the week, investors were clearly more concerned about the potential for further market swings.
Weekly Market and Portfolio Review
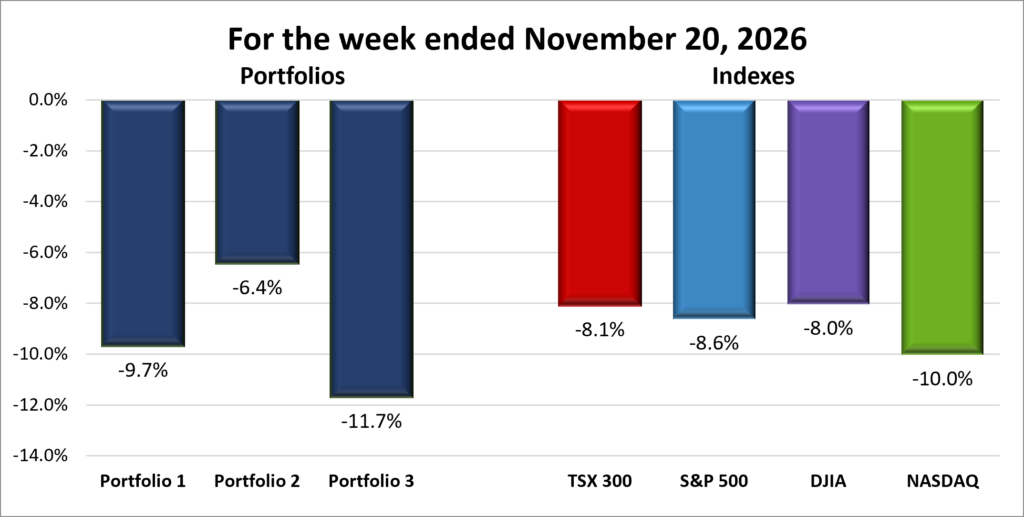
For the week, the TSX (SPTSX) fell 8.1%, the S&P 500 (SPX) shed 8.6%, the DJIA (INDU) dropped 8.0% and the Nasdaq (CCMP) plummeted 10.0%.
| Index | Weekly Streak |
| TSX: | 1 – week losing streak |
| S&P: | 1 – week losing streak |
| DJIA: | 1 – week losing streak |
| Nasdaq: | 1 – week losing streak |
 The indexes stumbled badly out of the gate in a pivotal week for AI stocks. Anthropic’s IPO and Nvidia’s first earnings report following Jensen Huang’s departure put investor confidence in the AI industry to the test. And then it got worse!
Renewed inflation and interest rate concerns added to the pressure. The Toronto Stock Exchange Composite Index (TSX) fell for seven consecutive sessions, its longest losing streak since October 2023, and closed at its lowest level since April 6. Its weekly decline was the steepest since March 2020, at the start of the COVID-19 pandemic.
The S&P 500 Index (S&P) fell below its 200-day moving average and recorded seven consecutive daily declines for the first time since the pandemic began, suffering its worst weekly performance since April 2025. The Dow Jones Industrial Average (DJIA) extended its losing streak to five sessions, falling below 50,000 for the first time since June 10 and ending a five-month run above that milestone. The Nasdaq Composite Index (Nasdaq) finished lower in five of the week’s final six sessions. US markets suffered their worst week of 2026.
By Friday’s close, all four indexes had entered correction territory, meaning they had declined at least 10% from their recent closing highs. Worse still, the Nasdaq was approaching bear-market territory, conventionally defined as a 20% decline.
The biggest drag on US markets was fading confidence in the AI trade. Investors questioned whether the enormous sums being poured into AI infrastructure would generate returns quickly enough to justify expectations. Investors hoped a strong earnings report from Nvidia would jumpstart the AI rally. Nvidia’s earnings exceeded expectations, and its strong fourth-quarter outlook initially lifted the stock in after-hours trading. That optimism quickly faded as attention shifted to leadership uncertainty. Huang’s departure raised questions about who could fill his shoes and maintain Nvidia’s influence across the AI industry.
Anthropic went public at US$83 per share, opening 34% higher at US$111.50 and reaching US$113.31 before closing its first day at US$97.17. It slipped to US$88.91 by week’s end. Despite the strong debut, the IPO did little to revive enthusiasm for the broader AI sector. Selling spread beyond technology late in the week, with more than 90% of S&P stocks declining.
Interest rate concerns added to the pressure. Minutes from the Fed’s October meeting revealed that some officials were open to more aggressive increases if inflation remained stubborn, including a possible half-percentage-point hike. Subsequent inflation figures and Fed comments reinforced fears that rates could stay higher for longer, with investors fully anticipating another December hike.
In Canada, falling commodity prices did much of the damage. The TSX slid to a seven-month low as concerns about the global economic outlook raised questions about future demand. Canada’s heavy exposure to gold, mining and energy companies left the index vulnerable as gold and oil prices weakened.
Gold fell to a 14-month low amid expectations of higher interest rates and the broader market sell-off. Oil prices also declined early in the week on concerns about an emerging supply surplus, before reversing course following attacks on tankers in the Strait of Hormuz and renewed hostilities in the US-Iran conflict. The rebound offered some relief to energy stocks, but not enough to offset the broader weakness.
There was some better news at home. Canada’s October inflation rate held steady and came in below expectations, easing pressure on the BoC to raise interest rates. Investors consequently scaled back the likelihood of a December hike.
By week’s end, the selling had spread well beyond AI stocks, raising questions about whether the boom that has fuelled much of the market’s gains in recent years is losing momentum. Although the pressures differed, investors on both sides of the border had little to celebrate.
| Portfolio | Weekly Streak |
| Portfolio 1: | 1 – week losing streak |
| Portfolio 2: | 1 – week losing streak |
| Portfolio 3: | 6 – week losing streak |
It was a dreadful week for the markets, and even worse for my portfolios. All three finished deep in the red, with widespread losses and very few bright spots.
The bad news kept coming for Nvidia. Reuters reported that the US Securities and Exchange Commission is investigating potential accounting issues at the chipmaker. Nvidia plunged 14% on Friday, bringing its weekly loss to 21%. Once the world’s most valuable publicly traded company, it has now fallen to fourth place among US companies by market capitalization. Since its October 6 peak, Nvidia has shed roughly US$2.7 trillion in market value, including more than US$1.1 trillion during its latest seven-day losing streak. Ouch!
There was some positive news, however. Following Quebecor’s (TSE: QBR.B) proposal to acquire Telus (TSE: T), and reports that BCE (TSE: BCE) had also approached Telus about its strategic options, the stock surged 13.7% on Friday to finish the week up more than 15%. That was a welcome boost for the portfolios holding Telus.
Portfolio 1 plunged 9.7%, with only 10% of its holdings finishing higher. TELUS was the standout, gaining 13%. Unfortunately, losses were widespread. Nvidia, the portfolio’s largest holding, fell 21%, while Navitas Semiconductor (NASDAQ: NVTS) dropped 27%. Cameco (TSE: CCO), SEA Ltd. (NYSE: SEA), and Kraken Robotics (TSE: PNG) each lost 15%, while Grab Holdings (NASDAQ: GRAB) and Shopify (TSE: SHOP) fell 14%. iShares S&P/TSX Global Gold Index ETF (TSE: XGD), Hammond Power Solutions (TSE: HPS.A), and Magnite (NASDAQ: MGNI) each declined 13%. Datadog (NASDAQ: DDOG) lost 11%, and Interactive Brokers (NASDAQ: IBKR) fell 10%. With so many holdings suffering double-digit losses, there was little chance of escaping the damage.
Portfolio 2 had the dubious distinction of being the best of a very bad lot, losing 6.4%. It also had the highest proportion of weekly winners, although just 13% is hardly cause for celebration. TELUS was again a bright spot. Among the biggest losers, Mitek (NASDAQ: MITK) fell 14%, Hammond Power Solutions dropped 13%, and MongoDB (NASDAQ: MDB) declined 11%. Even Take-Two Interactive (NASDAQ: TTWO) couldn’t escape the selling pressure, despite record-breaking sales accompanying the launch of its highly anticipated Grand Theft Auto VI.
Portfolio 3 had the worst week of the three portfolios and all the indexes, plunging 11.7%. Adding insult to injury, not a single holding finished higher. That’s a first for me! Rocket Lab (NASDAQ: RKLB) led the declines, falling 23%, followed by Shopify at 14% and Magnite at 13%. Vertiv Holdings (NYSE: VRT) and Corning (NYSE: GLW) both lost 12%, while Alvopetro Energy (TSXV: ALV) fell 11%.
A week with this much red makes me miss those volatile stretches when, at least, there was some upward momentum. 😊 Hopefully, next week brings a change in direction for both the markets and all three portfolios!
Companies on the Radar
 There was a little reshuffling on my Radar list this week, with Mattr Corp. (TSX: MATR) making way for a new addition, Qnity Electronics (NYSE: Q). The change came down to how I view the two small-cap Canadian companies currently on my list: Mattr and BioSyent (TSXV: RX). Since I’m only interested in tracking one small-cap company at a time because of the higher risk of small caps, I compared the two and decided BioSyent was the better fit.
BioSyent has several qualities I look for in a long-term investment. It’s a high-margin, founder-aligned business with multiple opportunities to grow earnings through organic growth, carefully selected acquisitions and regular share buybacks. It also requires very little physical capital to expand, leaving much of its cash flow available to reward shareholders through dividends and buybacks or reinvest in smaller acquisitions with attractive returns.
Mattr, on the other hand, operates in a much more capital-intensive business. As an industrial manufacturer, it faces exposure to economic cycles, raw material costs such as copper, and the timing of major projects. It also needs to reinvest a considerably larger portion of its cash flow into plants, equipment and working capital just to maintain and grow its operations. While that doesn’t make Mattr a bad company, BioSyent’s business model and potential to generate shareholder returns better match what I’m looking for.
Taking Mattr’s place is Qnity Electronics, an American technology company specializing in advanced materials and solutions used in semiconductor manufacturing and electronic devices. Its products help chipmakers manufacture smaller, faster and more powerful semiconductors, while its interconnect technologies support the packaging, power management and heat control needed in increasingly complex electronic systems. Rather than making chips itself, Qnity supplies the specialized materials that make modern chip production possible, generating revenue from products consumed during manufacturing or incorporated into finished electronic devices. With long-standing relationships with major semiconductor manufacturers and growing demand for AI, data centres and high-performance computing, Qnity offers a different way to participate in the semiconductor industry’s growth without betting on a particular chipmaker.
With these changes, my Radar list remains at five companies.
- BioSyent: A small Canadian healthcare company that acquires or licenses established pharmaceutical and healthcare products for marketing and distribution, avoiding the high costs and risks of developing new drugs. Its business model has delivered 65 consecutive profitable quarters through Q3 2026, with revenue growing 23% in 2025. Management has a meaningful ownership stake, and the company has repurchased shares and paid a quarterly dividend since late 2022. Its expansion into oral health provides another avenue for growth beyond its established pharmaceutical business.
- S&P Global (NYSE: SPGI): A large cap American company and one of the world’s most important financial information companies. Most investors know it for the S&P Index, but the business also provides credit ratings, market data, analytics, and research used by banks, corporations, governments, and investors worldwide. Think of it as one of the key information providers that helps global financial markets function, generating revenue through subscriptions, licensing fees, and rating services.
- Capital Power Corporation (TSX: CPX): A mid cap Canadian power producer that generates electricity from a mix of natural gas, wind, solar and battery storage across North America. With electricity demand rising rapidly from AI data centres, industrial growth and electrification, Capital Power is expanding its natural-gas generation while adding renewable and storage capacity. Its recent agreement to supply 250 MW of power to a new data centre in Alberta for more than 10 years highlights how the AI boom is creating opportunities beyond the technology companies building the data centres themselves.
- Domino’s Pizza (NASDAQ: DPZ): One of the world’s largest pizza chains, with more than 22,000 locations across over 90 markets. Most are independently owned franchises, generating recurring royalties and fees, while Domino’s also sells food and supplies to franchisees. Its strong brand, digital ordering and efficient delivery model support growth. With more than 13 consecutive years of dividend increases, a high double-digit dividend growth rate and a payout ratio below 50%, Domino’s could offer a relatively stable, cash-generating business to balance the higher-growth companies already in the portfolios.
As always, these are not buy recommendations. Make sure to do your own research and choose investments that fit your personal financial goals.
The Radar Check was last updated November 20, 2026.


That’s a wrap for this week, thanks for reading – may your portfolio stay green and your dividends steady. See you next time!