
Items that may only interest or educate me ….
Canadian Economic news, US Economic news, US Interest rate remains unchanged, Magnificent Seven update, ….
Following a turbulent October, North American stock markets regained their footing as November began, thanks to the US Federal Reserve (Fed)’s decision to leave the US benchmark interest rate unchanged. Although the Fed kept the possibility of future hikes open, widespread belief among analysts and investors suggests that the US interest rate might have reached its peak. If the Fed chooses to hold the rate steady at their year-end meeting in December, it will mark the third consecutive meeting without a change. Many experts view this as a potential indication of the end of the recent rate hikes. We shall see.
Canadian Economic news
This past week’s key economic data that the Bank of Canada (BoC) considers when deciding whether to raise or lower the interest rate.
Gross Domestic Product
Statistics Canada’s recent report revealed that in August Canada’s economy, as measured by Gross Domestic Product (GDP), remained stagnant, showing no growth for a second straight month. The goods-producing industries experienced a slight decline of 0.2%, with the ‘Mining, quarrying, and oil and gas extraction’ sector being the only subsector to show growth, albeit modest at 1.2%. Meanwhile, the services-producing industries saw a marginal increase of 0.1%, primarily driven by a 2.3% growth in wholesale trade. Among the twenty industries constituting the goods and services sectors, only eight grew in August.
Year-on-year, the GDP increased by 0.9%. Within the goods-producing industries, ‘Mining, quarrying, and oil and gas extraction’ stood out with a 0.9% growth. In the services-producing sector, ‘Arts, entertainment, and recreation’ led the way with a 1.9% increase.
The report from Statistics Canada identified persistent inflation, resulting in higher interest rates, along with challenges such as forest fires and drought conditions, as the primary factors hampering growth throughout August.
Following a 0.2% dip in June, the Canadian economy was flat in both July and August. Early indicators suggest a similar trend for September, if not worse, indicating a stalled economy during the third quarter (July to September). There are concerns it might even register a quarterly decline on a year-over-year basis, marking the second consecutive quarterly downturn. Worse, the Organization for Economic Co-operation and Development (OECD), expects Canada’s per capita GDP growth to be the worst among advanced countries over the next thirty year. Ouch!
For us investors, flat or negative GDP growth is a bearish signal. A struggling economy often translates to lower corporate earnings, leading to declining stock prices, and negatively impacting investments.
Typically, two consecutive quarters of economic decline are considered indicators of a recession, a period of economic contraction often leading to reduced business profitability, potential layoffs, and decreased consumer spending.
Jobs
Canada’s employment data for October, as measured by the Labour Force Survey (LFS), revealed a further slowdown in job creation, with only 18,000 new jobs added compared to the 64,000 added in September, falling short of the projected 22,500 jobs. Moreover, the monthly employment rate, representing the proportion of the working-age population employed, declined by 0.1% to 61.9%.
In tandem, the unemployment rate climbed to 5.7% in October, surpassing both analysts’ expectations of 5.6% and the 5.5% rate recorded in September. This marks the fourth increase in unemployment within the last six months.
This data underscores the continued cooling of the labour market, confirming a slowdown in the Canadian economy, as highlighted in the GDP update above. This downward trend strengthens the argument that the BoC no longer needs to further raise the benchmark interest rate.
Canadian market volatility
The Canadian Volatility Index (VIXC), as measured by the TSX 60 VIXI, ended the week at 14.14, down from last week’s reading of 18.4. Perceived market volatility in the Canadian stock market is now well below 20. A Canadian VIX reading above 20 is considered high, while a reading below 20 is considered to be low. A reading of 14.14 suggests Canadian investors are feeling very bullish about the Canadian stock market. They are less fearful and more confident about the future of the Canadian market.
US Economic news
This past week’s key data points that the Federal Reserve (Fed) considers when deciding whether to raise or lower the interest rate.
Job reports
There were three main job reports this week that capture the American job market: the Labor Department’s Job Openings and Labor Turnover Survey (JOLTS), followed by ADP’s private payrolls report, and finally, the Labor Department’s Employment Situation Summary (ESS).
Data from the Labor Department’s September JOLTS revealed a rise in job openings, reaching 9.553 million. Although slightly down from August’s 9.61 million, it surpassed estimates of 9.25 million, indicating a robust demand for labour. That works out to 1.5 jobs for every unemployed person in September. Job openings are a measure of demand for labour.
On a monthly basis, the number of job openings grew in the accommodation and food services industry, up 141,000. The biggest decline in job openings was in the ‘other services’ industry.
Next we have the ADP employment survey for October. The ADP payroll report is a closely watched indicator of the U.S. labour market, as it is generally considered to be a good predictor of the government’s employment report that follows two days later. This latest report showed that the private sector employment increased by 113,000 jobs in October, and annual pay was up 5.7 percent year-over-year. This was the slowest pace of job growth since October 2021, but it was still above economists’ expectations of 89,000 jobs added.
The ADP report is also good news for workers, as it suggests that wages are continuing to rise. The annual pay increase of 5.7 percent is the fastest pace of wage growth since 2006. This is a positive sign for the economy, as it suggests that consumers have more money to spend.
Finally, we have the Labor Department’s ESS for October. The report showed that nonfarm payroll employment increased by 150,000, slowing considerably from a gain of 336,000 jobs in September and well below analysts forecast of a gain of 180,000. The unemployment rate edged up to 3.9% from 3.8% in September. This was higher than an expected gain of 3.8%.
The job gains in October were concentrated in the health care, government, and social assistance sectors. Employment in manufacturing declined due to strike activity that left 33,000 less employees on the payrolls of the auto manufacturers. Other major industries showed little change in employment over the month.
The average hourly earnings for all employees on private nonfarm payrolls rose by 7 cents, or 0.2%, to $34.00 in October. Year over year, average hourly earnings have increased by 4.1%, down slightly from a 4.3% gain in September.
The report was a sign of a cooling demand for labour, as the higher interest rates continue to slow the economy. The good news is the Fed is likely to maintain the existing rate at their next meeting in December. The figures could bring the Federal Reserve’s historic interest-rate increases to an end by providing stronger evidence that higher borrowing costs have slowed the economy.
Overall, these three reports indicate that the labour market remains strong but is slowing. The high number of job openings and rising wages indicate that there is still strong demand for workers. The robust labour market continues to drive a strong economy. However, the slowing pace of job growth suggests that the labour market is no longer as tight as it was earlier in the year.
This is good news for workers, as it means that they are likely to have more bargaining power when it comes to wages and benefits, as the recent auto workers strike can attest. However, it is also a sign that the economy is cooling down.
For investors, the cooling labour market suggests that the economy is slowing down, and that inflation is likely to come down on its own. Hopefully, upcoming economic data will support the downward trend of inflation and the Fed will be more likely to leave interest rates unchanged at their next meeting in early December.
American market volatility
During the week, the CBOE Volatility Index (VIX) fell to 14.91, well down from 21.27 last week. This suggests that investors are currently feeling very bullish about the stock markets and are relatively unconcerned about the risk of volatility.
Consumer Confidence Index
The Conference Board reported its Consumer Confidence Index (CCI) for October dropped to 102.6, down from an updated 104.3 in September. Analysts had expected a bigger drop to 100.0.
The Consumer Confidence Index (CCI) is a measure of how optimistic consumers are about the current state of the economy and their future financial prospects. When consumers are confident, they are more likely to spend money and invest in the future, boosting economic growth and leading to higher corporate earnings. Conversely, when consumers are pessimistic, they are more likely to save money and cut back on spending which can dampen economic growth and lead to lower corporate earnings.
While a reading of 100 is considered high, October was the third consecutive month consumer’s confidence has slipped. This suggest consumers remain fairly optimistic but are becoming less optimistic about the future, which could have implications for economic growth in the coming months.
US Interest rate remains unchanged
As widely expected, the Fed’s Federal Open Market Committee (FOMC) announced that it was holding the benchmark interest rate at 5.25 – 5.5%. This was the second consecutive meeting that the Fed has held rates steady, after raising them eleven times since March 2022 to combat high inflation. In the post meeting press conference, Fed Chair Jerome Powell said the decision to hold the rate steady does not mean that they will not raise rates further. He said they will continue to monitor economic data and adjust its policies as needed.
The decision comes at a time when the US economy is showing signs of slowing, but inflation remains elevated. In its statement, the Fed noted that “recent indicators of economic activity have weakened.” However, the Committee also said that “the labor market remains robust” and that “inflation remains elevated, reflecting supply and demand imbalances related to the pandemic, the wars in Ukraine and the Middle East, and other factors.”
The statement also said they do not see a recession on the horizon. Recent strong economic data, combined with the current economic activity is “not indicative of a recession in the near term.” As a result, the Fed upgraded the economy from growing at a “solid pace” to a “strong pace.” They acknowledged the growing economic activity, that job openings continue to grow but the pace of openings is slowing, and unemployment remains low. However, inflation remains higher than they would like.
Powell said that the Fed is “committed to bringing inflation back down to our 2 percent objective” and that “monetary policy will remain restrictive for some time.” In other words, higher for longer. However, he also said that the Fed will be “data-dependent” in making its decisions and that it will “take the necessary steps to ensure that the economy remains on a path of sustainable growth.”
Overall, the Fed’s decision to hold rates steady and Powell’s comments suggest that the Fed is taking a cautious approach to monetary policy (setting interest rates). The Fed is clearly concerned about the risk of sending the economy into a recession, but it is also committed to bringing inflation under control.
Magnificent Seven update
The ‘Magnificent Seven,’ consisting of Nvidia (NASD: NVDA), Tesla (NASD: TSLA), Meta Platforms (NASD: META), Apple (NASD: AAPL), Amazon.com (NASD: AMZN), Microsoft (NASD: MSFT), and Alphabet (NASD: GOOGL), got off to a torrid start in the first half of 2023. The share prices of these seven large technology companies soared, driving most of the market gains, thanks in large part to the roll out of artificial intelligence (AI).
But the tide turned in August, when higher interest rates, concerns about inflation, and a general sell-off in technology stocks weighed on the markets. As of the end of October, these seven giants are now pulling the markets down, with each company in the red since August. Microsoft has held its ground the best, with only a 2.2% decline.
It is important to remember that while the price of their stocks have cooled off, the companies themselves have not changed their operations. The volatility lies in the prices of their shares, not the companies’ fundamentals.
The main reason for the cooling of theses stocks is the ‘higher for longer’ interest rates which has led to an increase in the yields for US government bonds. Higher rates mean more money must be used to service debt rather than grow the company, impacting the bottom line, or net income. As well, investors took some profits from the run up in Magnificent Seven companies that were undervalued at the start of the year and had become significantly overvalued by the end of July. The lure of relatively risk free, high yield government bonds was too hard for investors to ignore so they rotated into the low risk, low volatility US government bonds.
Despite the cooldown of the Magnificent Seven, each of them remains in the green for the year. Gains range from leader Nvidia, up 176% to Apple, the laggard of the group, up ‘only’ 29% for the year.
The recent mixed bag of third quarter earnings from this group has presented buying opportunities for the companies that were punished for missing estimates or did not impress investors with their performance. The Magnificent Seven are still very large and powerful companies with dominant market positions. They continue to invest heavily in new technologies, such as AI, which should leave them well-positioned for long-term growth.
After a disappointing October, the markets rebounded sharply to start off November on the right foot. Let’s see what happened this past week that sparked the upward rebound ….
Weekly Market Review
Monday: after a dismal previous two weeks the markets rallied, leaving the four major North American indexes solidly in positive territory. This week will be busy with the Fed’s meeting, the latest labour data, and more earnings reports, headlined by Apple, the biggest company in the S&P 500 Index (S&P). Oil continues to drop as concerns eased that the Middle East war will spread to other oil producing regions in the area, disrupting the supply lines.
In Canada, the Toronto Stock Exchange Composite Index’s (TSX) eight day losing streak ended by improved investor sentiment for the Canadian economy. Finally! In trading, it was day of broad-based gains across the Canadian sectors, led by Consumer Staples and Technology. The Basic Materials (miners and fertilizer manufacturers) was the only sector that failed to advance.
In the US, the S&P, the Dow Jones Industrial Average (DJIA), and the Nasdaq Composite Index (Nasdaq) were each up over 1% as investors prepare for the Fed’s latest update on the benchmark interest rate. In trading, each of the American sectors ended higher, led by the Telecommunications Services and Consumer Staples sectors. Bringing up the rear was the Energy sector.
Tuesday: after an uncertain start in morning trading, the markets established an upward trend with all indexes ending the day in the green. The Fed started their two-day monetary policy meeting today where they will discuss the US interest rate. Investors expect the Fed will keep the US benchmark rate at 5.5% when they conclude their meeting tomorrow.
In Canada, the latest GDP report indicated the Canadian economy has stalled and may have slipped into a recession during the third quarter. The TSX started a winning streak, posting a small gain led by the Healthcare and Technology sectors. Basic Materials, Utilities and Consumer Cyclicals were the only Canadian sectors to end the day lower.
In the US, investors optimism that the interest rate will remain steady was offset by more mixed earnings reports. However, many went bargain hunting after the beat down stocks have taken the last few days. It was a good day in the American sectors where Telecommunications Services and Utilities were the best performers while Energy was the only sector to lose ground.
Wednesday: the markets moved higher in anticipation of the Fed maintaining its pause on rate hikes. After the announcement that US interest rates would remain at 5.5%, the indexes went on to set session highs.
In Canada, the TSX ran its winning streak to three thanks to strong earnings reports and investor optimism that rate hikes are finished on both sides of the border. It was a day of broad-based gains in the Canadian sectors, with Utilities and Telecommunications Services the best performers. Basic Materials was the only sector to end lower.
In the US, as well as leaving the benchmark rate unchanged, the Fed suggested rate hikes may be done, although they did leave the door open for additional hikes if necessary. It was another good day in the American sectors, led by Technology and Utilities. Consumer Cyclicals was the only sector not to end higher, it ended flat.
Thursday: all four indexes started strong and continued to climb higher for the rest of the day. The news driving the soaring markets was the Fed’s continued pause on the US interest rate and investor optimism that the Fed will maintain the current rate through the rest of the year. Oil prices jumped by more than $2 a barrel after the Fed left the interest rate unchanged. Investors had feared higher rates would likely lower demand for oil products.
In Canada, the TSX jumped 2.9%, in its biggest advance in a year, and reached its highest point since mid October. The big driver were strong earnings from Shopify (TSE: SHOP) and Lightspeed (TSE: LSPD). The Technology sector led all Canadian sectors, with a gain of over 9% for the day, which saw all sectors end in positive territory. Trailing the pack were Basic Materials and Industrials, each up over 1%.
In the USA, all three indexes were bullish as investors digested a number of positive earnings reports and the possibility the rate hikes have come to an end. All sectors were up sharply, led by Energy and Financials. Consumer Staples and healthcare were the laggards.
Friday: the markets shook off a disappointing quarterly report from Apple and maintained the upward momentum of the last few days. Labour data in both countries indicates the respective job markets are cooling, leading investors in both countries to think the central banks may be finished raising interest rates. Oil prices fell on a slight easing of tensions in the Middle East.
In Canada, the TSX closed at a six-week high as investors leaned into the narrative that the BoC was done hiking the interest rate. In trading, it was another good day in the Canadian sectors. Consumer Cyclicals and Basic Materials were the big winners, while Energy was the only sector to decline.
In America, all three indexes ended higher after the market shook off early jitters caused by Apple when the company said it expects revenues to “decelerate significantly” in the fourth quarter. The thought that the Fed will leave the rate unchanged for the next few months sent investors back into the stock markets. In trading, it was another day of broad-based gains in the American sectors, led by Financials and Basic Materials. Energy was the only sector to post a loss.
Weekly Market and Portfolio Review
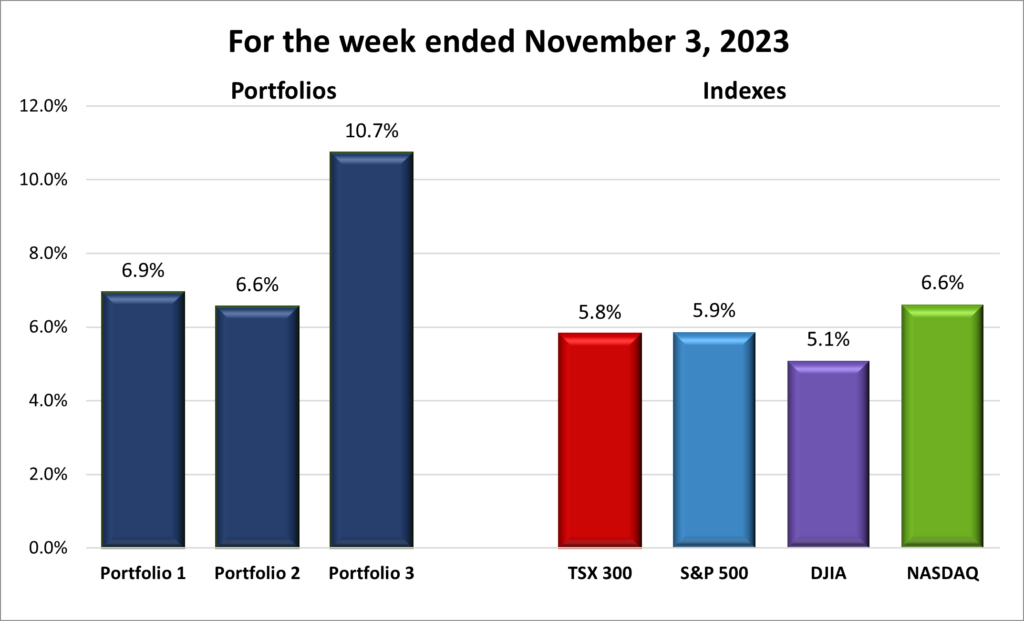
For the week, the TSX (SPTSX) advanced 5.8%, the S&P 500 (SPX) gained 5.9%, the DJIA (INDU) grew 5.1% and the Nasdaq (CCMP) surged 6.6%.
![]() The chart above is the type of chart I like to see, strongly upward. 😊 The four major North American indexes had a strong week. The DJIA posted its strongest weekly gain since the end of October 2022, while the S&P and Nasdaq had their strongest weekly rises since November 2022. The TSX closed the week at its highest point in six weeks.
The chart above is the type of chart I like to see, strongly upward. 😊 The four major North American indexes had a strong week. The DJIA posted its strongest weekly gain since the end of October 2022, while the S&P and Nasdaq had their strongest weekly rises since November 2022. The TSX closed the week at its highest point in six weeks.
The rally was driven by several factors, including softer-than-expected economic data in both countries. Friday’s lower than expected employment reports in both countries raised hopes that inflation may be starting to come down. However, the biggest catalyst was the Fed’s mid week decision to leave the US interest rate unchanged, leading investors to believe the Fed may be done raising the benchmark rate. In Canada, the softer labour market and stagnant economy caused a similar sentiment that the BoC was done with rate hikes.
The US volatility index, or VIX, the market’s “fear gauge,” experienced a significant decline this week, falling 42.6%. A similar decline occurred with the Canadian volatility index. This is a sign that investors are becoming less fearful of a recession and are more optimistic about the future of the stock market.
Overall, the four indexes had a very strong week, driven by a number of positive factors. I can only hope that the positive momentum continues in the coming weeks and months. 😊
![]() The portfolios had a very good week, riding the wave of a market surge, particularly in the Nasdaq. Portfolio 1 not only benefited from the rise in the mega-cap companies in the portfolio but also saw over 90% of its holdings posting gains. Portfolio 2 had a solid performance, led by Microsoft, with every company in the portfolio ending the week on a high note. Portfolio 3 saw gains in all but one of its holdings, Lithium Americas (Argentina) (TSE: LAAC). However, it was Shopify’s impressive 28% increase that pushed the portfolio’s weekly gains above the 10% mark.
The portfolios had a very good week, riding the wave of a market surge, particularly in the Nasdaq. Portfolio 1 not only benefited from the rise in the mega-cap companies in the portfolio but also saw over 90% of its holdings posting gains. Portfolio 2 had a solid performance, led by Microsoft, with every company in the portfolio ending the week on a high note. Portfolio 3 saw gains in all but one of its holdings, Lithium Americas (Argentina) (TSE: LAAC). However, it was Shopify’s impressive 28% increase that pushed the portfolio’s weekly gains above the 10% mark.
After a three-month downtrend, this positive week was a welcome change.

Monthly Market and Portfolio Review
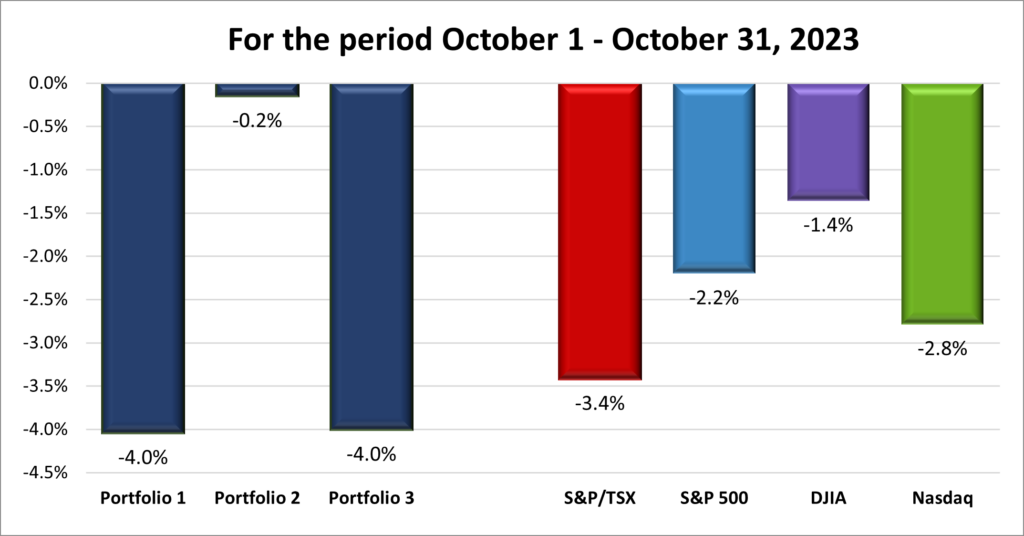
For the month of October, the TSX (SPTSX) fell 3.4%, the S&P 500 (SPX) lost 2.2%, the DJIA (INDU) slipped 1.4% and the Nasdaq (CCMP) dropped 2.8%.
![]() In October, North American markets, including the TSX, S&P, DJIA, and Nasdaq, experienced significant volatility, making it one of the worst Octobers in five years. This turbulence was fueled by fears of an economic slowdown, ongoing inflationary pressures, and rising yields on low-risk government bonds. Despite this, corporate earnings remained strong, and the American economy continued to show resilience.
In October, North American markets, including the TSX, S&P, DJIA, and Nasdaq, experienced significant volatility, making it one of the worst Octobers in five years. This turbulence was fueled by fears of an economic slowdown, ongoing inflationary pressures, and rising yields on low-risk government bonds. Despite this, corporate earnings remained strong, and the American economy continued to show resilience.
All three major American indexes, DJIA, S&P, and Nasdaq, faced their third consecutive monthly losses. For the DJIA and S&P, it was their longest respective monthly losing streak since the early days of the pandemic in 2020. The DJIA even slipped into negative territory for the year during the current losing streak. The Nasdaq had a similar three-month losing streak back in the summer of 2022.
Investors’ fears were somewhat calmed as softer economic data in both the US and Canada raised hopes of falling inflationary pressures. The positive sentiment was further boosted by the Fed’s decision to keep the US interest rate unchanged, signaling a possible end to rate hikes. In Canada, a cooling labour market and a stagnant economy contributed to the belief that the BoC might halt further rate increases.
Despite the challenges, there were positive indicators. Both the US and Canadian volatility indices experienced significant declines, indicating investors were becoming less fearful of a recession and were more optimistic about the stock market’s future. Amidst the turbulence, strong corporate earnings and the resilient American economy provided a glimmer of hope for investors, suggesting that despite the recent difficulties, the markets could potentially regain their footing in the coming months.
![]() As you can see in the chart below, it was a disappointing month for the three Portfolios, reflecting a prevailing pessimism in the markets. All three portfolios fell on overall negative market sentiment, surging yields on government bonds that led to investors moving out of stocks and into low/no risk government bonds.
As you can see in the chart below, it was a disappointing month for the three Portfolios, reflecting a prevailing pessimism in the markets. All three portfolios fell on overall negative market sentiment, surging yields on government bonds that led to investors moving out of stocks and into low/no risk government bonds.
Portfolio 1 got off to a good start with a gain the first week, but it was downhill from there. It was dragged lower by the overall market decline and the technology companies in the portfolio, particularly the bigger technology companies. Portfolio 2 also got off to a decent start, posting weekly gains in the first two weeks before ending with two weekly losses. The portfolio was able to minimize losses by being more conservative and more diversified (the main reason to be diversified). Finally, Portfolio 3 ended lower every week, dragged down by the technology companies in the portfolio, particularly Shopify.
After three months of falling portfolios, hopefully November breaks the streak of monthly losses. It definitely got off to a much better start than October but there is a long way to go, and a lot can happen in volatile markets.
Companies on the Radar
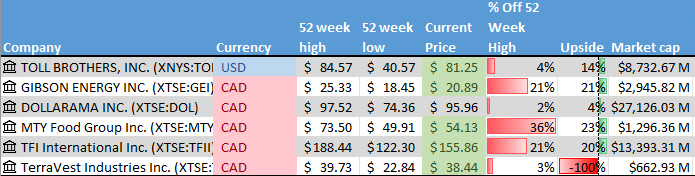
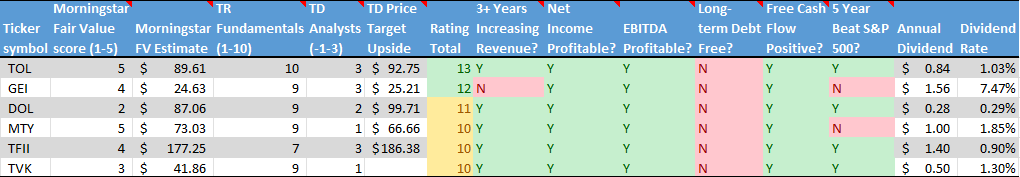
 After two weeks without an American company on my Radar List, I found one this week – Toll Brothers Inc. (NYSE: TOL). They are a mid cap American company (a market capitalization between $2 billion and $10 billion) that builds luxury homes across the US. It scored very high on my Radar Checklist, as you can see on the two tables below.
Toll Brothers joins the other five Canadian companies currently on the list:
- Gibson Energy (TSE: GEI), a small-cap Canadian company specializing in providing liquid infrastructure products and services to the North American energy sector.
- TFI International Inc. (TSE: TFII), a mid-sized Canadian transportation and logistics company operating across North America.
- Dollarama (TSE: DOL), a large Canadian company that operates dollar stores across Canada.
- MTY Food Group Inc. (TSE: MTY), a small cap Canadian consumer cyclical company that operates and franchises quick service and casual dining restaurants throughout North America and internationally.
- TerraVest Industries (TSE: TVK), a small-cap Canadian company that manufactures and sells goods and services to energy, agriculture, mining, and transportation sectors across North America. NOTE: because TerraVest is small cap Canadian company (small caps have a market capitalization in the range of $300 million to $3 billion), it is not followed by any analysts. Therefore, there is no twelve-month price target for this company’s share price.
The Radar Check was last updated November 3, 2023.
Portfolio Update
Portfolio 1
Portfolio 1 for the week ended November 3, 2023: UP ![]()
- General Motors (NYSE: GM) and the United Auto Workers (UAW) reached an agreement on a new four-year contract. The deal brings an end to the six-week strike with GM employees receiving the same wages and benefits as Ford (NYSE: F) and Stellantis (NYSE: STLA).
- Tesla came away with a victory in the first lawsuit claiming its Autopilot driver assistant system caused the death of the driver. Tesla claimed the accident was the result of driver error and not the result of a defect in the car. The jury sided with Tesla. This is the first of several similar lawsuits against the company.
- The US Federal Trade Commission (FTC) filed a lawsuit against Amazon claiming the company used a secret algorithm to push up prices. The FTC claims the algorithm cost US consumers over US$ 1 billion. Amazon claims the pricing algorithm was created to see how closely other online retailers tracked Amazon’s prices. Amazon dropped the practise in 2010.
- Celsius Holdings (NASD: CELH) announced a 3 for 1 stock split, effective November 13. The split was done to make shares “more accessible to a broader base of investors and to improve the overall trading volume.”
- Apple’s share price fell after warning that their fourth quarter revenues were likely to come in below expectations, despite the fourth quarter traditionally being Apple’s best quarter. Apple said there currently is weak demand for iPads and other wearables.
Activity
No significant activity to report this week.
Dividends
Dividends Received this week for the following companies:
Companies followed by DRIP (Dividend Re-Investment Plan) indicate additional shares were purchased with the dividend. Any cash leftover was added to the cash balance.
Canadian $
Toronto-Dominion Bank (TSE: TD) DRIP
US $
No US$ dividends this past week.
Quarterly Reports
TMX Group Limited
All currency listed in millions of Canadian dollars, except for per share data.
Selected highlights from their third quarter 2023 financial results on October 31, 2023
- Revenue of $287.3 for the three months ended September 30, compared to $266.8 for the same period in 2022. An increase of almost 8%.
- Net income of $85.3 for the three months ended September 30, compared to net income of $81.0 in the same period in 2022.
- Diluted earnings per ordinary share of $0.31 for the three months ended September 30, compared to earnings of $0.29 per share for the same period in 2022.
- Revenue of $892.6 for the nine months ended September 30, compared to $839.2 for the same period in 2022. An increase of over 6%.
- Net earnings of $271.6 for the nine months ended September 30, compared to net earnings of $440.5 in the same period in 2022.
- Diluted earnings per ordinary share of $0.98 for the nine months ended September 30, compared to earnings of $1.57 per share for the same period in 2022.
Cameco Corporation
All currency listed in thousands of Canadian dollars, except for per share data.
Selected highlights from their third quarter 2023 financial results on October 31, 2023
- Revenue of $575,079 for the three months ended September 30, compared to $388,659 for the same period in 2022. An increase of almost 48%.
- Net income of $148,067 for the three months ended September 30, compared to a net loss of $19,534 in the same period in 2022.
- Diluted earnings per ordinary share of $0.34 for the three months ended September 30, compared to a loss of $0.05 per share for the same period in 2022.
- Revenue of $1,744,041 for the nine months ended September 30, compared to $1,344,274 for the same period in 2022. An increase of almost 30%.
- Net earnings of $280,723 for the nine months ended September 30, compared to net earnings of $104,687 in the same period in 2022.
- Diluted earnings per ordinary share of $0.65 for the nine months ended September 30, compared to earnings of $0.26 per share for the same period in 2022.
Lattice Semiconductor Corporation
All currency listed in thousands of US dollars, except for per share data.
Selected highlights from their third quarter 2023 financial results on October 30, 2023
- Revenue of $192,169 for the three months ended September 30, compared to $172,509 for the same period in 2022. An increase of almost 11%.
- Net income of $53,788 for the three months ended September 30, compared to net income of $46,359 in the same period in 2022.
- Diluted earnings per ordinary share of $0.38 for the three months ended September 30, compared to earnings of $0.33 per share for the same period in 2022.
- Revenue of $566,558 for the nine months ended September 30, compared to $484,396 for the same period in 2022. An increase of almost 17%.
- Net earnings of $160,355 for the nine months ended September 30, compared to net earnings of $126,969 in the same period in 2022.
- Diluted earnings per ordinary share of $1.15 for the nine months ended September 30, compared to earnings of $0.90 per share for the same period in 2022.
Pinterest, Inc.
All currency listed in thousands of US dollars, except for per share data.
Selected highlights from their third quarter 2023 financial results on October 30, 2023
- Revenue of $763,203 for the three months ended September 30, compared to $684,550 for the same period in 2022. An increase of over 11%.
- Net income of $6,733 for the three months ended September 30, compared to a net loss of $65,181 in the same period in 2022.
- Diluted earnings per ordinary share of $0.01 for the three months ended September 30, compared to a loss of $0.10 per share for the same period in 2022.
- Revenue of $2,073,809 for the nine months ended September 30, compared to $1,925,365 for the same period in 2022. An increase of almost 8%.
- Net loss of $236,788 for the nine months ended September 30, compared to a net loss of $113,538 in the same period in 2022.
- Diluted loss per ordinary share of $0.35 for the nine months ended September 30, compared to a loss of $0.17 per share for the same period in 2022.
PayPal Holdings, Inc.
All currency listed in millions of US dollars, except for per share data.
Selected highlights from their third quarter 2023 financial results on November 1, 2023
- Revenue of $7,418 for the three months ended September 30, compared to $6,846 for the same period in 2022. An increase of over 8%.
- Net income of $1,020 for the three months ended September 30, compared to net income of $1,330 in the same period in 2022.
- Diluted earnings per ordinary share of $0.93 for the three months ended September 30, compared to earnings of $1.15 per share for the same period in 2022.
- Revenue of $21,745 for the nine months ended September 30, compared to $20,135 for the same period in 2022. An increase of almost 8%.
- Net earnings of $2,844 for the nine months ended September 30, compared to net earnings of $1,498 in the same period in 2022.
- Diluted earnings per ordinary share of $2.55 for the nine months ended September 30, compared to earnings of $1.29 per share for the same period in 2022.
Roku, Inc.
All currency listed in thousands of US dollars, except for per share data.
Selected highlights from their third quarter 2023 financial results on November 1, 2023
- Revenue of $912,018 for the three months ended September 30, compared to $761,373 for the same period in 2022. An increase of almost 20%.
- Net loss of $330,071 for the three months ended September 30, compared to a net loss of $122,183 in the same period in 2022.
- Diluted loss per ordinary share of $2.33 for the three months ended September 30, compared to a loss of $0.88 per share for the same period in 2022.
- Revenue of $2,500,194 for the nine months ended September 30, compared to $2,259,478 for the same period in 2022. An increase of over 73%.
- Net loss of $631,270 for the nine months ended September 30, compared to net earnings of $260,810 in the same period in 2022.
- Diluted loss per ordinary share of $4.47 for the nine months ended September 30, compared to a loss of $1.90 per share for the same period in 2022.
Innovative Industrial Properties, Inc.
All currency listed in thousands of US dollars, except for per share data.
Selected highlights from their third quarter 2023 financial results on November 1, 2023
- Revenue of $77,826 for the three months ended September 30, compared to $70,883 for the same period in 2022. An increase of almost 10%.
- Net income of $41,256 for the three months ended September 30, compared to net income of $37,278 in the same period in 2022.
- Diluted earnings per ordinary share of $1.45 for the three months ended September 30, compared to earnings of $1.32 per share for the same period in 2022.
- Revenue of $230,350 for the nine months ended September 30, compared to $205,898 for the same period in 2022. An increase of almost 12%.
- Net earnings of $122,941 for the nine months ended September 30, compared to net earnings of $111,866 in the same period in 2022.
- Diluted earnings per ordinary share of $4.32 for the nine months ended September 30, compared to earnings of $4.06 per share for the same period in 2022.
BCE Inc.
All currency listed in millions of Canadian dollars, except for per share data.
Selected highlights from their third quarter 2023 financial results on November 2, 2023
- Revenue of $6,080 for the three months ended September 30, compared to $6,024 for the same period in 2022. An increase of almost 3%.
- Net income of $707 for the three months ended September 30, compared to net income of $771 in the same period in 2022.
- Diluted earnings per ordinary share of $0.70 for the three months ended September 30, compared to earnings of $0.78 per share for the same period in 2022.
- Revenue of $18,200 for the nine months ended September 30, compared to $17,735 for the same period in 2022. An increase of over 73%.
- Net earnings of $1,892 for the nine months ended September 30, compared to net earnings of $2,359 in the same period in 2022.
- Diluted earnings per ordinary share of $1.86 for the nine months ended September 30, compared to earnings of $2.40 per share for the same period in 2022.
Skyworks Solutions, Inc.
All currency listed in millions of US dollars, except for per share data.
Selected highlights from their fourth quarter 2023 financial results on November 2, 2023
- Revenue of $1,218.8 for the three months ended September 30, compared to $1,407.0 for the same period in 2022. A decrease of over 13%.
- Net income of $244.8 for the three months ended September 30, compared to net income of $302.2 in the same period in 2022.
- Diluted earnings per ordinary share of $1.52 for the three months ended September 30, compared to earnings of $1.88 per share for the same period in 2022.
- Revenue of $4,772.4 for the twelve months ended September 30, compared to $5,485.5 for the same period in 2022. A decrease of almost 13%.
- Net earnings of $982.8 for the twelve months ended September 30, compared to net earnings of $1,278.2 in the same period in 2022.
- Diluted earnings per ordinary share of $6.13 for the twelve months ended September 30, compared to earnings of $7.81 per share for the same period in 2022.
Cloudflare, Inc.
All currency listed in thousands of US dollars, except for per share data.
Selected highlights from their third quarter 2023 financial results on November 2, 2023
- Revenue of $335,603 for the three months ended September 30, compared to $253,857 for the same period in 2022. An increase of over 32%.
- Net loss of $23,535 for the three months ended September 30, compared to a net loss of $42,546 in the same period in 2022.
- Diluted loss per ordinary share of $0.07 for the three months ended September 30, compared to a loss of $0.13 per share for the same period in 2022.
- Revenue of $934,272 for the nine months ended September 30, compared to $700,541 for the same period in 2022. An increase of over 73%.
- Net loss of $156,084 for the nine months ended September 30, compared to a net loss of $147,464 in the same period in 2022.
- Diluted loss per ordinary share of $0.47 for the nine months ended September 30, compared to a loss of $0.45 per share for the same period in 2022.
Trisura Group Ltd.
All currency listed in thousands of Canadian dollars, except for per share data.
Selected highlights from their third quarter 2023 financial results on November 2, 2023
- Revenue of $730,714 for the three months ended September 30, compared to $550,861 for the same period in 2022. An increase of almost 33%.
- Net income of $14,838 for the three months ended September 30, compared to net income of $24,224 in the same period in 2022.
- Diluted earnings per ordinary share of $0.31 for the three months ended September 30, compared to earnings of $0.53 per share for the same period in 2022.
- Revenue of $2,034,234 for the nine months ended September 30, compared to $1,419,173 for the same period in 2022. An increase of over 43%.
- Net earnings of $55,621 for the nine months ended September 30, compared to net earnings of $68,505 in the same period in 2022.
- Diluted earnings per ordinary share of $1.18 for the nine months ended September 30, compared to earnings of $1.58 per share for the same period in 2022.
Lightspeed Commerce Inc.
All currency listed in thousands of US dollars, except for per share data.
Selected highlights from their second quarter 2023 financial results on November 2, 2023
- Revenue of $230,273 for the three months ended September 30, compared to $183,699 for the same period in 2022. An increase of over 25%.
- Net loss of $42,492 for the three months ended September 30, compared to a net loss of $79,943 in the same period in 2022.
- Diluted loss per ordinary share of $0.28 for the three months ended September 30, compared to a loss of $0.53 per share for the same period in 2022.
- Revenue of $439,359 for the nine months ended September 30, compared to $357,581 for the same period in 2022. An increase of almost 23%.
- Net earnings of $91,195 for the nine months ended September 30, compared to a net loss of $180,739 in the same period in 2022.
- Diluted loss per ordinary share of $0.60 for the nine months ended September 30, compared to a loss of $1.21 per share for the same period in 2022.
Andlauer Healthcare Group Inc.
All currency listed in thousands of Canadian dollars, except for per share data.
Selected highlights from their third quarter 2023 financial results on November 2, 2023
- Revenue of $156,754 for the three months ended September 30, compared to $164,898 for the same period in 2022. A decrease of almost 5%.
- Net income of $15,335 for the three months ended September 30, compared to net income of $18,995 in the same period in 2022.
- Diluted earnings per ordinary share of $0.36 for the three months ended September 30, compared to earnings of $0.44 per share for the same period in 2022.
- Revenue of $478,885 for the nine months ended September 30, compared to $482,651 for the same period in 2022. A decrease of almost 1%.
- Net earnings of $47,579 for the nine months ended September 30, compared to net earnings of $56,451 in the same period in 2022.
- Diluted earnings per ordinary share of $1.11 for the nine months ended September 30, compared to earnings of $1.32 per share for the same period in 2022.
Apple Inc.
All currency listed in millions of US dollars, except for per share data.
Selected highlights from their fourth quarter 2023 financial results on November 2, 2023
- Revenue of $89,498 for the three months ended September 30, compared to $90,146 for the same period in 2022. A decrease of almost 1%.
- Net income of $22,956 for the three months ended September 30, compared to net income of $20,721 in the same period in 2022.
- Diluted earnings per ordinary share of $1.46 for the three months ended September 30, compared to earnings of $1.29 per share for the same period in 2022.
- Revenue of $383,285 for the twelve months ended September 30, compared to $394,328 for the same period in 2022. A decrease of almost 3%.
- Net earnings of $96,995 for the twelve months ended September 30, compared to net earnings of $99,803 in the same period in 2022.
- Diluted earnings per ordinary share of $6.13 for the twelve months ended September 30, compared to earnings of $6.11 per share for the same period in 2022.
fuboTV Inc.
All currency listed in thousands of US dollars, except for per share data.
Selected highlights from their third quarter 2023 financial results on November 3, 2023
- Revenue of $320,935 for the three months ended September 30, compared to $224,989 for the same period in 2022. An increase of almost 43%.
- Net loss of $83,816 for the three months ended September 30, compared to a net loss of $152,746 in the same period in 2022.
- Diluted loss per ordinary share of $0.29 for the three months ended September 30, compared to a loss of $0.82 per share for the same period in 2022.
- Revenue of $958,044 for the nine months ended September 30, compared to $689,381 for the same period in 2022. An increase of almost 40%.
- Net loss of $217,364 for the nine months ended September 30, compared to a net loss of $409,496 in the same period in 2022.
- Diluted loss per ordinary share of $0.80 for the nine months ended September 30, compared to a loss of $2.32 per share for the same period in 2022.
Telus Corporation
All currency listed in millions of Canadian dollars, except for per share data.
Selected highlights from their third quarter 2023 financial results on November 3, 2023
- Revenue of $5,008 for the three months ended September 30, compared to $4,671 for the same period in 2022. An increase of over 7%.
- Net income of $137 for the three months ended September 30, compared to net income of $551 in the same period in 2022.
- Diluted earnings per ordinary share of $0.09 for the three months ended September 30, compared to earnings of $0.37 per share for the same period in 2022.
- Revenue of $14,918 for the nine months ended September 30, compared to $13,354 for the same period in 2022. An increase of almost 12%.
- Net earnings of $557 for the nine months ended September 30, compared to net earnings of $1,453 in the same period in 2022.
- Diluted earnings per ordinary share of $0.38 for the nine months ended September 30, compared to earnings of $0.99 per share for the same period in 2022.
Portfolio 2
Portfolio 2 for the week ended November 3, 2023: UP ![]()
- Guardant Health (NASD: GH) announced that initial results from the early-stage trials “suggest liquid biopsy may be used in post-surgical clinical management to reduce unnecessary toxicity from chemotherapy and improve the response to standard chemotherapy regimens in patients with stage III or high-risk stage II colon cancer.”
- TC Energy (TSE: TRP) is considering selling its stakes in ANR pipeline, Portland Natural Gas Transmission, Millenium Pipeline and their Mexican operation to raise money to reduce their debt and fund new investments. The company has not decided whether it will divest some or all those assets. If it were to sell all of those assets it could bring in US$ 10 billion.
- The Bank of Nova Scotia (TSE: BNS) sold its part of Canadian Tire’s (TSE: CTC.A) financial services unit back to Canadian Tire. The sale is to raise money in the event of increased default payments as the higher for longer interest rates begin to negatively impact the Canadian economy and consumers.
Activity
No significant activity to report this week.
Dividends
Dividends Received this week for the following companies:
Companies followed by DRIP (Dividend Re-Investment Plan) indicate additional shares were purchased with the dividend. Any cash leftover was added to the cash balance.
Canadian $
TC Energy Corp (TSE: TRP)
US $
No US$ dividends this past week.
Quarterly Reports
Hammond Power Solutions Inc.
All currency listed in thousands of Canadian dollars, except for per share data.
Selected highlights from their third quarter 2023 financial results on October 26, 2023
- Revenue of $179,521 for the three months ended September 30, compared to $148,953 for the same period in 2022. An increase of over 20%.
- Net income of $14,437 for the three months ended September 30, compared to net income of $11,531 in the same period in 2022.
- Diluted earnings per ordinary share of $1.21 for the three months ended September 30, compared to earnings of $0.97 per share for the same period in 2022.
- Revenue of $523,106 for the nine months ended September 30, compared to $414,211 for the same period in 2022. An increase of over 26%.
- Net earnings of $43,496 for the nine months ended September 30, compared to net earnings of $26,605 in the same period in 2022.
- Diluted earnings per ordinary share of $3.65 for the nine months ended September 30, compared to earnings of $2.25 per share for the same period in 2022.
Airbnb, Inc.
All currency listed in millions of US dollars, except for per share data.
Selected highlights from their third quarter 2023 financial results on November 1, 2023
- Revenue of $3,397 for the three months ended September 30, compared to $2,884 for the same period in 2022. An increase of almost 18%.
- Net income of $4,374 for the three months ended September 30, compared to net income of $1,214 in the same period in 2022.
- Diluted earnings per ordinary share of $6.63 for the three months ended September 30, compared to earnings of $1.79 per share for the same period in 2022.
- Revenue of $7,699 for the nine months ended September 30, compared to $6,497 for the same period in 2022. An increase of over 18%.
- Net earnings of $5,141 for the nine months ended September 30, compared to net earnings of $1,574 in the same period in 2022.
- Diluted earnings per ordinary share of $7.74 for the nine months ended September 30, compared to earnings of $2.31 per share for the same period in 2022.
Canadian Natural Resources Limited
All currency listed in thousands of US dollars, except for per share data.
Selected highlights from their third quarter 2023 financial results on November 1, 2023
- Revenue of $9,895 for the three months ended September 30, compared to $10,457 for the same period in 2022. A decrease of over 5%.
- Net income of $2,344 for the three months ended September 30, compared to net income of $2,814 in the same period in 2022.
- Diluted earnings per ordinary share of $2.13 for the three months ended September 30, compared to earnings of $2.49 per share for the same period in 2022.
- Revenue of $26,415 for the nine months ended September 30, compared to $32,609 for the same period in 2022. A decrease of almost 19%.
- Net earnings of $5,606 for the nine months ended September 30, compared to net earnings of $9,417 in the same period in 2022.
- Diluted earnings per ordinary share of $5.07 for the nine months ended September 30, compared to earnings of $8.12 per share for the same period in 2022.
Brookfield Renewable Partners L.P.
All currency listed in millions of US dollars, except for per share data.
Selected highlights from their third quarter 2023 financial results on November 3, 2023
- Revenue of $1,179 for the three months ended September 30, compared to $1,105 for the same period in 2022. An increase of almost 7%.
- Net loss of $64 for the three months ended September 30, compared to a net loss of $136 in the same period in 2022.
- Diluted loss per ordinary share of $0.14 for the three months ended September 30, compared to a loss of $0.25 per share for the same period in 2022.
- Revenue of $3,715 for the nine months ended September 30, compared to $3,515 for the same period in 2022. An increase of almost 6%.
- Net loss of $135 for the nine months ended September 30, compared to a net loss of $213 in the same period in 2022.
- Diluted loss per ordinary share of $0.34 for the nine months ended September 30, compared to a loss of $0.44 per share for the same period in 2022.
Telus Corporation
See report under Portfolio 2.
Portfolio 3
Portfolio 3 for the week ended November 3, 2023: UP ![]()
- Brookfield Asset Management (TSE: BAM) raised its offer for Australia’s Origin Energy to around US$10.50 billion. The BAM led consortium hopes its revised offer will be enough to get Origin shareholders to accept their offer for the Australian Energy producer and retailer.
- Shopify’ share price soared over 21% after the company posted a profit for the third quarter and easily surpassed analysts’ earnings per share expectations. The company was able to lower expenses while benefitting from their rollout of AI powered tools to help their customers optimize their online stores.
Activity
No significant activity to report this week.
Dividends
Dividends Received this week for the following companies:
Companies followed by DRIP (Dividend Re-Investment Plan) indicate additional shares were purchased with the dividend. Any cash leftover was added to the cash balance.
Canadian $
Toronto-Dominion Bank (TSE: TD)
US $
No US$ dividends this past week.
Quarterly Reports
Shopify Inc.
All currency listed in millions of US dollars, except for per share data.
Selected highlights from their third quarter 2023 financial results on November 2, 2023
- Revenue of $1,714 for the three months ended September 30, compared to $1,366 for the same period in 2022. An increase of over 25%.
- Net income of $718 for the three months ended September 30, compared to a net loss of $188 in the same period in 2022.
- Diluted earnings per ordinary share of $0.55 for the three months ended September 30, compared to a loss of $0.12 per share for the same period in 2022.
- Revenue of $4,916 for the nine months ended September 30, compared to $3,865 for the same period in 2022. An increase of over 27%.
- Net loss of $515 for the nine months ended September 30, compared to a net loss of $2,869 in the same period in 2022.
- Diluted loss per ordinary share of $0.41 for the nine months ended September 30, compared to a loss of $2.24 per share for the same period in 2022.
Cloudflare, Inc.
See report under Portfolio 1.
Brookfield Renewable Partners L.P.
See report under Portfolio 2.
Telus International Inc.
All currency listed in millions of US dollars, except for per share data.
Selected highlights from their third quarter 2023 financial results on November 3, 2023
- Revenue of $663 for the three months ended September 30, compared to $615 for the same period in 2022. An increase of almost 8%.
- Net income of $9 for the three months ended September 30, compared to net income of $59 in the same period in 2022.
- Diluted earnings per ordinary share of $0.03 for the three months ended September 30, compared to earnings of $0.22 per share for the same period in 2022.
- Revenue of $2,016 for the nine months ended September 30, compared to $1,838 for the same period in 2022. An increase of almost 10%.
- Net earnings of $16 for the nine months ended September 30, compared to net earnings of $149 in the same period in 2022.
- Diluted earnings per ordinary share of $.06 for the nine months ended September 30, compared to earnings of $0.55 per share for the same period in 2022.