
Since 2019, Nvidia’s (NASD: NVDA) share price has soared 3,476%, thanks to its pivotal role in supplying the heart of artificial intelligence (AI). Few companies wield as much market influence as Nvidia, and anticipation was sky-high leading up to its earnings release. Investors were on edge, eager to see whether Nvidia would meet or surpass expectations.
Goldman Sachs even dubbed Nvidia “the most important stock on planet Earth,” and it is easy to see why—this tech giant has surged 140% this year alone, despite the recent pullback.
Analysts were divided ahead of the report. Some believed the bar had been set too high, making it nearly impossible for Nvidia to satisfy the market’s lofty expectations. Others were more bullish, predicting that Nvidia would not only meet but surpass estimates, thanks to explosive growth in data centres and a potential boost in forward guidance.
As the heart of the AI rally, Nvidia’s performance was seen as a bellwether for the future of the AI market. More than just another earnings report, it offered a glimpse into the trajectory of AI and the broader tech sector.
When the earnings were finally revealed, Nvidia delivered another strong quarter, exceeding expectations but falling short of the most optimistic hopes. The company forecasted third-quarter revenue of around $32.5 billion, beating the average prediction of $31.9 billion but well below the top-end estimate of $37.9 billion. Adding to concerns were previously announced production issues with Nvidia’s latest high-end Blackwell semiconductor, which contributed to a nearly 4% drop in after-hours trading. By week’s end, Nvidia’s share price was down over 7%.
Investors were particularly on edge because any slowdown in Nvidia could signal a cooling of the AI-fueled rally, raising questions about whether the AI boom has peaked. Despite Nvidia’s stumble, other major tech companies that rely on its chips for their AI projects have so far managed to hold their ground.
Stepping back from the hype, Nvidia still delivered an outstanding quarter. Revenues rose 15% from the previous quarter and an astonishing 122% year-over-year, far exceeding the 5% growth expected for other S&P companies. For their second quarter, Nvidia’s revenue more than doubled to US$ 30 billion from the previous year, with profits also soaring to $16.6 billion. Data center revenue surged over 150% to $26.3 billion, beating expectations by a billion dollars. The company maintained impressive gross margins of 75%, underscoring its robust profitability. It seems investors may be overreacting to Nvidia missing excessive expectations, potentially overlooking the broader strength of the company and the ongoing AI revolution.
Nvidia’s earnings story offers a valuable lesson: even the biggest players can experience ups and downs, and market reactions can sometimes be driven more by expectations than by reality. As you continue your investing journey, remember to focus on the long-term potential of your investments rather than getting caught up in short-term fluctuations. Nvidia maintains a dominant position at the center of the AI revolution, and while the market may react to every quarterly report, your focus should be on the bigger picture and how these innovations can shape the future.
Aside from Nvidia’s earnings announcement, there was a lot of other economic news this week as August came to a close. Let’s take a look at what else happened…
Items that may only interest or educate me ….
Canadian Economic news, US Economic news, Tracking your investments, ….
Canadian Economic news
This past week’s key economic data that the Bank of Canada (BoC) considers when deciding whether to raise or lower the interest rate.
Gross Domestic Product (GDP)
The GDP report for June from Statistics Canada showed that growth in the Canadian economy slowed to 0.1%, down from a 0.2% increase in May, with GDP expanding 1.2% year-over-year.
Diving into the details, the ‘Goods-producing industries’ experienced a 0.4% contraction, marking their largest decline since December 2023. This downturn was partially offset by a modest 0.1% rise in the ‘Services-producing industries.’ Within the goods sector, ‘Utilities’ saw the most significant growth, up 2.3%, while ‘Manufacturing’ fell 1.5%. On the services side, the ‘Energy’ sector led with a 1.5% increase, whereas the ‘Management of companies and enterprises’ sector saw a sharp 3.7% decline.
Year-over-year, the ‘Goods-producing industries’ showed mixed results. The ‘Mining, quarrying, and oil and gas extraction’ industry surged 6.1%, while ‘Manufacturing’ dipped 1.5%. In the ‘Services-producing industries,’ the ‘Energy’ sector posted the biggest gain, up 3.9%, but the ‘Management of companies and enterprises’ sector plummeted by a staggering 32.6%.
Looking ahead, the advance estimate for July suggests that GDP will remain flat, with official data set to be released on September 27, 2024.
For the second quarter, GDP grew at an annualized rate of 2.1%, up from 1.7% in the first quarter and surpassing analysts’ expectations of 1.6% as well as the BoC’s forecast of 1.5%. Despite this stronger-than-expected growth, it still falls short of the BoC’s estimated potential growth rate of approximately 2.4%. This growth is largely driven by increased immigration rather than productivity gains. On a per capita basis, GDP declined for the fifth consecutive quarter, slipping 0.1% in the second quarter.
Canadian market volatility
Canada’s Volatility Index (CVIX) started the week at 11.04 and gradually eased to 10.40 by week’s end. This decline reflects the impact of positive economic news from both Canada and the US, which helped to stabilize market sentiment.
Tracked as VIXI on the Toronto Stock Exchange (TSE), the CVIX gauges anticipated market volatility. Readings below 10 suggest a calm and stable market, while values between 10 and 20 indicate moderate volatility and normal market fluctuations. Levels above 20 signal increased volatility and heightened market uncertainty.
US Economic news
This past week’s key data points that the Federal Reserve (Fed) considers when deciding whether to raise or lower the interest rate.
Personal Consumption Expenditures (PCE)
The July PCE price index from the US Bureau of Economic Analysis showed a 0.2% increase, up slightly from June’s 0.1%, matching analysts’ expectations. On an annual basis, prices rose by 2.5%, matching June’s reading but falling just short of the 2.6% forecast. The core PCE price index, which strips out the volatile food and energy sectors, also rose 0.2% in July, mirroring June’s increase. Year-over-year, core PCE inflation grew by 2.6%, just below the anticipated 2.7%. These figures confirm a steady decline in inflation, a key focus for investors, given that the PCE, especially the core measure, is the Fed’s preferred inflation gauge.
With Fed Chair Jerome Powell hinting at a rate cut in September during his recent speech at Jackson Hole, investors are now weighing the likelihood of a 0.25% reduction versus a more aggressive 0.5% cut. The steady inflation data from July keeps both options open, leaving markets to speculate on the Fed’s next move.
Gross Domestic Product (GDP)
The second estimate for GDP in the second quarter shows the economy gaining momentum, with growth at an annualized rate of 3.0%, surpassing analysts’ expectations of 2.8%. This marks a notable jump from the 1.4% growth in the first quarter and a slight upgrade from the initial 2.8% reported in the advance estimate.
The impressive performance was driven by 2.9% increase in consumer spending, a 7.5% boost in private inventory investment, and growth in non-residential fixed investments, although residential fixed investment saw a decline. This latest GDP report, a key measure of economic health, reflects a resilient economy overall. However, economic momentum has slowed this year after accelerating in the latter half of 2023.
With inflation easing according to the latest Consumer Price Index (CPI) and Personal Consumption Expenditures (PCE) reports, this strong GDP growth suggests the Fed may be on track to achieve a ‘soft landing’—bringing inflation back to 2% without triggering a recession.
This second estimate is based on more comprehensive data than was available for the initial ‘advance’ estimate.
American market volatility
The CBOE Volatility Index (VIX), known as the market’s “fear gauge,” began the week at 15.79. It spiked to 17.79 midweek following Nvidia’s earnings announcement but fell to 15.00 by the end of the week. Falling inflation, a robust economy, and expectations of a rate cut go a long way to calming investors’ jitters. 😊
The VIX measures expected market volatility over the next 30 days. Readings below 12 suggest a calm and stable market, while values between 12 and 20 indicate normal fluctuations. Levels between 20 and 30 signal heightened volatility and uncertainty, and readings above 30 reflect extreme stress, often seen during crises.
Consumer Sentiment Index (CSI)
The University of Michigan’s final reading on consumer sentiment for August came in at 67.9, just shy of analysts’ expectations of 68 but up from July’s 66.4. After four months of decline, the CSI finally edged higher, though it still lags behind last August’s reading of 69.4.
Looking closer, the Current Economic Conditions index rose to 61.3 from the mid-month reading of 60.9, although it remains below July’s 62.7 and significantly lower than last year’s 75.5. The Index of Consumer Expectations improved to 72.1, matching the initial estimate and outperforming July’s 68.8 and August 2023’s 65.4.
The improved sentiment is largely attributed to shifting election expectations, particularly after Kamala Harris became the Democratic candidate. This change boosted optimism among Democrats and independents, while Republicans grew more pessimistic.
Consumer Confidence Index (CCI)
Consumer confidence surged in August, with the Conference Board’s CCI hitting a six-month high of 103.3, surpassing July’s upwardly revised 101.9 and beating analysts’ expectations of 100.7. This rise reflects growing optimism among consumers, particularly in their assessment of current business and labour market conditions, as the Present Situation Index edged up from 133.1 to 134.4.
The Expectations Index, which gauges consumers’ short-term outlook for income, business, and labour market conditions, also showed improvement, climbing from 81.1 in July to 82.5 in August—the highest level since August 2023. Notably, this marks the second consecutive month the index has remained above 80, a positive sign, as readings below 80 often signal a potential recession.
While consumers felt more positive about current business conditions, their outlook on the labour market was slightly less optimistic, likely influenced by the recent rise in unemployment to 4.3% and early August’s stock market stumble. Looking ahead, consumers remain hopeful about the economy but cautious about future labour market conditions.
Overall, the CCI’s reading above 100 suggests a continued sense of optimism among consumers, with the Expectations Index serving as a critical indicator to watch. A sustained reading above 80 in the Expectations Index is encouraging, as anything below that level can hint at an economic slowdown.
How can I track and review my investment performance?
Now that you have dipped your toes into investing, it is time to track your investments to see if they are growing and, on their way to achieving your goals. Monitoring and reviewing your portfolio is essential for understanding how well it is performing. Here is a straightforward guide to get you started:
- Set Clear Goals: Start by defining what you want from your investments. Are you saving for retirement, a dream vacation, or a down payment on a home? Are you aiming for long-term growth, income through dividends, or something else? Knowing your goals gives you a clear benchmark to measure your performance against.
- Use an Investment Tracker: Most brokerages offer online tools that automatically track your investments. These tools show you how each stock or fund is performing and give you an overall view of your portfolio’s value. For instance, TD Direct Investing and TD Easy Trade provide totals for each sub-account (e.g., Canadian cash, US$ Cash, Canadian$ TFSA, US$ TFSA, etc.), as well as an overall total for each account. These tools make it easy to track your investments.
- Compare to Benchmarks: To gauge how well your investments are doing, compare them to relevant benchmarks like the S&P 500 (S&P) or the Toronto Stock Exchange Composite Index (TSX). This is not just about beating the benchmark (though that is always nice! 😊) but also about ensuring your portfolio is not trending down when the markets are moving up.
- Review Regularly: Make it a habit to review your portfolio at least once a quarter. This helps you see if your investments are on track to meet your goals. While stock prices will naturally fluctuate, significant drops in any of your holdings might warrant a closer look to understand what is driving the decline.
- Adjust as Needed: Based on your review, you might decide to rebalance your portfolio by buying or selling assets to maintain your desired allocation. This helps manage risk and keeps your investments aligned with your goals.
As an investor, remember you are playing the long game. It is easy to get caught up in the day-to-day fluctuations, but do not let emotions drive your decisions. Whether you prefer to “set it and forget it” or check your portfolio daily, having the right tools in place to monitor your investments ensures your money is working for you and helping you achieve your financial goals.
Weekly Market Review
Monday: the last week of August got off to a mixed start with the more traditional TSX and the Dow Jones Industrial Average (DJIA) ending in the green, while the more growth-oriented S&P, and the Nasdaq Composite Index (Nasdaq) ended in the red. Oil prices surged on reports of increased tensions in the Middle East and production shutdowns in Libya.
In Canada, higher oil prices and investors moving into commodity companies lifted the TSX to a record high set the previous Friday. In trading, the Energy sector was the big winner, while the Technology sector suffered the biggest decline.
In the US, the DJIA set a record high close, while the Nasdaq was dragged down by technology stocks ahead of Nvidia’s quarterly report. Investors were concerned that while Nvidia may have a strong report, it may not be good enough to meet extremely lofty expectations. In trading, Energy advanced the most, with Technology dropping the farthest.
Tuesday: the indexes were again mixed on a light day of trading as investors wait for Nvidia’s earnings release tomorrow. This time it was the TSX that fell into the red. Investors are also waiting to see how Friday’s PCE inflation data will impact the Fed’s decision to lower US interest rates. Oil prices declined on concerns about slower economic growth in the US and China, the largest and second largest economies, respectively.
In Canada, the TSX was weighed down by lower energy and commodity prices. In trading it was a day of broad-based losses with Consumer Staples the only sector to end higher, while the Energy sector suffered the biggest drop.
In the USA, The DJIA barely made it into the green, but it was enough to set another record high close. In trading, Technology posted the biggest gain while Energy recorded the biggest decline.
Wednesday: all four indexes ended lower as investors waited Nvidia’s earning announcement that came after the markets closed. Oil prices were down on concerns of a global economic slowdown, making it a very red day. 😊
In Canada, the TSX ended lower as investors booked some profits following the run up to a record high on Monday. In trading, Financials and Telecommunications Services were the only sectors to end higher, while Basic Materials (miners and fertilizer manufacturers) dropped the most.
In the US, despite Nvidia’s better than expected results, the share still fell 3% in after hours trading. In regular market hours, Financials and Healthcare were the only sectors to move higher, while Technology sank the farthest.
Thursday: the markets were mixed once again, with the TSX and DJIA ending higher while the Nasdaq and S&P ended lower. The latest economic news showed the American economy grew more than expected in the second quarter. Oil prices rose as Libya shut down its oil exports terminal and Iraq lowered its production levels.
In Canada, the TSX was lifted by the news the US economy remained strong and robust earnings reports from the majority of Canada’s big six banks. In trading, the Energy sector advanced the most, while Consumer Cyclicals declined the most.
In the US, the DJIA set its third record high close. Meanwhile, the S&P and Nasdaq were dragged lower by investors’ mixed reactions to Nvidia’s quarterly report that beat expectations but not the sky-high hopes of some analysts. In trading, Energy saw the biggest gain while Technology experienced the biggest drop.
Friday: a late afternoon surge in the markets ensured all four indexes ended the day in positive territory. The latest PCE inflation data came in lower than expected, increasing investor confidence that the Fed will lower rates in September. The double whammy of increasing oil inventories and weak demand from China caused oil prices to fall.
In Canada, a stronger than expected economy, combined with positive US inflation news, helped lift the TSX. In trading on Bay Street, the Technology sector advanced the most while Energy was the only sector to end lower.
In the US, the DJIA capped off the week with another record high close, fueled by the better-than-expected inflation report. On Wall Street, the Consumer Cyclicals sector led the charge, while the Energy sector brought up the rear.
Weekly Market and Portfolio Review
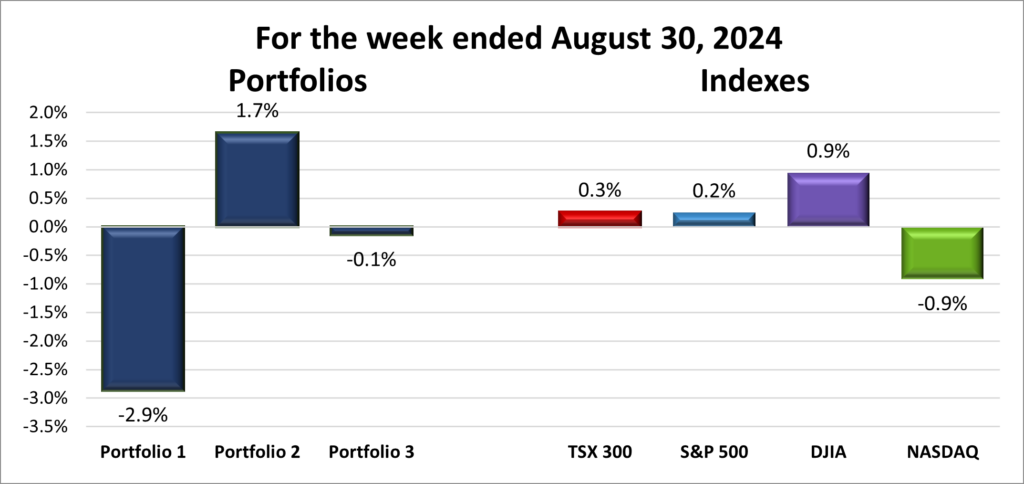
For the week, the TSX (SPTSX) gained 0.3%, the S&P 500 (SPX) advanced 0.2%, the DJIA (INDU) rose 0.9% and the Nasdaq (CCMP) sank 0.9%.
| Index | Weekly Streak |
| TSX: | 4 – week winning streak |
| S&P: | 3 – week winning streak |
| DJIA: | 3 – week winning streak |
| Nasdaq: | 1 – week losing streak |
![]() The last week of August was a bit of a rollercoaster ride, with some ups and downs before finishing the month on an upward trend that pulled three of the four indexes into positive territory.
The last week of August was a bit of a rollercoaster ride, with some ups and downs before finishing the month on an upward trend that pulled three of the four indexes into positive territory.
Driving the markets this past week were investor confidence that the Fed might lower the US benchmark rate at their September meeting, Nvidia’s second-quarter earnings, and positive economic news from both Canada and the US.
The likelihood of a rate cut in the US helped push both the value-oriented TSX and DJIA to record highs. The DJIA, which does not include Nvidia, set four new all-time highs this past week, bringing the total to 26 record highs so far this year. The tech-heavy Nasdaq and, to a lesser extent, the S&P dipped on concerns that Nvidia might not meet some investors’ sky-high expectations. However, at the end of the week, a stronger-than-expected Canadian economy lifted the TSX into the green, while the latest US inflation data did the same for the S&P. Unfortunately, the positive economic news wasn’t enough for the Nasdaq to overcome the dip (hopefully just a dip 😊) in Nvidia.
And just like that, the summer investing season wraps up. With the pros returning next week, we might see a bit more action as they start tidying up their portfolios. Buckle up—it looks like September could bring a bit more excitement to the markets!
| Portfolio | Weekly Streak |
| Portfolio 1: | 1 – week losing streak |
| Portfolio 2: | 1 – week winning streak |
| Portfolio 3: | 1 – week losing streak |
![]() Not the ideal way to close out the last week of summer, with two of the three portfolios posting weekly losses, as illustrated in the chart below. Portfolio 1 had the best percentage of stocks that posted a weekly gain, but it also fell the farthest thanks to its overweight in one company – Nvidia.
Not the ideal way to close out the last week of summer, with two of the three portfolios posting weekly losses, as illustrated in the chart below. Portfolio 1 had the best percentage of stocks that posted a weekly gain, but it also fell the farthest thanks to its overweight in one company – Nvidia.
Portfolio 1 saw a 50/50 mix of winners and losers, with Hammond Power Solutions (TSE: HPS.A) standing out with an impressive 11% gain—the only significant movement (over 10% up or down) in the portfolio. However, a hefty 8% drop in Nvidia dragged the portfolio deep into the red.
Portfolio 2 was the lone bright spot, despite only 44% of the holdings recording a weekly gains. The significant gains of MongoDB (NASD: MDB), which surged 17%, and Hammond Power Solutions’ 11% gain helped offset Birkenstock’s (NYSE: BIRK) 22% plunge.
Portfolio 3 mirrored Portfolio 2 in terms of the percentage of companies posting weekly gains, with just 43% of holdings in the green. However, unlike Portfolio 2, Portfolio 3 had no standout performers, falling just short of positive territory.
This week’s results were a stark contrast to the earlier highs when over 70% of each portfolio’s holdings were in the green. ☹ Once again, I am reminded that being overweight in one company is great when the share price is climbing, but not so great when it dips.
Monthly Market and Portfolio Review
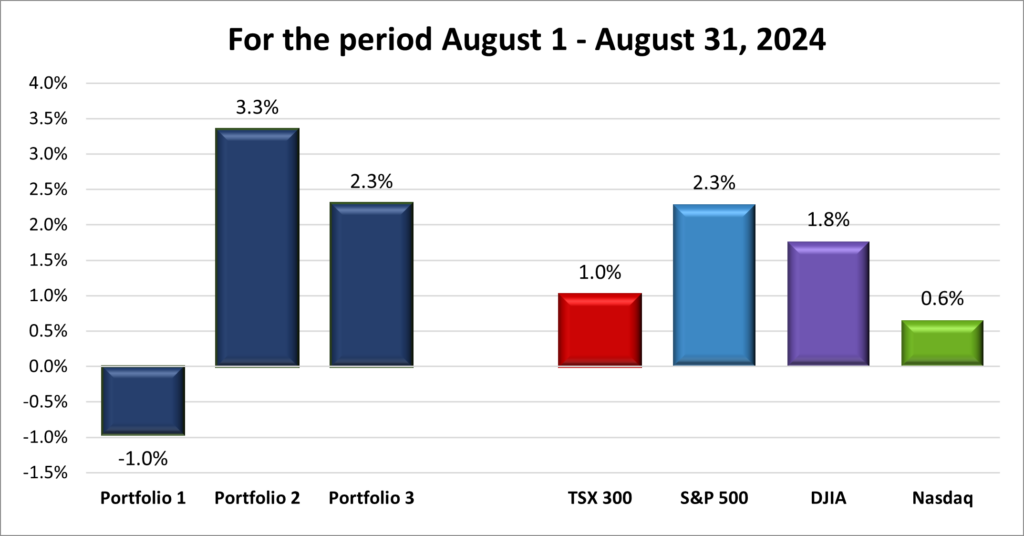
For the month of August, the TSX (SPTSX) rose 1.0%, the S&P 500 (SPX) surged 2.3%, the DJIA (INDU) advanced 1.8% and the Nasdaq (CCMP) was up 0.6%.
![]() Despite a rocky start that saw all four major North American indexes drop sharply at the start of the month, they overcame those early losses and rebounded to post a monthly gain, as shown in the chart above.
Despite a rocky start that saw all four major North American indexes drop sharply at the start of the month, they overcame those early losses and rebounded to post a monthly gain, as shown in the chart above.
The month kicked off with recession fears triggered by disappointing US labour reports, underwhelming earnings from heavyweight technology companies, a rotation from technology stocks to smaller, non-technology firms, and an unexpected interest rate hike by the Bank of Japan, which forced many hedge funds to sell off stocks to repay cheap loans they had taken in Japanese yen. This led to the S&P and DJIA suffering their largest single-day losses since September 2022. However, these fears were short-lived as other economic data pointed to a resilient American economy—slowing, but still robust. Inflation has dipped below 3% in both Canada and the US, with both countries inching closer to their respective central banks’ 2% target. Volatility spiked briefly, with indexes hitting 23.56 in Canada and 65.73 in the US, before settling back into the normal range of 10-20.
In Canada, the upward momentum was nearly derailed 😊 by a brief work stoppage at both major Canadian railways, which threatened to disrupt the flow of passengers and goods across the country, potentially harming the economy. Although the stoppage lasted only 17 hours, it took four days to fully restore normal operations.
As the markets stabilized, a sense of calm returned to investors. The turning point came when the minutes from the Fed’s last meeting revealed a shift in focus toward maintaining a strong economy and labour market rather than solely targeting inflation. Confidence grew that a rate cut was imminent in September, especially after Fed Chair Powell stated, “the time had come” to begin lowering interest rates. This optimism sparked a mini rally that, despite a brief midweek dip, helped all four indexes finish the month on a positive note.
With August over, many professional investors are returning to the markets, likely rebalancing their portfolios, which could lead to increased selling pressure. Additionally, mutual funds often sell underperforming stocks before the fiscal year-end, contributing to potential downward pressure. Historically, September has been a tough month for the markets, with increased volatility and negative returns more common. Let us hope history does not repeat itself but be prepared for more market fluctuations with lower rates and a presidential election on the horizon.
![]() As shown in the chart below, August brought a mixed bag for the three portfolios, with two out of the three finishing the month in the green. Interestingly, Portfolio 1 continued its streak from July as the sole portfolio to end August without a gain.
As shown in the chart below, August brought a mixed bag for the three portfolios, with two out of the three finishing the month in the green. Interestingly, Portfolio 1 continued its streak from July as the sole portfolio to end August without a gain.
Portfolio 1 struggled due to the heavy weight of Nvidia in the portfolio. As well, the other big technology companies that had driven the portfolio higher over the last year had a mixed month. A losing streak from July carried over into August, reaching four weeks before being interrupted by a substantial gain in the third week of the month. Unfortunately, this upward trend was short-lived as Nvidia fell 7% in the final week, pulling the portfolio into negative territory.
Portfolio 2 was the best performer, despite a tough month, with declines in two of the four weeks. I was surprised to see that not only did it record a monthly gain, but it also outperformed the other two portfolios and all four indexes. Its diversified and balanced approach helped limit the losses and the solid performances gains in two of the weeks provided a sizable gain, that more than offset losses from the other weeks.
Portfolio 3 also had a good month, achieving gains in three out of four weeks. It saw several of its holdings post impressive weekly gains, including some over 10%, but its success was mainly driven by consistent gains across the majority of its holdings.
August was a bit of a rollercoaster, with each portfolio taking a different path. Portfolio 1 hit some bumps, especially with Nvidia’s ups and downs, but Portfolio 2’s more balanced approach came out on top, proving that a little diversity goes a long way. Portfolio 3 had a steady ride, with consistent gains keeping it in good shape. Overall, the gains of Portfolios 2 and 3 more than offset the loss in Portfolio 1. As we move into September, historically a more volatile month, it is a good reminder that a mix of strategies can help weather whatever the market throws our way. 😊
Companies on the Radar
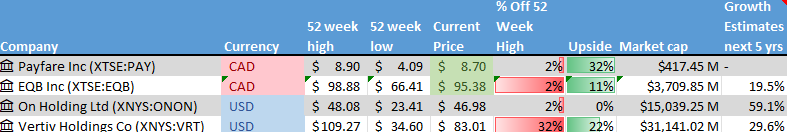
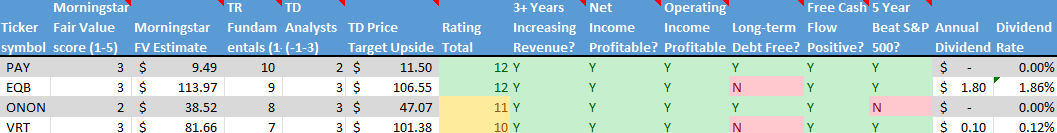
 After the flurry of activity last week, which saw three companies graduate to a portfolio, this week was quieter on the investing front. No new companies made the cut, leaving my radar list with just four prospects, each offering a unique and interesting opportunity.
- Equitable Bank (TSE: EQB), a mid sized (when the number of outstanding shares times the shares prices is between $2 billion to $10 billion) Canadian bank, considered Canada’s 7th bank, which provides financial services to consumers and businesses.
- Payfare Inc. (TSE: PAY), a small-cap Canadian company that provides gig workers with instant access to their earnings along with a comprehensive suite of digital banking services.
- Vertiv Holdings (NYSE: VRT), a large American company that designs and builds infrastructure and continuity solutions to businesses around the world.
- On Holding AG (NYSE: ONON), a medium cap Swiss company, founder-run, sports products company.
The Radar Check was last updated August 30, 2024.
Portfolio Update
Portfolio 1
Portfolio 1 for the week ended August 30, 2024: DOWN ![]()
- Berkshire Hathaway (NYSE: BRK.B) became the ninth company in the world to achieve a US$1 trillion valuation. It joins Nvidia Corp., Microsoft Corp. (NASD: MSFT), Apple Inc. (NASD: AAPL), Amazon.com Inc. (NASD: AMZN), Meta Platforms Inc. (NASD: META), Alphabet Inc. (NASD: GOOGL), Tesla Inc. (NASD: TSLA) and Saudi Aramco SA:2223.
- General Motors (NYSE: GM) and Samsung SDI announced they will invest US$ 3.5 billion to build an electric vehicle (EV) battery factory in Indiana.
- Amazon intends to replace the internally developed AI behind their upcoming updated Alexa voice system with third party Anthropic’s Claude AI models. The new AI infused Alexa is scheduled for release in October.
- CrowdStrike’s (NASD: CRWD) senior vice president for counter adversary operations Adam Meyers will testify before the House of Representatives’ Homeland Security Cybersecurity and Infrastructure Protection subcommittee. He will be answering questions about the company’s software update that caused an IT outage for many companies around the world.
Activity
No significant activity to report this week.
Dividends
Dividends Received this week for the following companies:
Companies followed by DRIP (Dividend Re-Investment Plan) indicate additional shares were purchased with the dividend. Any cash leftover was added to the cash balance.
Canadian $
TMX Group Ltd (TSE: X)
US $
No US$ dividends this past week.
Quarterly Reports
The Bank of Nova Scotia
Third quarter 2024 financial results on August 27, 2024
Nvidia Corporation
Second quarter 2025 financial results on August 28, 2024
CrowdStrike Holdings, Inc.
Second quarter 2025 financial results on August 28, 2024
Portfolio 2
Portfolio 2 for the week ended August 30, 2024: UP ![]()
- The US$ 8.5 billion merger of Walt Disney’s (NYSE: DIS) Indian media assets and India’s Reliance Industries (NSE: RELIANCE) has received conditional approval from the India’s competition regulator, The Competition Commission of India (CCI). The deal is subject to voluntary modifications which will be detailed later.
Activity
No significant activity to report this week.
Dividends
Dividends Received this week for the following companies:
No dividends this past week.
Quarterly Reports
The Bank of Nova Scotia
See report under Portfolio 1.
Birkenstock Holding plc
Third quarter 2024 financial results on August 29, 2024
MongoDB, Inc.
Second quarter 2025 financial results on August 29, 2024
Portfolio 3
Portfolio 3 for the week ended August 30, 2024: DOWN ![]()
- Shopify (TSE: SHOP) announced Mikhail Prakhin as their Chief Technology Officer. He joins the company after working at Microsoft where he worked on AI and search technologies.
- Lithium Americas (TSE: LAC) announced an agreement with GM to postpone an additional US$330 million investment until the end of the year. The company is exploring various options for structuring this second payment. If the deal is not finalized by December 20, 2024, LAC will be required to grant GM additional rights.
Activity
No significant activity to report this week.
Dividends
Dividends Received this week for the following companies:
Canadian $
Enghouse Systems Ltd (TSE: ENGH)
Royal Bank of Canada (TSE: RY)
US $
No US$ dividends this past week.
Quarterly Reports
Royal Bank of Canada
Third quarter 2024 financial results on August 28, 2024