
The AI Trade Reignites
Recently, markets have been on a hot streak, with major indexes repeatedly setting fresh highs before quickly breaking them again. A big driver behind this move has been a resurgence in artificial Intelligence (AI) stocks, which have once again found themselves at the centre of market attention.
To understand why that matters, it helps to zoom out. The AI boom didn’t really start this year – it began building momentum years ago as breakthroughs in machine learning and large language models moved from research labs into real-world applications. The launch of ChatGPT in late 2022 acted as a catalyst, turning what was once a niche theme into a mainstream market narrative almost overnight. Since then, the story has been driven by a small group of “picks and shovels” companies: semiconductors like Nvidia (NASDAQ: NVDA), and cloud infrastructure players like Amazon’s (NASDAQ: AMZN) AWS, which runs massive global data centre networks powering computing, storage, and AI services. In short, these companies form the backbone of the AI revolution.
Fast forward to this year, and the story got a bit more complicated.
Concerns started to build around the scale of AI spending, the timeline for monetisation, and whether enthusiasm had moved ahead of reality. A clear example came through Alphabet’s latest earnings, which pointed to roughly $180–$190 billion in planned 2026 capital spending tied to AI infrastructure, alongside plans to raise around $80 billion more in external financing. That combination of heavy investment and outside funding highlights just how capital-intensive the AI race has become, even for the largest players. Investors began questioning whether this level of spending would translate into meaningful earnings growth or reflect a cycle of uncertain payoffs.
At the same time, a second concern appeared around disruption. It wasn’t just about whether AI investments would work – it was whether AI itself could disrupt the companies doing the spending. If AI reshapes search, software, and content creation, it raises questions about whether today’s dominant business models could face structural pressure over time. That mix of high costs and uncertainty around long-term winners led to periods where AI-related stocks cooled off, even as the broader theme remained intact. For example, cybersecurity companies like Cloudflare (NYSE: NET) saw their share price drop sharply in late February on disruption concerns before later recovering as those fears eased.
But recently, that narrative has swung back in the other direction.
So why is AI so hot again?
It starts with earnings. Companies at the centre of the AI ecosystem continue to report strong demand for infrastructure, especially in high-performance computing and data centres. Microsoft (NASDAQ: MSFT), Alphabet (NASDAQ: GOOGL), and Amazon all delivered strong quarters, beating expectations and either maintaining or raising guidance. The key driver across the group was still demand flowing into cloud and advertising. Importantly, this wasn’t just cost-cutting strength – it was real revenue growth tied to AI services. Spending has stayed elevated, reinforcing the idea that we’re still early in a multi-year investment cycle.
On top of that, guidance has become just as important as results. Markets care not just about growth, but whether it’s accelerating or slowing. Right now, AI demand is still running ahead of expectations, pulling capital back into the theme after earlier doubts.
Finally, momentum is doing its part. Once a dominant narrative reasserts itself, it tends to attract flows and positioning quickly. With a small number of mega-cap names carrying heavy index weight, that strength feeds directly into broader market performance.
The result is a familiar pattern: AI moving from doubt back to dominance – now increasingly supported not just by sentiment, but by real earnings power at the core of the ecosystem.
The real question now is whether that renewed AI enthusiasm actually translated into market performance this past week, and what it meant for my three portfolios.
Items that may only interest or educate me ….
Canadian Economic news, US Economic news, ….
Canadian Economic news
This past week’s key economic data that the Bank of Canada (BoC) considers when deciding whether to raise or lower the interest rate.
Labour Force Survey (LFS)
Statistics Canada’s LFS delivered a pleasant surprise in May, showing the economy gained 87,800 jobs, far above economists’ expectations of roughly 10,000. Even more encouraging, the gains were concentrated in full-time employment, which is generally viewed as a sign of a healthier labour market than part-time hiring. Canada’s unemployment rate also unexpectedly fell to 6.6% from 6.9%, while analysts had expected it to remain unchanged.
The strength of the report becomes even more apparent when viewed in the context of the past few months. From January through April, employment growth had been soft, and the unemployment rate had gradually climbed from 6.7% to 6.9%, raising concerns that economic growth was slowing more rapidly than expected. May’s gain was the first significant increase since November 2025 and erased nearly 80% of the losses from earlier this year, suggesting the Canadian economy may be proving more resilient than many had thought.
Wage growth also continued to cool. Average hourly wages rose 3.2% year-over-year, down from 4.8% previously. That’s encouraging from an inflation perspective because slower wage growth can reduce pressure on businesses to raise prices to offset higher labour costs.
For us investors, the report presented a bit of a trade-off. Strong job growth and lower unemployment are positive signs for the economy, but a stronger labour market also reduces the urgency for the BoC to lower interest rates. In other words, the report eased concerns about the economy while simultaneously making additional rate cuts in the near term somewhat less likely.
Canadian Market Volatility
Canada’s version of the market “fear gauge” is the S&P/TSX 60 VIX Index (VIXC), often shown on trading platforms as VIXI.TO. Like the better-known CBOE Volatility Index in the US, it measures the level of volatility investors expect in the Canadian stock market over the next 30 days.
The VIXC opened the week at 14.35 and spent most of the week hovering near the 14 level. Toward the end of the week, however, it moved higher following stronger-than-expected labour reports in both Canada and the US, which reduced expectations for near-term interest rate cuts. The index ultimately closed at 14.96, slightly above where it began the week.
Overall, the VIXC remained relatively subdued despite several market-moving developments during the week. While oil prices swung on Middle East headlines and interest rate expectations shifted following strong labour data, volatility in the Canadian market stayed well contained. That reflects the TSX’s composition, which is more heavily weighted toward financials, energy, and materials than high-growth technology stocks. As a result, the Canadian market often experiences less dramatic swings in investor sentiment than its US counterparts.
US Economic news
This past week’s key data points that the Federal Reserve (Fed) considers when deciding whether to raise or lower the interest rate.
Labour data
This week’s labour data includes three key reports – the Job Openings and Labor Turnover Survey (JOLTS), the ADP Employment Report, and the Employment Situation Summary (ESS) – each offering a different lens on the US job market.
JOLTS focuses on labour demand through job openings, hiring, and quits. ADP provides an early read on private-sector payrolls. The ESS, often referred to as the monthly jobs report, ties everything together with job creation, unemployment, and wage growth. Together, these reports help investors assess whether the labour market is holding firm or gradually cooling.
Labor Department’s Job Openings and Labor Turnover Survey (JOLTS)
The Bureau of Labor Statistics’ JOLTS report showed job openings unexpectedly surged to 7.6 million in April, well above both the upwardly revised 6.9 million in March and economists’ expectations. The increase marked the largest monthly jump in job openings in about five years and pushed openings to their highest level since 2024, suggesting employers are still willing to hire despite a slowing growth environment.
ADP Employment Report
The ADP Employment Report showed private-sector employers added 122,000 jobs in May, up from a downwardly revised 105,000 in April and slightly ahead of expectations of 117,000.
Hiring was broad-based across eight of ten industries and included gains across businesses of all sizes. The data points to a labour market that continues to expand at a moderate pace rather than one experiencing a meaningful slowdown.
The Bureau of Labor Statistics’ Employment Situation Summary (ESS).
The May ESS provided the most complete view of the labour market, confirming that conditions are cooling gradually but remain resilient, with the third straight month of stronger-than-expected job gains.
The economy added 172,000 jobs in May, well above expectations of roughly 85,000, while the unemployment rate held steady at 4.3%. March and April payrolls were also revised higher by a combined 93,000, reinforcing stronger-than-previously-reported momentum.
Wage growth continued to ease, with average hourly earnings rising 0.3% on the month and slowing to 3.4% year-over-year from 3.6% previously. This suggests the labour market is still generating income growth, but with less inflationary pressure than in prior years.
Overall, the report reinforces a labour market that is cooling in an orderly way rather than weakening sharply. Hiring is moderating from earlier extremes but remains strong enough to support household income and spending.
Overall Labour Analysis
Taken together, this week’s labour data points to a US labour market that is cooling in an orderly way rather than showing meaningful weakness. Job openings are still elevated, hiring is steady, and wage growth continues to ease. The result is a normalization from an overheated environment without signs of a sharp deterioration.
This balance matters because the labour market sits at the centre of the inflation outlook. Strong hiring and wage growth can sustain price pressures, while a sharper slowdown would raise recession risks. At present, neither side is dominant, with conditions gradually normalizing while wage pressures continue to ease.
For the Fed, this creates a mixed picture. Easing wage growth supports progress on inflation, but continued job strength reduces urgency to cut rates. As a result, expectations for near-term rate cuts remain highly data-dependent.
For markets, the message is similarly balanced. The data supports the soft landing narrative – slowing growth without recession – but also implies rates may stay higher for longer than previously expected. This supports earnings stability while limiting upside from falling yields in the near term.
Overall, the labour market remains a stabilizing force in the economy. It is no longer overheated, but it is also not weakening in a way that threatens the broader expansion. That middle ground continues to anchor the economic cycle even as growth moderates and policy remains restrictive.
American Market Volatility
The VIX, often called the market’s “fear gauge,” measures how much volatility investors expect in the S&P 500 over the next 30 days. In simple terms, it reflects how much uncertainty is being priced into markets. The VIX tends to rise when fear increases and fall when confidence improves. Readings above 20 are often associated with elevated stress, while levels below that typically point to calmer conditions.
The index opened the week at 15.88 and remained fairly stable near the 16 level before surging toward 20 following stronger-than-expected labour market data. The report fuelled concerns that interest rates could remain higher for longer, reducing expectations for future rate cuts. Combined with ongoing geopolitical uncertainty surrounding US-Iran tensions, which pushed volatility higher as the week progressed. The fear gauge ultimately finished the week at 21.51.
Overall, the rise in the VIX suggested investors became more cautious as the week unfolded. While markets remained near record highs for much of the week, stronger economic data, shifting interest rate expectations, and renewed geopolitical uncertainty prompted traders to price in a greater degree of risk and potential market volatility in the weeks ahead.
Weekly Market and Portfolio Review
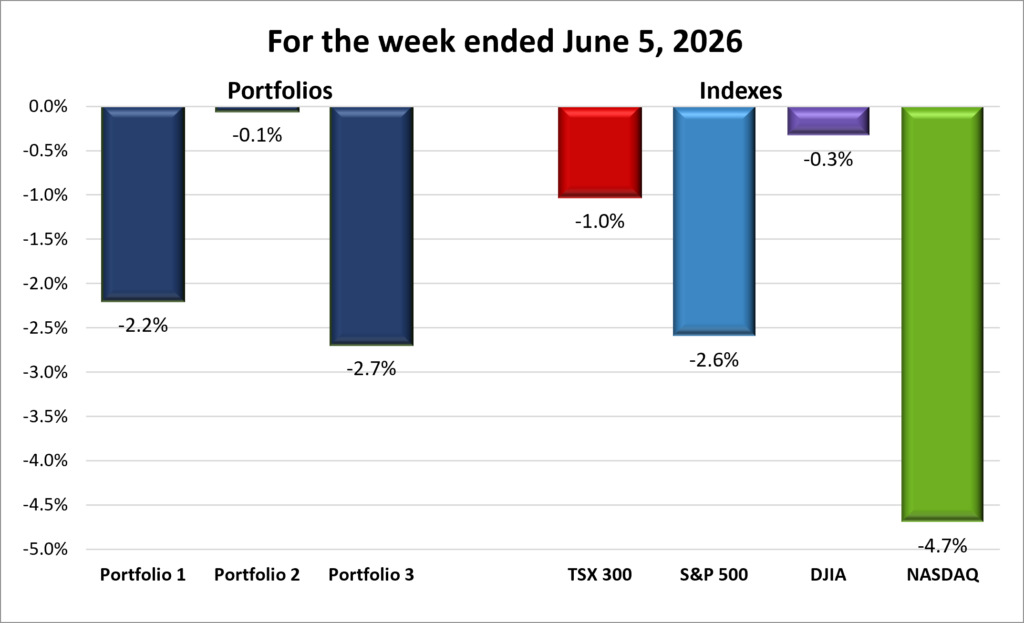
For the week, the TSX (SPTSX) lost 1.0%, the S&P 500 (SPX) dropped 2.6%, the DJIA (INDU) slipped 0.3% and the Nasdaq (CCMP) plunged 4.7%.
| Index | Weekly Streak |
| TSX: | 1 – week losing streak |
| S&P: | 1 – week losing streak |
| DJIA: | 1 – week losing streak |
| Nasdaq: | 1 – week losing streak |
![]() The first week of June got off to a strong start, with markets climbing to fresh record highs before a midweek wobble briefly interrupted momentum. What began as a steady advance across major indexes gradually shifted into a more uneven tone, as late-week weakness in technology, along with renewed geopolitical uncertainty, weighed on sentiment and dragged markets lower into the close.
The first week of June got off to a strong start, with markets climbing to fresh record highs before a midweek wobble briefly interrupted momentum. What began as a steady advance across major indexes gradually shifted into a more uneven tone, as late-week weakness in technology, along with renewed geopolitical uncertainty, weighed on sentiment and dragged markets lower into the close.
All four indexes – the Toronto Stock Exchange Composite Index (TSX), Dow Jones Industrial Average (DJIA), S&P 500 Index (S&P), and Nasdaq Composite Index (Nasdaq) – followed a similar path: early gains, a midweek pullback, a rebound, and another decline. The final drop was the sharpest, pushing all four indexes into the red for the week and snapping the S&P’s nine-week winning streak.
During the week, the TSX briefly moved above 35,000 for the first time. The DJIA recorded five consecutive record-high closes before its streak was snapped midweek. Meanwhile, the Nasdaq and S&P extended their winning streaks to nine sessions before the pullback. Both also posted six straight record-high closes during that run, with the S&P marking its longest winning streak in more than a year and finishing just one week short of its longest run since 1985.
As momentum faded at the end of the week, weakness in technology weighed on sentiment as concerns around AI-related spending emerged, alongside a broader rotation into more defensive areas such as healthcare and financials. To close out the week, the Nasdaq plunged 4%, its sharpest decline since the tariff-driven selloff in April 2025, erasing gains from the earlier part of the week.
The biggest driver remained AI. Companies involved in semiconductors, cloud infrastructure, and data centres continued to benefit from expectations of sustained AI spending. However, following Broadcom’s (NASDAQ: AVGO) earnings outlook, momentum in large-cap technology companies and chipmakers cooled as investors rotated into less aggressive parts of the market.
Geopolitical developments also played a key role. Midweek, markets pulled back after renewed US-Iran tensions pushed oil prices higher and raised inflation concerns. Sentiment then swung as hopes for de-escalation rose and fell, with stalled negotiations keeping uncertainty elevated.
Interest rate expectations were shaped by stronger-than-expected US labour market data. The report reinforced economic resilience but reduced expectations for near-term rate cuts, adding pressure to rate-sensitive sectors.
Labour data also supported the broader soft landing narrative, suggesting conditions are cooling gradually rather than weakening sharply. That helped sustain confidence that inflation can ease without triggering a recession, keeping sentiment broadly constructive.
In Canada, the TSX was driven mainly by energy prices and geopolitical developments. Early-week US-Iran tensions pushed oil higher, supporting Canada’s energy-heavy market while also raising inflation concerns and delaying expectations for rate cuts.
Sentiment then shifted as hopes for end to the war rose and fell, with stalled negotiations driving swings in both oil prices and the TSX.
The TSX also benefited from spillover AI optimism. While Canada lacks large mega-cap technology exposure, strong US technology earnings and AI infrastructure spending supported Canadian technology sentiment and stronger willingness to invest in riskier technology stocks.
Canadian labour data came in stronger than expected, reinforcing economic resilience but also tempering expectations for near-term rate cuts, adding a mixed backdrop for rate-sensitive sectors.
The TSX also sold off late in the week, posting its sharpest decline in nearly four months as weaker commodity prices and shifting rate expectations weighed on sentiment.
Overall, the week reflected competing forces, with AI strength, geopolitical uncertainty, and shifting rate expectations pulling markets in different directions, but still leaving major indexes near record levels.
| Portfolio | Weekly Streak |
| Portfolio 1: | 1 – week losing streak |
| Portfolio 2: | 1 – week losing streak |
| Portfolio 3: | 1 – week losing streak |
![]() A late-week market selloff took the shine off what had been a strong start to the week and pushed all three portfolios lower, snapping their recent winning streaks. ☹ All three portfolios were on track to extend those streaks as of Thursday’s close, but a sharp reversal in the technology sector on Friday changed the picture dramatically. Nvidia fell 6% that day, wiping out roughly US$300 billion in its market value. By week’s end, the stock was down 10%, weighing heavily on Portfolios 1 and 3 where it is still the largest holding.
A late-week market selloff took the shine off what had been a strong start to the week and pushed all three portfolios lower, snapping their recent winning streaks. ☹ All three portfolios were on track to extend those streaks as of Thursday’s close, but a sharp reversal in the technology sector on Friday changed the picture dramatically. Nvidia fell 6% that day, wiping out roughly US$300 billion in its market value. By week’s end, the stock was down 10%, weighing heavily on Portfolios 1 and 3 where it is still the largest holding.
Portfolio 1 finished down 2.2%, with only 34% of holdings ending the week higher. Early in the week, names like Lattice Semiconductor (NASDAQ: LSCC), Celestica (TSE: CLS), Cloudflare, CrowdStrike (NASDAQ: CRWD), and Datadog (NASDAQ: DDOG) all reached new all-time highs, showing strong underlying momentum. However, the late-week reversal was broad-based, with losses across much of the portfolio. Alongside Nvidia’s decline, Celsius Holdings (NASDAQ: CELH) was a notable laggard, falling 13%.
Portfolio 2 was the best performer among the portfolios and major indexes, slipping just 0.1%. Much of that resilience came from a broader base of strength, with 62% of holdings finishing the week higher. Aritzia (TSE: ATZ) stood out with a new record high, while the portfolio’s largest holding, Bank of Nova Scotia (TSE: BNS), gained 3%, helping offset weakness elsewhere. Microsoft declined 10% and Mitek Systems (NASDAQ: MITK) fell 14%, which ultimately weighed on performance despite the stronger participation.
Portfolio 3 had the weakest performance, falling 2.7%. That wasn’t surprising given that only 34% of holdings finished the week higher and losses were widespread across several key positions. While Rocket Lab (NASDAQ: RKLB) posted the largest percentage decline among the major holdings, falling 17%, Nvidia’s 10% drop had the biggest impact on the portfolio because it remains the largest position. Microsoft and Broadcom also weighed on results, declining 10% and 13%, respectively. It’s a good reminder that a stock’s influence on a portfolio depends not only on how much it moves, but also on how large the position is.
Broadcom’s move was particularly notable. Despite beating both revenue and earnings expectations, the stock fell 13% in the back half of the week, erasing roughly US$320 billion in market value after its AI chip sales guidance disappointed investors. It’s a reminder that strong results alone aren’t always enough. When expectations become extremely high, even good news can disappoint. Markets are always looking forward, not backward. ☹
As mentioned at the start of the portfolio review, the late-week selloff in technology stocks, particularly AI-related companies, turned what had been shaping up to be a winning week into a losing one. Hopefully, this was simply a healthy pullback after a strong rally rather than a sign that investors are once again becoming nervous about AI spending. We’ll find out soon enough as investors cast their votes next week. I know which outcome I’m hoping for. 😊
Companies on the Radar
 It was an unusually busy week on my radar, with one company making both its debut and departure, while three others also exited the list.
Exiting the list was Fabrinet (NYSE: FN), a manufacturer of high-speed optical transceivers, laser systems, and sensors used in communications and data networking. While the business operates in an attractive industry, I ultimately found it difficult to gather the level of information and transparency I prefer when researching a company, so I decided to move my attention elsewhere.
Making its first appearance on the radar was MDA Space (TSE: MDA), a Canadian mid-cap company that develops advanced space technologies, satellite systems, and robotics. The company has played a role in some of the world’s most recognizable space projects, including the iconic Canadarm robotic systems used on NASA’s Space Shuttle program and the International Space Station.
MDA’s stay on the radar was brief. After completing my research, I gained enough conviction to add the company directly to Portfolio 3 alongside Corning (NYSE: GLW) and Amphenol Corporation (NYSE: APH), which dropped to my bid when the markets pulled back midweek. All three companies operate in industries supported by strong long-term growth trends, with Corning and Amphenol benefiting from continued demand driven by AI infrastructure. Corning builds the fibre, and Amphenol connects everything together within the global data infrastructure ecosystem, while MDA is positioned to benefit from the expanding space economy.
With Fabrinet removed and MDA Space, Corning, and Amphenol moving into Portfolio 3, my radar list has been reduced to just two holdovers from last week:
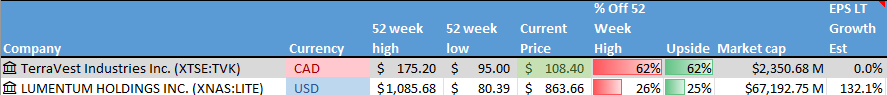
- TerraVest Industries (TSE: TVK) Industries: A mid-cap Canadian industrial company that produces equipment for energy, storage, and transportation markets, including propane tanks, pressure vessels, and heating systems. It grows through a mix of organic expansion and acquisitions, serving steady, asset-heavy industrial niches across North America.
- Lumentum Holdings (NASDAQ: LITE): A US large-cap optical networking company that designs and sells photonics components such as lasers and transceivers used in AI data centres and telecom networks. It sits in the middle of the value chain, turning optical technology into finished components that move data between systems.
As always, these are not buy recommendations. Make sure to do your own research and choose investments that fit your personal financial goals.
The Radar Check was last updated June 5, 2026.

Portfolio Update
Portfolio 3
Sold: Lithium Americas (TSE: LAC): My original investment thesis when I invested in the company back in July 2023 was based on the expectation that rapidly growing EV demand would create strong long-term demand for lithium. While EV adoption continues to increase, the growth rate has slowed from the optimistic forecasts that were common back then, and global lithium supply has expanded significantly. As a result, lithium prices have remained under pressure.
Although Lithium Americas has strong strategic partnerships, including support from General Motors and the US government, the investment case has gradually become more dependent on a series of future outcomes: higher lithium prices, successful project execution, and continued long-term demand growth all needing to align.
Given those uncertainties, I prefer to put my capital into companies that are already generating real cash flow, and proving themselves today, often with strong tailwinds behind them, rather than waiting on multiple future assumptions to play out.
Capital Redeployment
With the remaining cash from trimming my NVIDIA position back in April, I’ve redeployed that capital by becoming an owner of Corning and Amphenol, both of which benefit from the AI buildout while also having diversified revenue streams. At the same time, I used the proceeds from the sale of Lithium Americas to become an owner of MDA Space, increasing exposure to the growing space infrastructure theme. In all three cases, these are very small ownership stakes 😊.
Bought: Corning: I’ve had my eye on Corning for quite some time. What initially attracted me was its position as one of the world’s leading manufacturers of fibre optic cable, a key part of the infrastructure powering the internet, cloud computing, and AI data centres. During my research, I was surprised to learn that Corning is also the company behind Gorilla Glass, the durable glass used in millions of smartphones, tablets, laptops, and other devices around the world, including Apple’s (NASDAQ: AAPL) iPhone lineup.
Corning is one of those companies most people interact with every day without realizing it. A simple way to think about the business is that it operates on both sides of our increasingly connected world. On one side, it produces the specialized glass found in many of the devices we use daily. On the other, it builds the fibre optic infrastructure that moves enormous amounts of information between those devices, cloud servers, and AI systems. In both cases, Corning isn’t usually the final product consumers buy, but it is often a critical component that makes those products and services work.
The company is well positioned to benefit from several powerful long-term growth trends, especially the rise of AI. AI models require massive amounts of information to move between chips, servers, and data centres at high speeds. To keep up, many of the world’s largest cloud and technology companies are upgrading their networks, replacing older copper-based connections with fibre optic infrastructure that can handle far more data. As investment in AI infrastructure continues to grow, Corning stands to benefit by supplying many of the “highways” that information travels on.
The business has also been showing improving momentum. Demand in its optical communications segment has strengthened, supporting revenue growth and helping profitability recover after a weaker period for the fibre industry. At the same time, its display technologies business has stabilized, adding another layer of earnings support. Together, these trends suggest the company may be entering a stronger phase after several years of uneven performance.
Of course, no investment is without risk. Corning relies on a relatively small number of large cloud, technology, and telecommunications customers, making it sensitive to shifts in their spending. It is also exposed to global supply chains, trade tensions, and cyclical demand in areas like consumer electronics and display panels.
While these risks are worth watching, I think the market is still more focused on the companies designing AI chips than the infrastructure required to connect them. Yet moving and processing information are two sides of the same coin. Corning may not be the flashiest AI investment, but it provides a critical piece of the puzzle.
Overall, I see Corning as a high-quality infrastructure business positioned to benefit from the continued growth of AI, cloud computing, and global connectivity. It’s not a company I expect to double overnight, but one that can steadily grow earnings and shareholder value over time as demand for faster, more reliable connectivity continues to expand.
Bought: Amphenol Corporation: Amphenol wasn’t a company I initially set out looking for, but it quickly stood out during my due diligence. At its core, Amphenol designs and manufactures high-performance connectors, cables, and interconnect systems that allow electronic devices, servers, and networks to communicate with each other. In simple terms, if Corning builds parts of the “highways” that data travels on, Amphenol builds many of the “on-ramps and junctions” that make sure everything is properly connected.
The business plays a critical role in the physical infrastructure behind modern technology. Its products are found in data centres, telecommunications networks, industrial systems, aerospace applications, and automotive electronics. What makes this interesting is that Amphenol is not dependent on a single end market. Instead, it benefits from the steady increase in connectivity demands across almost every part of the economy.
The AI buildout has become a particularly important tailwind. As data centres expand and become more complex, they require significantly more connectors, cables, and high-speed interconnect systems to move data between servers, chips, and networking equipment. This is where Amphenol benefits directly. More computing power doesn’t just mean better chips – it also means a far greater number of physical connections required to link everything together. That demand scales alongside AI infrastructure growth. Importantly, Amphenol benefits regardless of whether data is transmitted over copper or fibre optic networks, since its products sit at the connection layer between systems.
The company has also demonstrated strong operating momentum in recent years. Revenue growth has been supported by broad-based demand across its key segments, while margins have remained relatively resilient thanks to its diversified end markets and disciplined execution. Unlike more cyclical industrial companies, Amphenol has shown an ability to grow steadily through different economic environments, partly because its exposure is spread across multiple industries rather than concentrated in one.
Of course, there are risks to consider. Amphenol is still exposed to cyclical demand in areas like industrial production and automotive markets, which can fluctuate with the broader economy. It also operates in highly competitive segments where pricing pressure can emerge, and like many global manufacturers, it is exposed to supply chain and geopolitical risks given its international footprint.
The market often rewards the most visible parts of the AI ecosystem – like chip designers such as Nvidia – while companies like Amphenol sit further down the stack. But that “picks and shovels” position is exactly what attracted me to the company. It benefits when technology expands, without needing to predict which specific applications or vendors will ultimately win.
I view Amphenol as a high-quality, quietly compounding business that benefits from the increasing complexity of modern technology. It is not driven by hype cycles, but rather tends to grow steadily as more devices, systems, and data centres require faster, more reliable ways to connect everything together.
Bought: MDA Space: MDA Space wasn’t originally on my radar, but it quickly stood out as I explored companies benefiting from the broader growth of the space economy. For more than 50 years, MDA has designed and built mission-critical space infrastructure, including satellite systems, robotics, and components used in space exploration and Earth observation. One of its most recognizable contributions is the Canadarm, the robotic system used on NASA’s Space Shuttle and the International Space Station.
A simple way to think about MDA is that it provides the “tools and infrastructure” behind modern space activity. It doesn’t launch rockets itself but instead builds many of the technologies that make space missions possible once they reach orbit. Its products support satellites, communications networks, Earth imaging systems, and robotic exploration platforms. In that sense, MDA sits further upstream in the space economy, much like infrastructure companies support the internet and cloud computing.
The long-term opportunity is tied to the rapid expansion of space-based infrastructure. Governments and private companies are deploying more satellites than ever for communications, navigation, defence, and Earth monitoring. As these networks grow in scale and complexity, demand for advanced payloads, robotics, and satellite systems grows alongside them. MDA is positioned to benefit directly by supplying the hardware and systems at the core of many of these missions.
More recently, the business has been shifting toward a higher-quality revenue mix, with greater emphasis on long-term contracts tied to satellite programs and space infrastructure projects. This transition moves the company away from purely project-based work toward more predictable, multi-year revenue streams. Supporting this, MDA currently has a backlog of approximately US$3.7 billion, providing a strong foundation for future growth and revenue visibility.
Of course, the business carries meaningful risks. Space programs are long-cycle in nature, and contract timing can be uneven, leading to volatility in quarterly results. MDA is also exposed to a concentrated group of government and large commercial customers, meaning changes in funding or procurement decisions can have a significant impact. In addition, execution risk remains a factor in complex aerospace projects where delays or cost overruns can occur.
While much of the market’s attention focuses on rocket launch providers and satellite operators, companies like MDA operate behind the scenes, building the systems those missions rely on. That “enabler of the enablers” position is what initially attracted me to the business.
More recently, a high-profile rocket failure triggered a short-term pullback across many space-related stocks, including companies with little direct connection to the event. While the market focused on the headline, I felt the long-term investment case for MDA remained unchanged. That weakness offered an opportunity to become an owner of the company at a more attractive valuation.
Overall, I view MDA as a long-term, infrastructure-like play on the growth of the global space economy. It is not a fast-moving consumer story, but rather a company positioned to benefit as space becomes an increasingly important layer of global communications, defence, and data infrastructure over the coming decades.
That’s a wrap for this week, thanks for reading – may your portfolio stay green and your dividends steady. See you next time!