
Behind the Wheel: Driving Your Portfolio
The past weekend, I was doing some light investment research on the companies on my radar list while watching the Formula 1 Canadian Grand Prix, and it got me thinking – F1 racing is a bit like investing. On the surface, it’s easy to focus on the first car to cross the finish line at incredible speed. That’s what grabs attention – the headlines, the biggest stock moves, and the sectors that seem to be leading at any given moment.
But behind every race win is a system working in sync. The engine has to be powerful, the aerodynamics precise, the tires carefully managed, the pit stop strategy well-timed, and the pit crew executing under pressure. A split-second delay anywhere in that chain can change the outcome of the entire race. Performance isn’t driven by one component – it’s the result of everything working together.
Markets function in a very similar way.
It’s tempting to focus on the most visible leaders at any given time – whether that’s a high-growth technology name like Alphabet (NASDAQ: GOOGL), a strong consumer brand like Costco (NASDAQ: COST), or a cyclical sector benefiting from the current economic backdrop like Canadian Natural Resources (TSE: CNQ). These are the “headline performers,” much like the cars everyone watches on race day. They move fast, attract attention, and often dominate short-term performance discussions.
But just like Formula 1, the story doesn’t start – or end – there.
Underneath the surface, markets are made up of multiple interconnected sectors, each playing a different role in the broader system. Technology, financials, industrials, energy, healthcare, and consumer discretionary all respond differently depending on the economy, inflation, interest rates, and investor sentiment.
And just like a race car depends on more than just its engine, market performance depends on how all of these sectors interact at the same time. Leadership rotates as conditions change, with different parts of the market stepping into favour depending on where momentum is building.
Even the best car on the track can lose ground if conditions shift – whether that’s tire degradation, a poorly timed pit stop, or changing weather. In the same way, no sector leads forever. What works in one environment can quickly become a headwind in another.
Think of how artificial intelligence (AI) drove markets over the past few years. Earlier this year, that tailwind briefly turned into a headwind as investors grew cautious around spending levels and potential disruption across industries. More recently, however, stronger earnings have helped ease those concerns, with AI-related momentum once again acting as a tailwind for markets.
But there’s one more important piece in this system – the driver.
In investing terms, that’s the individual investor. The portfolio doesn’t steer itself. Even with the same set of opportunities in front of you, outcomes can look very different depending on how you allocate capital, how risk is managed, and how patience is applied through different phases of the cycle.
Two investors can be looking at the same market, the same sectors, and even the same companies – but the results can diverge significantly based on timing, discipline, and behaviour. In that sense, the driver often matters just as much as the machine.
That’s what makes investing feel closer to Formula 1 than it first appears. It’s not just about having strong companies or being in the right sector at the right time. It’s about how everything works together – and how the driver (investor) responds as conditions change over time.
As we move into this week’s update, imagine yourself as the driver navigating the field. Geopolitical tensions, inflation, and interest rate expectations are the conditions on the track – constantly shaping how the race unfolds. Let’s take a look at how those ‘cars’ moved markets this week, and how they affected each of my cars, er, portfolios. 😊
Items that may only interest or educate me ….
Canadian Economic news, US Economic news, …
Canadian Economic news
This past week’s key economic data that the Bank of Canada (BoC) considers when deciding whether to raise or lower the interest rate.
Gross Domestic Product (GDP)
According to Statistics Canada, the Canadian economy shrank 0.1% in March after growing 0.2% in February. On a year-over-year basis, GDP rose 0.4%, slowing from February’s 0.6% pace and continuing the trend of weakening economic momentum.
Beneath the surface, much of the weakness came from goods-producing industries, which fell 0.8% during the month and are now down 1.6% over the past year. Manufacturing was the lone bright spot, rising 0.4% in March, while mining, quarrying, and oil and gas extraction posted the largest decline, falling 2.1%. Over the past year, agriculture, forestry, fishing, and hunting was the only major goods-producing sector to grow, climbing 2.1%, while manufacturing declined 2.5%.
Meanwhile, Canada’s services sector continued to show modest growth. Services activity edged up 0.1% in March, matching February’s pace, and is now up 1.3% over the past year. The arts, entertainment, and recreation industry led monthly gains with a 2.0% increase, while retail trade fell 0.6%. Over the past year, finance and insurance remained one of the stronger areas of the economy, growing 3.6%, while educational services declined 2.8%.
One of the more important takeaways from the report is the growing disconnect between economic growth and inflation. Normally, when the economy slows, inflation pressures ease more quickly, giving the BoC room to cut interest rates. Instead, inflation has remained sticky enough to complicate that picture, particularly after oil prices surged late in the quarter following the outbreak of the US-Iran war and disruptions in the Strait of Hormuz. That leaves the BoC balancing two competing risks: a weakening economy on one side and inflation that still hasn’t fully returned to target on the other.
There were at least a few encouraging signs beneath the headline numbers. Statistics Canada’s preliminary estimate for April points to a rebound of roughly 0.4%, helped by stronger manufacturing and energy activity. That suggests the economy may not be slipping into a deep recession but rather moving through a sluggish and uneven stretch where some sectors remain under pressure while others begin stabilizing.
Even with signs of short-term stabilization in April, the broader trend for Canada’s economy remains weak. First-quarter GDP came in well below expectations, with the economy essentially flat instead of posting the 1.5% growth economists had forecast. Combined with the 0.2% contraction in the fourth quarter of 2025, Canada has now gone two consecutive quarters without meaningful economic growth – what economists often refer to as a “technical recession.”
Canadian Market Volatility
Canada’s version of the market “fear gauge” is the S&P/TSX 60 VIX Index (VIXC), often shown on trading platforms as VIXI.TO. Like the better-known CBOE Volatility Index in the US, it measures expected volatility in the Canadian stock market over the next 30 days.
The VIXC opened the week at 14.41 and traded mostly between 15.50 and 14.0 for much of the week. From there, it gradually eased as geopolitical tensions began to cool. As news of a potential peace deal in the Middle East gained traction later in the week, the index slipped below 14 and finished the week at 13.21 – its lowest level since mid-January.
Overall, the move lower reflects a steady improvement in risk sentiment as easing geopolitical tensions and stable oil prices helped calm volatility in the Canadian market. As uncertainty faded, the VIXC gradually drifted lower into the end of the week. It also highlights how Canada’s more commodity and financials heavy market tends to produce smoother swings compared to the more tech-driven US indexes, where volatility can shift more sharply with changes in growth expectations.
US Economic news
This past week’s key data points that the Federal Reserve (Fed) considers when deciding whether to raise or lower the interest rate.
Consumer Confidence Index (CCI)
The Conference Board’s Consumer Confidence Index (CCI) came in at 93.1 for May, down slightly from April’s downwardly revised reading of 93.8. Still, the report topped economists’ expectations of around 92.0.
One of the more interesting details beneath the surface was the divide between how consumers feel about the economy today versus where they think things are headed. The Present Situation Index, which measures views on current business conditions and the job market, fell to 121.2 from 124.4 in April, suggesting Americans are becoming less optimistic about the economy in the near term.
Meanwhile, the Expectations Index, which looks ahead over the next six months, improved slightly to 74.4 from 72.2. While that may sound encouraging, it is still well below the 80 level historically associated with recessionary conditions or broader economic slowdowns. In simple terms, consumers are feeling less confident about the economy today, but they are not becoming dramatically more pessimistic about the future either.
The report also highlighted a widening gap between higher-income and lower-income households. Wealthier consumers have generally benefited from strong stock market performance, while many lower-income households continue to feel pressure from inflation and rising everyday costs, particularly higher gasoline prices tied to the ongoing US-Iran conflict.
It’s also worth noting that this report painted a much more stable picture than the University of Michigan’s Consumer Sentiment Index (CSI), which recently fell to a record low reading of 44.8 in May. While the CCI focuses more on business conditions and the labour market, the CSI reflects how consumers personally feel about their finances and inflation pressures.
That contrast helps explain why the two reports are telling slightly different stories right now. The CCI suggests consumers still see the labour market and broader economy as relatively stable, while the CSI shows many Americans remain deeply worried about affordability and the rising cost of living.
For us investors, both reports matter because consumer spending drives a huge part of the US economy. Together, they highlight the growing gap between what economic data says and how consumers actually feel.
Inflation and Economic Growth
Personal Consumption Expenditures (PCE)
The Bureau of Economic Analysis (BEA) reported that the Fed’s preferred measure of inflation – PCE – remained hotter than hoped in April. Headline inflation rose 3.8% year-over-year, up from 3.5% in March and marking the highest reading in roughly three years. On a monthly basis, prices increased 0.4%.
Meanwhile, Core PCE, which excludes the more volatile food and energy categories, also remained elevated. Core PCE rose 3.3% year-over-year, while the monthly core reading increased 0.2%. Although the monthly and annual figures were largely in line with expectations, the broader trend continues to show inflation running well above the Fed’s 2% target.
Much of the upward pressure continues to come from energy prices, particularly higher oil and gasoline costs tied to the ongoing US-Iran war. At the same time, price increases across essentials such as groceries, clothing, and electricity suggest inflation pressures are becoming more persistent and widespread rather than isolated to a single category.
The latest data reinforces the idea that inflation is proving more difficult to bring under control than many had hoped. That keeps pressure on the Fed and supports the idea that interest rates may need to stay higher for longer, with fewer near-term expectations for rate cuts.
In simple terms, inflation is still running too hot for the Fed to comfortably ease policy – and that remains one of the key constraints shaping markets right now.
Gross Domestic Product (GDP)
The latest US GDP report showed that the economy grew at an annualized rate of 1.6% in the first quarter of 2026, down from the initial estimate of 2.0%. This came in weaker than expected, with economists looking for a revision closer to 2.1%. However, it still marked an improvement from the fourth quarter of 2025, when growth slowed to just 0.5%.
The slowdown was largely driven by softer consumer spending and weaker inventory investment from businesses. Since consumer spending makes up the largest share of the US economy, the weaker reading suggests households became more cautious with their spending during the quarter.
At the same time, parts of the economy continued to show strength. Business investment held up surprisingly well, particularly in equipment spending, which surged more than 17%. Much of this strength continues to come from artificial intelligence (AI) infrastructure investment, including data centres and broader technology-related spending.
The overall picture is one of an economy that is still expanding but clearly losing momentum. Consumer activity is softening, inflation pressures remain elevated, and geopolitical uncertainty continues to weigh on confidence. However, strong AI-related investment is still providing an important offset, helping to keep overall growth from slowing more sharply.
Looking ahead, growth could face additional pressure in the second quarter as higher inflation linked to energy prices weighs further on consumers and squeezes real spending power.
Combined Takeaway
Looking at both reports side by side, the key takeaway isn’t just what each one says individually, but how they interact. Taken together, the latest GDP and PCE reports paint a more complicated picture of the US economy. Growth is clearly slowing, yet inflation remains stubbornly elevated. In other words, the economy is losing momentum, but inflation isn’t easing at the same pace.
Normally, weaker growth would help bring inflation down more quickly. However, higher energy prices linked to ongoing geopolitical tensions continue to add inflationary pressure. As a result, the Fed finds itself in a difficult position: growth is cooling, but inflation remains too high to justify near-term rate cuts. This reinforces the growing view that interest rates may need to stay higher for longer than markets had previously expected.
American Market Volatility
The VIX, often called the market’s “fear gauge,” measures how much volatility investors expect in the S&P 500 over the next 30 days. In simple terms, it reflects how much uncertainty is being priced into markets. The VIX tends to rise when fear increases and fall when confidence improves. Readings above 20 are often associated with elevated stress, while levels below that typically point to calmer conditions.
This past week, the VIX stayed comfortably below 20, suggesting investors remained relatively calm despite ongoing geopolitical tensions in the Middle East.
Following the Memorial Day long weekend in the US, the index opened the week at 16.93 as markets largely looked through renewed conflict between the US and Iran. From there, volatility gradually eased as tensions cooled, with the VIX slipping below 16 after reports of a 60-day ceasefire extension and progress toward a potential broader agreement. It finished the week at 15.32, reflecting a clear decline in short-term uncertainty.
Overall, the move lower in the VIX reinforced the broader theme of the week: markets were willing to look past geopolitical noise as long as conditions continued to stabilize.
Weekly Market and Portfolio Review
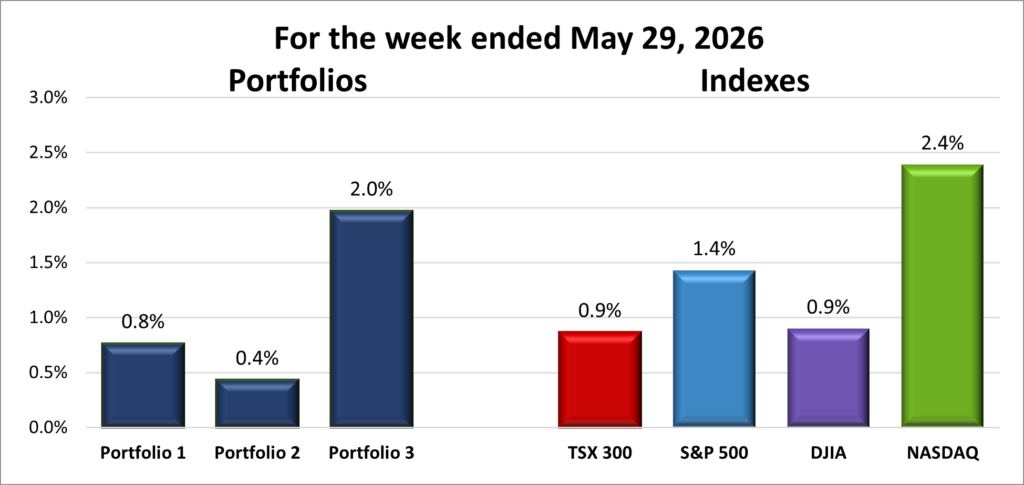
For the week, the TSX (SPTSX) rose 0.9%, the S&P 500 (SPX) climbed 1.4%, the DJIA (INDU) gained 0.9% and the Nasdaq (CCMP) surged 2.4%.
| Index | Weekly Streak |
| TSX: | 2 – week winning streak |
| S&P: | 9 – week winning streak |
| DJIA: | 2 – week winning streak |
| Nasdaq: | 2 – week winning streak |
 Markets wrapped up the week on a strong note, with all four major indices extending recent gains despite lingering inflation concerns and ongoing geopolitical uncertainty in the Middle East, where oil prices remained elevated for much of the week.
While Americans celebrated Memorial Day, the Toronto Stock Exchange Composite Index (TSX) started the week by setting a record high before pulling back as oil prices softened. Despite that mid-week volatility, the index still finished the week higher overall.
In the US, momentum during the shortened week was even stronger. The Nasdaq Composite Index (Nasdaq) and S&P 500 Index (S&P) both extended their winning streaks to seven straight sessions, with each posting record high closes every day this week. The S&P also notched its ninth consecutive weekly gain, its longest streak since 2023. The Dow Jones Industrial Average (DJIA) briefly broke its winning streak early in the week but quickly recovered, ending with three straight record high closes of its own. In other words, the broader trend remained firmly upward across US markets.
As earnings season wound down, investor attention shifted back toward geopolitics. Markets reacted positively to reports of a tentative ceasefire between the US and Iran. As tensions eased, oil prices pulled back from recent highs, with Brent crude slipping below US$93 per barrel.
That move mattered more than it might seem at first glance. Lower oil prices helped cool inflation expectations and supported a shift back into riskier stocks, particularly technology and AI-related companies.
That AI narrative remained one of the strongest drivers of the rally. Several major technology companies delivered solid earnings and upbeat guidance, reinforcing confidence that demand for AI services and infrastructure is still accelerating. For example, Dell (NYSE: DELL) saw its share price surge as much as 40% after reporting earnings that easily beat expectations. The company also provided strong guidance, highlighting how the rapid expansion of AI-focused data centres continues driving demand for its high-powered servers. That helped reinforce investor confidence that AI spending is still one of the market’s strongest growth trends. As long as investors continue seeing strong growth tied to AI investment, the sector is likely to remain one of the market’s leadership groups.
Still, the week wasn’t one-way traffic.
Economic data later in the week painted a more complicated picture. The US economy came in weaker than expected in the first quarter, driven largely by softer consumer spending. At the same time, the Fed’s preferred inflation gauge – the PCE index – showed inflation remains sticky, partly reflecting the impact of higher oil prices earlier in the quarter following the Iran conflict.
Normally, slower growth would help ease inflation pressures and open the door wider for interest rate cuts. Instead, investors were left with a trickier mix: economic growth is cooling, but inflation isn’t easing at the same pace. That dynamic reinforced the “higher for longer” interest rate narrative hanging over markets.
Back in Canada, the TSX’s early-week record high marked its first since March, near the beginning of the Iran conflict, before the index briefly pulled back alongside oil prices. As energy markets stabilized, the TSX gradually recovered to extend its weekly winning streak to two.
The pullback in oil prices created a mixed backdrop for Canadian energy producers – weaker short-term prices on one hand, but improved inflation expectations and broader market stability on the other.
Financials helped balance things out. Strong earnings from Canada’s major banks provided stability and offset some of the volatility coming from the energy sector, once again highlighting how important financials are to the TSX’s overall direction.
Taken together, markets were supported by easing geopolitical tensions, resilient corporate earnings, and renewed strength in AI-related companies. That combination outweighed concerns around slower growth and sticky inflation, allowing stocks to push to new highs.
Even so, the bigger picture hasn’t really changed. Markets are still navigating a delicate balance between cooling growth and persistent inflation – a dynamic that will likely continue to influence the markets.
| Portfolio | Weekly Streak |
| Portfolio 1: | 4 – week winning streak |
| Portfolio 2: | 9 – week winning streak |
| Portfolio 3: | 4 – week winning streak |
With US markets pushing to record highs and AI stocks leading the charge, I was expecting a stellar week for my three portfolios. Alas, it was not to be. It certainly wasn’t a bad week – all three portfolios finished higher – but the gains fell a little short of my expectations. 😊
One of the biggest surprises was Nvidia (NASDAQ: NVDA), which fell 4% despite the AI rally. As a major holding in both Portfolios 1 and 2, that decline created a noticeable headwind. Falling oil prices also weighed on results, particularly in the energy heavy Portfolio 2.
Portfolio 1 delivered a respectable 1.2% gain, although I had expected a bit more from the technology-heavy portfolio given the strength in the Nasdaq. Still, 57% of holdings finished the week higher. Shopify (TSX: SHOP) led the way with a 15% gain, followed by Cloudflare (NYSE: NET) and Celsius Holdings (NASDAQ: CELH), which both climbed more than 10%. Datadog (NASDAQ: DDOG) and CrowdStrike (NASDAQ: CRWD) each gained 11% while setting new record highs. TD Bank (TSX: TD), Bank of Nova Scotia (TSX: BNS), and Lattice Semiconductor (NASDAQ: LSCC) also reached new highs during the week. Offsetting some of those gains were Nvidia’s 4% decline and a 15% drop in Navitas Semiconductor (NASDAQ: NVTS).
Portfolio 2 posted 1.2% gain, which was a bit surprising given that only 37% of holdings finished the week higher. Bank of Nova Scotia and Aritzia (TSX: ATZ) both reached new highs, while Birkenstock (NYSE: BIRK) jumped 15%. However, weakness across the energy sector proved difficult to overcome, with all five energy holdings ending the week lower.
Portfolio 3 was the standout performer, gaining 2.8% for the week, outperforming all of the indexes. Despite Nvidia’s decline, the portfolio benefited from broad gains, with 76% of holdings advancing. Shopify and Cloudflare once again led the way with gains of 15% and 13%, respectively. The portfolio also saw 5N Plus (TSX: VNP) reach multiple new highs, while the TD U.S. Equity Index ETF (TSX: TPU) continued its climb to record highs.
This week was a reminder not to count my chickens before they hatch. I got caught up in the record highs the major indexes were hitting almost daily thanks to the AI rally and forgot that individual portfolios don’t always move in lockstep with the broader market. Even so, all three portfolios finished the week higher, which is never something to complain about. 😊
Companies on the Radar
 No new companies were added to my radar this week, but I did trim the list by removing Coherent Corp. (NYSE: COHR) after it scored the lowest (45%) on my Quick Test.
That leaves five companies I’m still watching closely, all of which remain interesting in different ways. Amphenol Corporation (NYSE: APH) and TerraVest Industries (TSE: TVK) stand out as the only two that look fairly valued or slightly undervalued based on Morningstar’s estimates. The other three are more expensive relative to their earnings right now, likely driven by continued momentum from the AI-driven rally.
I’ll keep digging into all five. At this stage, a lot of the opportunity may simply come down to patience – waiting for either a broader market pullback or a company-specific dip that creates a better entry point.
For now, all five of these holdovers from the previous week remain on my radar:
- Amphenol: A large-cap US interconnect company that designs and manufactures connectors, cables, and fibre systems used across AI data centres, telecom networks, automotive, and industrial applications. It focuses on the physical connectivity layer that links everything together and enables high-speed data and power transfer.
- Fabrinet (NYSE: FN): A US large-cap precision manufacturing company that builds complex optical and electronic components for leading networking and photonics firms. It focuses on contract manufacturing rather than design, producing high-end optical modules and subsystems used in AI and telecom infrastructure.
- TerraVest Industries: A mid-cap Canadian industrial company that produces equipment for energy, storage, and transportation markets, including propane tanks, pressure vessels, and heating systems. It grows through a mix of organic expansion and acquisitions, serving steady, asset-heavy industrial niches across North America.
- Lumentum Holdings (NASDAQ: LITE): A US large-cap optical networking company that designs and sells photonics components such as lasers and transceivers used in AI data centres and telecom networks. It sits in the middle of the value chain, turning optical technology into finished components that move data between systems.
- Corning (NYSE: GLW): A large-cap US company best known for specialty glass and fibre-optic products used in data centres, telecom networks, smartphones, and vehicles. It benefits from long-term demand for AI and cloud infrastructure, driven by massive fibre buildouts needed to move data efficiently.
Corning builds the fibre, Lumentum designs the optics, Fabrinet manufactures them, and Amphenol connects everything together.
As always, these are not buy recommendations. Make sure to do your own research and choose investments that fit your personal financial goals.
The Radar Check was last updated May 29, 2026.


That’s a wrap for this week, thanks for reading – may your portfolio stay green and your dividends steady. See you next time!