
Monthly Market and Portfolio Review
| Indexes | Monthly Streak |
| TSX: | 3 – month winning streak |
| S&P: | 1 – month losing streak |
| DJIA: | 3 – month winning streak |
| Nasdaq: | 1 – month losing streak |

 June was a month where markets reacted to a chain of events rather than a single headline. Geopolitical tensions, higher oil prices, renewed inflation concerns, and shifting interest rate expectations all combined to change investor preferences. The result was a shift in market leadership: the Dow Jones Industrial Average (DJIA) extended its monthly winning streak, while the S&P 500 (S&P) and Nasdaq Composite Index (Nasdaq) pulled back as investors favoured more stable companies over higher-growth areas of the market.
The first major driver was the resumption of conflict between the US and Iran, which sent oil prices sharply higher. While that benefited energy producers, it also increased costs across the economy. More expensive fuel affects everything from transportation and manufacturing to household expenses, bringing inflation concerns back into focus after months of improvement.
That renewed inflation uncertainty quickly changed the outlook for interest rates. If inflation remains stubbornly high, the Federal Reserve (Fed) has less room to lower rates, meaning borrowing costs may need to stay elevated for longer. This would create a more challenging environment for stocks, particularly companies valued on future growth.
Higher interest rates tend to have the greatest impact on growth stocks because much of their value comes from earnings expected years into the future. This created a difficult backdrop for the artificial intelligence (AI) and semiconductor sectors, which had been among the market’s strongest performers earlier in the year. As investors took profits and questioned how quickly massive AI investments would translate into earnings, several AI-related leaders pulled back, weighing on the Nasdaq.
Meanwhile, the DJIA benefited from its different makeup. The index has greater exposure to established, profitable companies in sectors such as industrials, financials, and energy, which tend to be less sensitive to higher interest rates. In a month where investors favoured stability over aggressive growth, that mix helped the DJIA gain 2.5% and outperform the broader market.
In Canada, the TSX benefited from a similar preference for established companies, but for different reasons. The index has much greater exposure to energy, financials, and basic materials companies involved in commodities such as gold and metals than the major US indexes, giving it a distinct set of drivers. Higher energy prices supported Canadian producers, while the country’s large banks continued to provide stability through their steady earnings and dividend payments.
The TSX was not immune to market uncertainty, but its heavier exposure to these sectors helped it avoid the larger pullback seen in technology-focused indexes. While the Nasdaq and S&P struggled as investors reassessed AI-related stocks, the TSX continued to grind higher, extending its monthly winning streak.
Despite the uncertainty, investors remained relatively confident in the strength of the economy and corporate earnings. That confidence helped limit the broader market impact and kept the focus on selective opportunities rather than a broad market sell-off.
Overall, June was a reminder that market leadership can change quickly. The month showed how developments such as a spike in oil prices can ripple through the economy by affecting inflation, interest rates, and ultimately which types of companies investors favour. It also highlighted the importance of diversification: different markets and sectors do not always move in the same direction, and the companies that lead one period may not be the same ones that lead the next.
| Portfolio | Monthly Streak | |
| Portfolio 1: | 3 – month winning streak | |
| Portfolio 2: | 3 – month winning streak | |
| Portfolio 3: | 3 – month winning streak |
After an impressive May, when all three portfolios gained at least 6%, June proved to be a tougher month to navigate. The portfolios extended their monthly winning streaks, but the path was far from smooth. Two strong weeks in the middle of the month were surrounded by declines at the beginning and end, as changing expectations around inflation, interest rates, and AI valuations created volatility across the markets.
AI-related stocks were a major focus throughout the month. After driving much of the market’s gains earlier in the year, some of the biggest technology companies faced renewed scrutiny as investors questioned whether massive AI investments would translate into earnings quickly enough to justify elevated valuations. Microsoft (NASDAQ: MSFT) was one of the notable casualties, falling more than 19% in June, its worst monthly performance since December 2000, as investors reassessed how the company would compete in an increasingly AI-driven world.
Despite the challenging environment, each portfolio managed to finish the month higher, although the results varied significantly based on their different holdings and sector exposure.
Portfolio 1 finished June essentially unchanged, squeaking out a gain of 0.04%. As I often say, “A tiny gain is better than any loss.” 😊 Early strength in several growth holdings faded as AI-related stocks pulled back, but gains from Nvidia (NASDAQ: NVDA), Canadian banks, and Hammond Power Solutions (TSE: HPS.A) helped offset weakness in semiconductor and other technology names.
Portfolio 2 was the standout performer in June, gaining 4.9% and outperforming both the other portfolios and all major indexes. Its broader mix of financials, consumer companies, energy, and technology holdings helped it navigate the volatility affecting AI-related stocks. Strong performances from Bank of Nova Scotia (TSE: BNS), Aritzia(TSE: ATZ), Birkenstock (NYSE: BIRK), and Hammond Power Solutions, helped offset weakness elsewhere. June highlighted the benefit of diversification, as strength across multiple sectors helped Portfolio 2 deliver a strong result in a challenging market environment.
Portfolio 3 finished June with a 0.7% gain, overcoming a difficult start to end the month in positive territory. Technology and growth holdings drove much of the volatility, with Nvidia, Microsoft, Broadcom (NASDAQ: AVGO), and Rocket Lab (NASDAQ: RKLB) weighing on results at different points. However, gains from Canada’s two largest banks – Royal Bank (TSE: RY) and TD Bank (TSE: TD) – as well as Vertiv Holdings (NYSE: VRT), and Corning (NYSE: GLW) helped offset the weakness. June highlighted both the potential rewards and risks of a growth-focused portfolio.
Overall, June was an interesting month for the portfolios. The same market forces affected all three, but the results were very different depending on the companies they held. The two technology-focused portfolios experienced more volatility, while the more balanced Portfolio 2 benefited from its mix of financials, energy, consumer companies, and technology holdings. In the end, all three portfolios managed to finish the month higher, which is always a welcome result. 😊
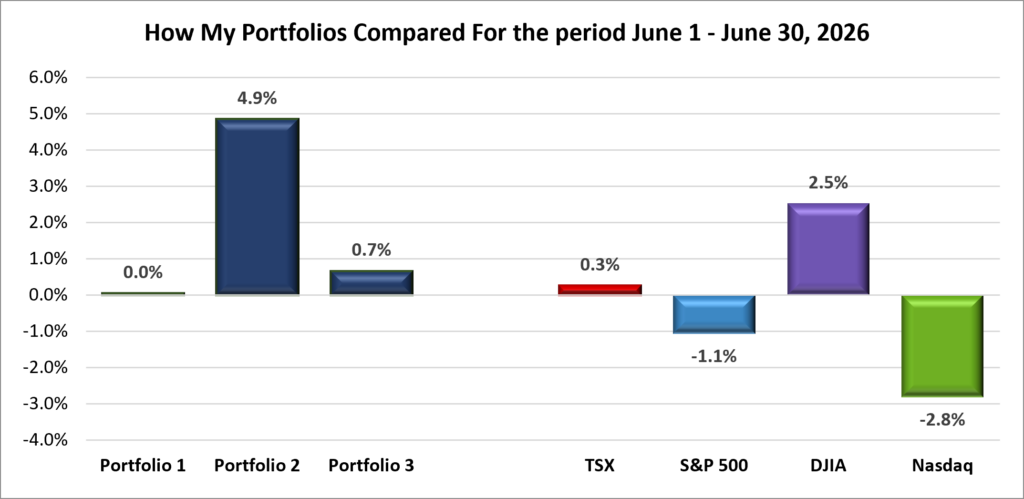
A comparison of the monthly returns of my three portfolios and the major market indexes.
Second Quarter
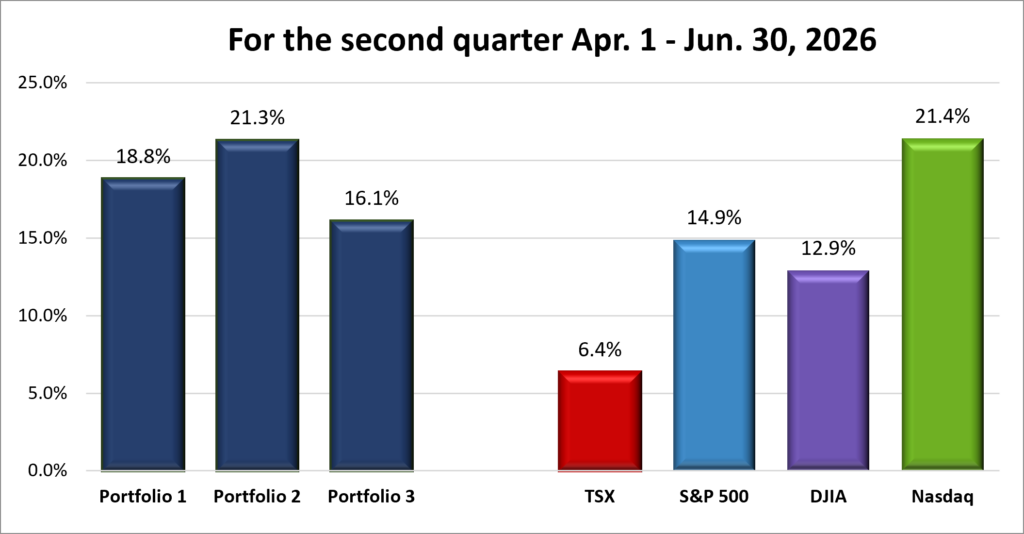
A comparison of the quarterly returns of my three portfolios and the major market indexes.
After a challenging first quarter that saw each of the major US indexes fall by at least 4%, the second quarter delivered an impressive comeback. The Nasdaq led the way with a 21.4% gain, while the S&P and DJIA weren’t far behind, rising 14.9% and 12.9%, respectively. For both the S&P and Nasdaq, it was their strongest quarterly performance since 2020, while the DJIA posted its biggest quarterly gain since 2022.
The TSX couldn’t quite keep pace with its US counterparts, but a 6.4% gain was still a solid result. Even more impressive, it marked the index’s eighth consecutive quarterly advance – its longest winning streak since 1996.
My three portfolios also staged a strong recovery after a difficult start to the year, with all three posting double-digit gains. Portfolio 2 led the way, surging 21.3% after falling 6.3% in the first quarter. Portfolio 1 rebounded from a 4.3% decline with an 18.8% gain, while Portfolio 3 rose 16.1% after losing 8.5% in the previous quarter.
By quarter’s end, all three portfolios had outperformed every major index except the Nasdaq and more than doubled the TSX’s gain. It was a welcome reminder that one difficult quarter doesn’t define a year. Hopefully the second quarter’s momentum carries into the second half of 2026. 😊
Year To Date
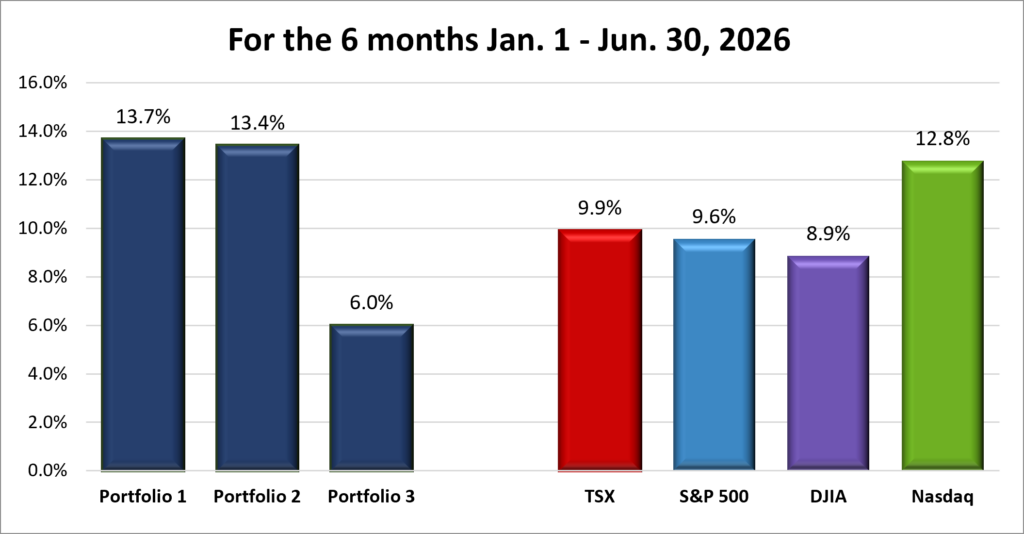
A comparison of the year-to-date returns of my three portfolios and the major market indexes
Despite a rough start to the year, the major indexes have staged an impressive recovery through the first half of 2026. The DJIA finished June on a high note, recording back-to-back record closes on the final two trading days of the first half and lifting its year-to-date gain to 8.9%. The TSX also continued its steady climb, ending the first half up 9.9% and outperforming both the S&P and DJIA for the year.
The picture was a little different for the S&P and the technology-heavy Nasdaq. After driving much of the market’s rebound earlier in the year, both gave back some of their gains in June as AI-related stocks pulled back. Even so, the Nasdaq remained the year’s top-performing major index, up 12.8%, followed by the TSX (9.9%), the S&P (9.6%), and the DJIA (8.9%). While the DJIA still ranked fourth, perhaps the biggest surprise was its momentum. Its year-to-date gain has nearly tripled since the end of May, highlighting how leadership broadened beyond technology stocks.
The mixed performance across the indexes was also reflected in my portfolios. Portfolio 1 remains the top performer with a year-to-date gain of 13.7%, while Portfolio 2’s strong June narrowed the gap considerably, lifting it to 13.4%. Portfolio 3 continues to trail with a year-to-date gain of 6.0%.
The standout result is that Portfolios 1 and 2 are now outperforming every major index, including the market-leading Nasdaq. Portfolio 3 still trails the major indexes, but with half the year remaining, there’s plenty of time for the standings to change. 😊
What My Three Portfolios Did in June 2026
Portfolio 1 for June 2026: UP 
Activity
No significant activity to report this month.
Dividends Received this month:
Companies followed by DRIP (Dividend Re-Investment Plan) indicate additional shares were purchased with the dividend. Any cash leftover was added to the cash balance.
Canadian $
TMX Group (TSE: X) DRIP
Dream Industrial Real Estate Investment Trust (TSE: DIR.UN) DRIP
Hammond Power Solutions (TSE: HPS.A)
Yellow Pages (TSE: Y)
Decisive Dividends (TSE: DE) DRIP
CN Rail (TSE: CNR)
Tourmaline Oil (TSE: TOU)
US $
Visa (NYSE: V)
Carnival Corp (NYSE: CCL)
Interactive Brokers (NASDAQ: IBKR)
BSR Real Estate Investment Trust (TSE: HOM.U)
Alphabet (NASDAQ: GOOGL)
Home Depot (NYSE: HD)
Nvidia (NASDAQ: NVDA)
Quarterly Reports
CrowdStrike Holdings, Inc.
First quarter 2027 financial results on June 3, 2026
Carnival Corporation
Second quarter 2026 financial results on June 23, 2026
Portfolio 2 for June 2026: UP
Activity
No significant activity to report this month.
Bought: Whitecap Resources (TSE: WCP) Please see June 12 Weekly Update.
Dividends Received this month:
Canadian $
Fortis (TSE: FTS)
Dream Industrial Real Estate Investment Trust (TSE: DIR.UN) DRIP
Whitecap Resources (TSE: WCP)
SmartCentres Real Estate Investment Trust (TSE: SRU.UN)
Dream Industrial Real Estate Investment Trust (TSE: DIR.UN) DRIP
Hammond Power Solutions (TSE: HPS.A)
Supremex (TSE: SXP) DRIP
iA Financial Corp (TSE: IAG)
Brookfield Infrastructure Corp (TSE: BIPC)
Tourmaline Oil (TSE: TOU)
US $
Zoetis (NYSE: ZTS)
Microsoft (NASDAQ: MSFT)
Quarterly Reports
Dollarama Inc.
First quarter 2027 financial results on June 11, 2026
Alimentation Couche-Tard Inc.
Fourth quarter 2026 financial results on June 22, 2026
Portfolio 3 for June 2026: UP
Activity
Sold: Lithium Americas (TSE: LAC) Please see June 5 Weekly Update.
Bought: Corning (NYSE: GLW) Please see June 5 Weekly Update.
Bought: Amphenol Corporation (NYSE: APH) Please see June 5 Weekly Update.
Bought: MDA Space (TSE: MDA) Please see June 5 Weekly Update.
Dividends Received this month:
Canadian $
SmartCentres Real Estate Investment Trust (TSE: SRU.UN) DRIP
Rockpoint Gas Storage Inc (TSE: RGSI)
Brookfield Corp (TSE: BN)
Brookfield Asset Management (TSE: BAM)
Brookfield Wealth Solutions (TSE: BNT)
Canada Packers (TSE: CPKR)
Brookfield Renewables Corp. (TSE: BEPC)
US $
Microsoft (NASDAQ: MSFT)
Vertiv Holdings (NYSE: VRT)
Nvidia (NASDAQ: NVDA)
Broadcom (NASDAQ: AVGO)
Quarterly Reports
Broadcom Inc.
Second quarter 2026 financial results on June 3, 2026