Third Quarter Market Recap: Navigating Volatility and Tech-Driven Rallies
The third quarter of 2024 was anything but boring, with markets experiencing both soaring highs and sharp drops. Investors on both sides of the border navigated lower interest rates, slowing inflation, mixed economic data, strong earnings reports, and global stimulus efforts—all fueling heightened volatility, particularly in the US.
At one point, markets tumbled 8.5%, flirting with correction territory (a correction occurs when an index or stock drops 10% or more from its recent peak). However, the storm passed quickly, and markets regained their footing, finishing the quarter on a high note. All four major indexes moved higher by the end of September, with the S&P 500 (S&P) and Nasdaq Composite Index (Nasdaq) logging their fourth straight quarter of gains, even hitting new all-time highs. Leading the charge was the Dow Jones Industrial Average (DJIA), which surged 8.2% and set multiple records. The roller-coaster ride sent the volatility index (VIX) to its highest level since 2020, adding some extra drama to the quarter.
In Canada, the Toronto Stock Exchange Composite Index (TSX) mirrored this strength, setting record-high closings three times, bolstered by rising commodity prices and sustained positive sentiment in the Canadian market.
In the end, the third quarter turned out to be a strong one for the markets, leaving investors with plenty of optimism as we head into what could be an equally unpredictable final quarter of the year. Let’s dive into the key highlights of the third quarter of 2024 and see how the portfolios performed.
For the third quarter, the TSX (SPTSX) jumped 9.7%, the S&P (SPX) grew by 5.5%, the DJIA (INDU) surged 8.2% while the Nasdaq (CCMP) advanced 2.6%.
The third quarter of 2024 took investors on a wild ride, with sharp ups and downs before ending on a high note. As the quarterly progress chart shows, the TSX claimed the top spot, while the DJIA led the American indexes.
The quarter began with a slowdown in the AI-driven rally, as investors shifted focus to other sectors and smaller companies poised to benefit from expected rate cuts. Then came August, a turbulent month that rattled markets. The S&P plunged 8.5%, and the TSX fell 7.2%, spooked by recession fears, lacklustre US job growth (only 114,000 jobs added), and sharp declines in tech heavyweights like Nvidia (NASD: NVDA) and Apple (NASD: AAPL). A global sell-off added fuel to the fire, with Japan’s Nikkei suffering its steepest one-day drop since 1987 after the Bank of Japan unexpectedly raised rates, triggering global market jitters. Investor nerves were further frayed by the US Federal Reserve (Fed) delaying its much-anticipated rate cuts.
But just as quickly as markets dipped, they rebounded. Strong US economic data, cooling inflation, and hints of rate cuts from the Fed renewed optimism. September delivered a surprise twist, defying its usual tendency to decline. All four major indexes finished in the green, posting record highs, buoyed by the Fed’s bold 0.5% rate cut, and a significant Chinese stimulus package aimed at jumpstarting the world’s second-largest economy.
By quarter’s end, the markets had logged solid gains. The DJIA had its best quarter since 2021, while the TSX enjoyed its strongest performance since 2020. Falling rates, easing inflation, strong corporate earnings, and rising commodity prices reignited investor confidence across North America.
Key Market Drivers
Several factors powered this dynamic and ultimately positive quarter. Softer inflation, supported by weaker employment data, initially brought relief to investors concerned about rising prices. This set the stage for the Fed’s bold 0.5% rate cut aimed at boosting market confidence. However, the sizeable cut raised concerns that the economy might be weaker than anticipated. These fears were eased in September when a hiring rebound helped dispel recession worries.
Corporate earnings also played a crucial role, with 75% of S&P companies beating expectations, providing additional fuel for the rally. Globally, China’s largest stimulus package since 2015 delivered a significant economic boost, lifting equity markets worldwide.
While volatility spiked early in the quarter due to economic uncertainty, it gradually subsided. The combination of lower rates, cooling inflation, and global stimulus efforts helped markets stabilize and close the quarter on a high note.
The Canadian Story
After a sluggish second quarter, the TSX came roaring back with an impressive 9.7% gain—the best in four years. The Bank of Canada took a more supportive stance, cutting rates twice by 0.25% each, bringing its benchmark rate down to 4.25%. These cuts helped cool inflation and refocused efforts on economic growth, boosting investor confidence and easing borrowing costs.
Commodities played a starring role, with steady oil prices and rallies in gold and base metals driven by global conditions and geopolitical tensions. Rising oil prices, in particular, provided a significant tailwind for Canadian energy stocks.
The TSX’s impressive performance also reflected broader global market rebounds. As economies worldwide showed signs of recovery, Canadian equities benefited from renewed investor optimism. Adding to the momentum, the Fed’s rate cuts in the US further bolstered confidence, sparking a powerful rally north of the border.
Third Quarter 2024 (July 1 – September 30) Portfolio & Index performance
The line chart below highlights how each portfolio performed throughout the third quarter of 2024, capturing their overall progress. Following this, you will find a detailed summary of each portfolio’s journey, paired with a bar chart displaying their individual monthly performance.
Third Quarter 2024 (July 1 – September 30) Portfolio progress
Portfolio 1 for the third quarter: DOWN
Portfolio 1: Third Quarter 2024 Performance
Portfolio 1 experienced a true rollercoaster in the third quarter, starting with two losing months before staging a September comeback. A rotation away from heavyweight technology companies—long the portfolio’s backbone—hurt performance as investors gravitated toward other sectors and small-cap stocks. July was particularly rough, with a 40% drop in CrowdStrike (NASD: CRWD) after their flawed software update caused a global IT shutdown. ☹
August did not offer much relief. Nvidia, a key holding, faced volatility, dragging the portfolio lower despite a mid-month rally. A sharp 7% dip in Nvidia’s stock during the final week erased earlier gains, leaving the portfolio in the red.
Thankfully, September brought a much needed rebound. The month began with a 7.1% dip but recovered steadily with weekly gains, led by Nvidia’s turnaround. By month’s end, Nvidia helped push the portfolio back into positive territory for September, even though other holdings continued to lag.
Despite the September rally, the portfolio ended the third quarter in the red, with tech stocks driving both the losses and the late recovery. On the bright side, I made strides in streamlining the portfolio, trimming two holdings to make it more manageable going forward.
Activity:
Bought: Kelly Partners Group Holdings
Bought additional share in: Costco Wholesale, CrowdStrike Holdings, Inc.
Portfolio 2 had a great third quarter, proving to be a steady performer throughout the third quarter, highlighting the strength of its diversified approach. July set the tone as it emerged as the top performer among the three portfolios, with consistent weekly gains driven by standout performances from Microsoft (NASD: MSFT) and MongoDB (NASD: MDB). A five-week winning streak was fueled by broad-based gains across most holdings.
August continued the momentum, with Portfolio 2 defying a challenging market to deliver a monthly gain. Despite declines in two of the four weeks, strong performances during the other weeks offset the losses, helping it outperform both the other portfolios and all four major indexes. Its
balanced strategy paid off, keeping volatility in check while capitalizing on key opportunities.
September brought more turbulence, but Portfolio 2 navigated it well. Gains in the second and third weeks offset early and late losses, with Hammond Power Solutions (TSE: HPS.A) adding a touch of drama as its share price swung sharply during the first three weeks.
In a quarter marked by market volatility, Portfolio 2’s diversification and balance helped it remain resilient and deliver a strong showing. 😊
Portfolio 3 held its ground well during the third quarter, staying just behind Portfolio 2 in overall performance. July started off rocky, with early gains quickly offset by back-to-back weekly losses. However, the portfolio showed resilience, with most holdings posting positive returns and resulting in a small gain for the month.
August continued the winning ways, with the portfolio achieving gains in three out of four weeks. Several holdings stood out, with a few delivering impressive returns of over 10%. But it was the steady performance of the majority of stocks that helped propel the portfolio forward, demonstrating its overall strength.
September, however, was the real highlight. Portfolio 3 emerged as the strongest performer, not just among my portfolios but across all indexes. While the first week started with a dip, it quickly turned the tide, posting steady weekly gains for the rest of the month. Lithium Americas (TSE: LAC) and its Argentina counterpart (TSE: LAAC) were standout contributors, with wild fluctuations that ultimately added to the portfolio’s success.
By the end of the third quarter, Portfolio 3 highlighted its strength, closing the quarter on a high note and demonstrating the power of a diverse mix of holdings.
They say a picture is worth a thousand words, but when it comes to market trends, a well-crafted graph can be worth even more. Instead of revisiting what has already been covered, I will let the visuals do the talking. The graphs below capture the journey of each index and portfolio, painting a vivid picture of how the markets evolved over the first nine months of 2024.
The first chart displays the rollercoaster ride of the major indexes, each surging to impressive gains by the end of the third quarter. Leading the charge, the Nasdaq (CCMP) soared 21.2%, with the S&P (SPX) hot on its heels, up 20.8%. The TSX (SPTSX) was the real comeback story, leaping from a modest 4.4% gain at the end of the second quarter to an impressive 14.5% year-to-date by the close of the third quarter. Even the DJIA (INDU), though trailing its peers, held its ground with a solid 12.3% gain over the period.
Up next is a line chart that tracks how the three portfolios have grown month by month over the first nine months of the year, displaying their percentage gains along the way.
First 9 months of 2024 Portfolio progress
Here is the final chart, highlighting how the three portfolios stacked up against the four major North American indexes after the first nine months of 2024. Portfolio 1 didn’t just lead the portfolios – it nearly doubled the performance of the Nasdaq, the best-performing index. 😊
First 9 months of 2024 Portfolio & Index performance
With September’s impressive performance setting a positive tone, there is plenty to be optimistic about as we enter the final quarter of 2024. Historically, the S&P has closed higher 79% of the time in the fourth quarter, with an average gain of 5.1%—a trend that fuels confidence for a strong year-end rally.
That said, the fourth quarter will not be without its hurdles. Major events loom large, including the US presidential election, central bank rate decisions in both the US and Canada, and third-quarter earnings, with Nvidia taking center stage as the bellwether of the artificial intelligence (AI) rally. Commodities, which soared in the third quarter, may experience a pullback as investors lock in gains. On the inflation front, Canada is expected to hit its 2% target by year-end, while the US may reach that goal next year, as higher interest rates continue to work their way through the economy. South of the border, a ‘soft landing’ appears within reach, with inflation easing without a significant economic slowdown. In Canada, however, the outlook is more cautious, with concerns lingering over consumer confidence, financial vulnerabilities, and ongoing affordability challenges.
As interest rates decline and the AI rally slows, investors may continue shifting away from big, well-known tech companies whose stock prices have soared during their extended winning streak. Instead, they are likely to gravitate toward value stocks—those considered bargains based on their earnings—and smaller companies, often referred to as ‘small caps.’ Defined as having a market cap of less than $2 billion, small caps are well-positioned to thrive in a strengthening economy. They typically benefit from increased demand, cheaper borrowing, adaptability to improving conditions, and significant growth potential. This rotation highlights a broader push for diversification and fresh opportunities as inflation cools and borrowing costs decline.
With a strong finish to the third quarter boosting confidence, the stage is set for a potentially strong close to the year—and even a promising start to 2025. Hopefully, the markets play along and deliver another stellar the fourth quarter. 😊 Fingers crossed for a strong close to 2024! 😊
Last week, I touched on why October has a bit of a reputation as a volatile month in the markets—historical crashes, rapid recoveries, and plenty of unpredictability. So, what should you expect for your portfolio this October? Let us take a look.
First off, volatility does not necessarily mean disaster. In fact, it can create opportunities, especially for long-term investors. If you see sharp drops in certain stocks or sectors, it could be a chance to add to your positions or get into new ones at discounted prices. But timing the market is tricky—so keep your long-term goals in mind (you have set some long-term goals, right?) rather than reacting emotionally to short-term swings.
One reason October can be choppy is because it is a transitional period. Third quarter earnings season begins, and companies report their third quarter results, which can send share prices soaring or sinking based on whether they beat or miss expectations. Couple that with the market’s usual jitters over interest rates, inflation, and economic outlooks, and you have the perfect recipe for some turbulence.
But here is the key takeaway: volatility is part of the game. For us investors, October is not a time to panic—it is a time to stay focused on our strategies. If you have done your homework and have solid investments, market dips can be short-lived bumps in the road.
An effective way to navigate this volatility is by sticking to strategies like dollar-cost averaging or rebalancing your portfolio. If you have already got your radar list of potential opportunities (like I do 😉), you can keep an eye on them for any sharp price drops that you can take advantage of (that buy low theory 😊). And remember, diversification is your best friend when the market gets shaky.
At the end of the day, October volatility does not change the fundamentals of a sound investment strategy. Use it to your advantage—whether that means sitting tight or making some moves—but stay disciplined and think long term. When the dust settles, those who stayed the course will likely come out on top. 💪📈
So, while October can bring its fair share of market ups and downs, stay focused on your strategy and long-term goals. Now, let’s see what happened this past week….
Items that may only interest or educate me ….
Canadian Economic news, US Economic news, The Potential breakup of google, ….
Canadian Economic news
This past week’s key economic data that the Bank of Canada (BoC) considers when deciding whether to raise or lower the interest rate.
Labour Force Survey (LFS)
Statistics Canada’s Labour Force Survey for September surprised to the upside, with the economy adding 46,700 jobs—more than double August’s 22,100 increase and marking a strong rebound after four months of stagnation. Analysts had predicted 27,000 new jobs, so this data came as a pleasant surprise. On an annual basis, employment grew by 1.5%.
In a further positive sign, the unemployment rate dipped for the first time since January, falling to 6.5% from August’s 6.6%, beating expectations of it rising to 6.7%. However, compared to September 2023, unemployment is still up by 0.9%. Interestingly, despite the drop in unemployment, the employment rate ticked down slightly from 60.8% in August to 60.7%, likely due to the rapidly growing population.
Wage growth also showed signs of cooling, with average hourly earnings rising by 4.6% compared to September 2023, down from 5.0% in August.
This latest data contradicts the narrative many analysts were expecting—a cooling job market paired with rising unemployment. Now, the key question for the BoC and investors is whether these stronger jobs numbers and falling unemployment are an anomaly or a sign the Canadian economy is turning a corner. Given the volatility of monthly labour reports, a few more months of consistent improvement will be needed to draw any firm conclusions.
Despite this stronger-than-expected report, many analysts still expect the BoC to continue cutting rates, with opinions split between a 0.25% and 0.5% reduction, although this latest data weakens the case for a 0.5% cut. One way or another, all eyes are on October 23 for the BoC’s next move.
Canadian market volatility
Canada’s Volatility Index (CVIX) started the week at 11.34 and held relatively steady as it gradually drifted lower to close at 10.21. While Friday’s stronger-than-expected jobs report caused a brief bump, the CVIX had resumed its downward trend by the end of the day. This week’s slight dip shows that market sentiment remains steady, even with some positive economic surprises.
Tracked under the ticker VIXI on the Toronto Stock Exchange (TSE), the CVIX gauges anticipated market volatility. A reading below 10 suggests calm and stable market conditions, while values between 10 and 20 indicate moderate volatility with typical market fluctuations. When the index climbs above 20, it signals heightened uncertainty and the likelihood of more turbulent market conditions.
US Economic news
This past week’s key data points that the Federal Reserve (Fed) considers when deciding whether to raise or lower the interest rate.
Federal Open Market Committee (FOMC) minutes
The minutes from the September 17–18, 2024, FOMC meeting were released this past week, offering a closer look into the Fed’s thinking, outlook, and plans. Members acknowledged that the economy continued to grow at a solid pace, despite slowing job gains and a slight increase in unemployment, which remains relatively low. They also touched on the brief market volatility in early August, driven by speculative trades unwinding after statements from the Bank of Japan and weaker-than-expected July employment data. However, they noted that markets quickly bounced back. Additionally, many foreign central banks have already begun cutting their benchmark rates.
Domestically, economic activity showed signs of resilience. GDP growth remained solid, unemployment ticked up to 4.2%, CPI had dropped significantly from last year, and PCE inflation had slowed to 2.5% annually. Core CPI goods’ prices also declined in recent months. While inflation remains somewhat elevated, Fed members expressed growing confidence that it is steadily moving toward their 2% target. They also noted that the balance of risks between inflation and employment appeared more aligned than in previous months. In the stock market, officials pointed out that major indexes recovered from their early August dip and ended the month higher overall.
Fed staff forecasted continued solid economic growth, with GDP expected to remain in line with previous projections, though unemployment is expected to rise slightly. Nearly all members agreed that inflation was moving in the right direction, viewing earlier first-quarter spikes as temporary.
Given these developments, the FOMC opted for a 0.5% rate cut, lowering the benchmark interest rate to 4.75–5.0%. One member dissented, favouring a smaller 0.25% cut. Nonetheless, all members reaffirmed their commitment to promoting maximum employment and achieving the 2% inflation target. Future rate decisions, they emphasized, will depend on incoming data, including labour market conditions, inflation trends, and global financial developments.
Consumer price Index (CPI)
The latest US inflation data for September showed a slightly higher-than-expected monthly increase. According to the Labor Department, the CPI rose by 0.2% for the third consecutive month, exceeding forecasts of a 0.1% rise. Year-over-year, headline inflation (all items) slowed to 2.4%, the lowest rate since February 2021, compared to a 2.5% increase in August. Analysts had anticipated a 2.3% reading.
Looking at the details, ‘Transportation services’ component saw the largest monthly jump, rising 1.4%, while ‘Fuel oil’ prices dropped sharply by 6.0%. Over the past year, ‘Transportation services’ have surged 8.5%, while ‘Fuel oil’ recorded a significant decline of 22.4%. On a more positive note, ‘Shelter’ costs, which include mortgage and rent payments, slowed to 4.9% annually from August’s 5.2%.
Core CPI, which excludes food and energy prices, maintained a 0.3% monthly increase, matching August’s gain. Annually, core CPI edged up to 3.3%, slightly above August’s 3.2% rate. Analysts had expected readings of 0.2% and 3.2%, respectively.
Overall, the September report offers a mixed picture. Headline inflation continues its downward trend but remained higher than expected, while core inflation, a key indicator of future price trends, stalled in its decline. This suggests the Fed is unlikely to pursue a 0.5% rate cut at their next meeting. Most analysts are now predicting the Fed will opt for a 0.25% rate reduction at their November meeting.
Remember, lower inflation means prices are rising at a slower pace—not that prices are falling. 😊
American market volatility
The CBOE Volatility Index (VIX), often referred to as the market’s “fear gauge,” began the week at 20.84 and remained above 20 throughout, ultimately closing at 20.52. Midweek, the VIX surged to 23.07, driven by increased uncertainty following stronger-than-expected inflation data, which raised questions about the economy’s outlook.
The VIX measures expected market volatility over the next 30 days. Readings below 12 suggest calm, stable conditions, while levels between 12 and 20 indicate normal market fluctuations. When the index falls in the 20 to 30 range, it signals rising uncertainty, and levels above 30 point to heightened stress, often linked to significant market disruptions or crises.
Consumer Sentiment Index (CSI)
The preliminary reading of the University of Michigan’s CSI slipped to 68.9 in October, ending two months of gains. This marks a decline from September’s 70.1 and falls short of analysts’ expectations of 70.8. While the index dropped 1.7% month-over-month, it was still up 8.0% compared to the same time last year.
Breaking down the components, the Current Economic Conditions reading dipped slightly to 62.7 from 63.3 in September, down 0.9% for the month and a significant 11.2% below its reading a year ago. The Index of Consumer Expectations also softened, falling from 74.4 in September to 72.9 in October—a 2.0% monthly drop, but a substantial 22.9% increase year-over-year.
High prices have now surpassed inflation as the top concern for consumers, with many expecting inflation to continue easing. Looking ahead, there is a sense of caution, with consumers anticipating a slight worsening of their economic situation over the next year. However, some may be reserving judgment on their future prospects, potentially waiting to see the outcome of the upcoming election before forming a clearer view.
The Potential Breakup of Google: What It Could Mean for Alphabet
The US Department of Justice (DOJ) is currently considering breaking up Google, a move that could have significant consequences for Alphabet (NASD: GOOGL), its parent company, and the broader tech industry. If the breakup proceeds, some of Google’s most valuable units could be split off, including its core search engine, which dominates global search traffic, its advertising platforms like AdWords and AdSense that generate a large portion of Alphabet’s revenue, its Android operating system, a critical part of Google’s ecosystem, and its popular web browser, Chrome, which is tied to a suite of services that extend Google’s reach.
For Alphabet, this breakup would likely result in a substantial loss of revenue, as these key units are heavy contributors to its bottom line. It would also dismantle the synergy between Google’s interconnected businesses, where services like search, ads, and browser work together to create more value. A breakup could increase competition in the search, advertising, and browser markets, which might benefit consumers but pose challenges for the split-off entities. Additional regulatory actions could include preventing Google from collecting sensitive user data, requiring it to make its search results and indexes available to rivals, or allowing websites to opt out of their content being used to train AI products. Moreover, as Google tries to catch up with current artificial intelligence (AI) frontrunner Microsoft (NASD: MSFT), the disruption could stall its progress in AI, a crucial area for future growth. Newly independent units would also face heightened regulatory scrutiny and increased compliance costs, adding further pressure.
From an investment perspective, the impact could be profound. Alphabet’s share price may take a hit as investors view the breakup as a loss of future growth potential and a blow to the company’s overall value. Ultimately, the effects of breaking up Google will depend on how the split is structured, the evolving competitive landscape, and the long-term performance of the hived-off businesses. Both the tech world and investors are watching closely.
Weekly Market Review
Monday: the week got off to a rough start with all four major North American indexes – the Toronto Stock Exchange Composite Index (TSX), the S&P 500 Index (S&P), the Dow Jones Industrial Average (DJIA), and the Nasdaq Composite Index (Nasdaq) – ending firmly in the red. Investors are coming to the conclusion that after last week’s blow out jobs data that the chances of another 0.5% rate cut are very slim. Oil prices extended their rally over growing concerns of supply disruptions caused by increased tensions in the Middle East.
In Canada, increased likelihood of a smaller rate cut by the Fed weighed on the TSX, while higher oil prices limited the fall. In trading, the Energy sector was the only sector to move higher, while the Utilities sector had the biggest decline.
In the US, investors were now betting on a 0.25% rate cut, with no cut being a distant second option. In trading, similar to Canada, the Energy sector was the only one to post a gain with Utilities falling the farthest.
Tuesday: a good day for the American indexes as they recovered most of Monday’s losses, a not so good day for the TSX as the index posted a second straight loss. Investors moved back into technology companies ahead of the latest update on US inflation later this week, and upcoming third quarter earnings reports. Oil prices dropped sharply on news of potential ceasefire talks between Israel and Hezbollah.
In Canada, the country recorded a bigger than expected trade deficit. This was the sixth consecutive monthly deficit. Declining oil prices, combined with China’s lacklustre economic stimulus efforts, weighed on the market overshadowing gains in the Technology sector. In daily trading, Technology emerged as the top performer, while the Energy sector faced the steepest losses.
In the US, investors were awaiting the latest inflation data to gauge the Fed’s next move. If inflation aligns with expectations, a 0.25% rate cut is likely, but if it is too high, the Fed may hold off. In trading, Technology led the gains, while Energy took the biggest hit.
Wednesday: a good day in the markets after minutes from the Fed’s last meeting showed most of the members were in favour of the 0.5% rate cut. Investors are eagerly awaiting tomorrow’s US inflation report for clues on the Fed’s next move regarding interest rates. The data could strengthen the case for further rate cuts by the Fed.
In Canada, the TSX set another record high close, riding on the coattails of the American markets. In trading, the Technology sector was once again the top gainer, while Communications Services was the only sector to lose ground.
In the US, the S&P and DJIA both set record high closes once again as investors grew optimistic that inflation data will increase the chances of another rate cut. In trading, Healthcare posted the biggest gain, while Utilities recorded the biggest loss.
Thursday: in a reversal of index performance on Tuesday, the TSX ended higher while the three American indexes all ended lower after the latest US inflation data came in higher than expected. Investors are now leaning towards a 0.25% rate cut, otherwise the Fed may leave the rate unchanged. Oil prices surged due to supply concerns stemming from geopolitical tensions in the Middle East and potential supply disruptions from Hurricane Milton, which cut power and supply lines across Florida.
In Canada, higher oil and commodity prices lifted the TSX to another record high close. In trading, the Energy sector scored the biggest win, while Financials had the biggest loss thanks to TD Bank’s really bad day.
In the US, jobless claims came in higher than expected, putting the Fed in a tight spot as they try to balance their two primary goals: controlling inflation and promoting maximum employment. In trading, the Energy sector had the day’s biggest advance, while Communications Services had the biggest decline.
Friday: strong earnings reports from major American banks set the tone for the market today putting investors in an upbeat mood, pushing all four indexes higher. Oil prices fell for the second day as investors are concerned about hurricane Milton’s impact on demand from the southeast US. Oil prices fell on ongoing concerns of lower demand caused by Hurricane Milton.
In Canada, the TSX closed at another record high, lifted by the positive news out of the US. In trading on Bay Street, the Technology sector advanced the most, while Consumer Staples was the only sector to fall back.
In the USA, The S&P ended above 5,800 for the first time as it set another record high. The DJIA also ended the week on a positive note, notching a record high at the close. In trading on Wall Street, the Financials sector posted the biggest increase, while Technology and Consumer Cyclicals were the only sectors to finish lower.
Weekly Market and Portfolio Review
For the week, the TSX (SPTSX) gained 1.3%, the S&P 500 (SPX) increased 1.1%, the DJIA (INDU) rose 1.2% and the Nasdaq (CCMP) grew 1.1%.
Index
Weekly Streak
TSX:
5 – week winning streak
S&P:
5 – week winning streak
DJIA:
5 – week winning streak
Nasdaq:
5 – week winning streak
After a shaky start to October, the markets rode a welcome updraft this past week, finishing in the green. All four major indexes extended their winning streaks to five weeks, kicking off the first full week of October with strong momentum, as reflected in the weekly progress chart above.
At the beginning of the week, investors were spooked by the previous week’s US labour report, which reignited concerns over the “no landing” scenario—where the economy continues to grow, but inflation creeps back in. The blowout report revealed the fastest job growth in six months, an unexpected drop in unemployment, and rising wages, leading to fears that the Fed might hold off on rate cuts to prevent inflation from flaring up again.
As the week progressed, optimism returned ahead of the US CPI inflation report. However, that hope was short-lived when the data came in hotter than expected. Hopes for a 0.5% rate cut were dashed, and while the markets initially reacted negatively, they quickly shook it off, with all four indexes ending the week higher. Now, a 0.25% rate cut by the Fed seems like the more probable outcome, with the possibility of rates staying unchanged still on the table—albeit a distant second option. With inflation and unemployment both on the rise, the Fed faces the delicate task of balancing these two competing forces.
The start of the third-quarter earnings season also helped buoy the markets. US banks kicked off earnings season with strong results, boosting investor sentiment and sparking hopes that we might see strong earnings across the board. Solid performance in the Financials sector is often a good indicator for the economy as a whole. Healthy bank earnings suggest robust lending activity, low default rates, and growing business investment—all signs of a thriving economy. When banks are doing well, it signals that consumers and businesses are borrowing, spending, and investing, which drives broader economic growth.
In Canada, the TSX has gained 2.4% since the start of October, fuelled by lower rates, the prospect of further cuts, and a more than 12% surge in oil prices. The latest labour survey also delivered a boost, with job growth exceeding expectations and unemployment falling – a positive sign for the economy. The TSX further benefitted from the optimism in American markets, riding the wave of momentum as we head into next week.
With the October Effect – where investors traditionally fear market declines in October – lingering in the back of my mind, I was pleasantly surprised to see a solid week across the board, with gains and positive momentum heading into next week. Strong earnings are rolling in, and economic data is holding steady, giving us plenty of reasons to stay confident. If oil prices and job growth maintain their upward trends, the markets could have even more upside. Here is hoping the markets’ winning streak reaches six! 😊
Portfolio
Weekly Streak
Portfolio 1:
5 – week winning streak
Portfolio 2:
1 – week winning streak
Portfolio 3:
5 – week winning streak
It turned out to be a solid week for all three portfolios, with each landing in the win column, as shown in the chart below. Midweek, I was expecting losses from Portfolios 2 and 3, so it was a pleasant surprise to see all three finish in the green!
Portfolio 1 had a standout week, handily outperforming both the other two portfolios and all four indexes. Not only did 70% of its holdings post gains, but its largest position, Nvidia (NASD: NVDA), surged over 7%. Since its low on August 7, Nvidia’s stock has climbed more than 36% – not too shabby for two months of work! 😊
Adding to the momentum, Celestica (TSE: CLS) soared 19%, Decisive Dividend (TSEV: DE) jumped 18%, Cloudflare (NYSE: NET) rose 12%, and CrowdStrike (NASD: CRWD) climbed 10%. The Trade Desk (NASD: TTD) also hit an all-time high during the week.
Portfolio 2 snapped a two-week losing streak with a strong showing, as 53% of its holdings posted gains and no major losses weighed it down. MongoDB (NASD: MDB) led the way with an impressive 11% gain, and iAG Financial Group (TSE: IAG) and Dollarama (TSE: DOL) hit new all-time highs.
Portfolio 3 lagged behind the other portfolios but still outperformed the indexes! 😊 With 63% of its holdings posting gains, it managed to keep its weekly win streak alive, thanks to notable contributions like Cloudflare’s impressive 12% increase and a 10% rise from Lithium Americas (Argentina) (TSE: LAAC). However, a rough week for TD Bank (TSE: TD) held back its overall performance.
It is always a good week when all three portfolios outperform the indexes, especially during a week where they all advanced. 😊 With an impressive showing from Portfolio 1, solid gains from the others, and a few stocks hitting new highs, there’s definitely positive momentum heading into next week. Here is hoping the winning streaks continues! 😊
Weekly Portfolio & Index performance for the week ended October 11, 2024.
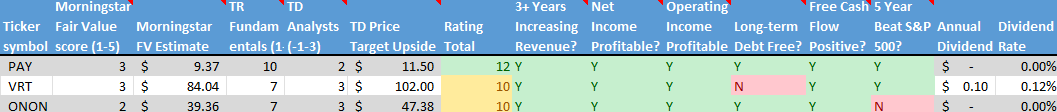
Companies on the Radar
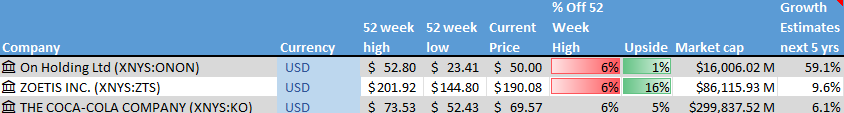
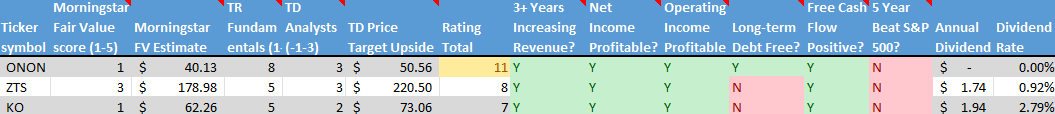
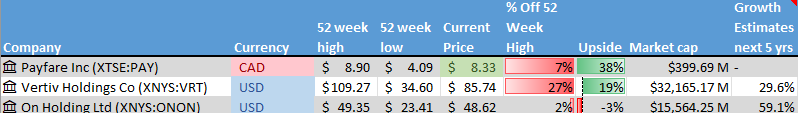
Another week with no new additions to my radar list—though I am not actively hunting for fresh opportunities right now. That said, if the markets take a sharp dip, I will be looking to either add to my current holdings or jump on one of the companies listed below.
As always, these are not buy recommendations—be sure to do your own research and make decisions that align with your personal financial goals!
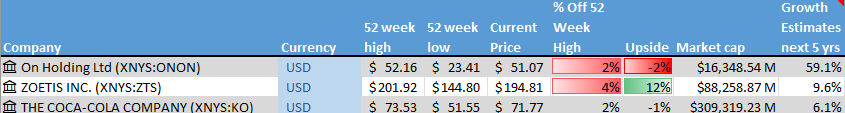
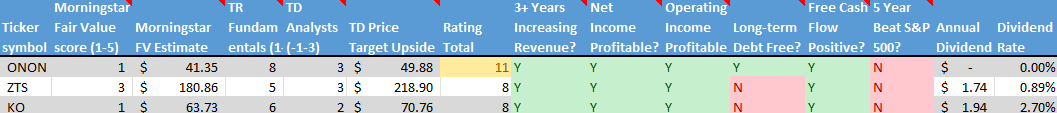
On Holding AG (NYSE: ONON), a medium cap Swiss company, founder-run, sports products company.
Zoetis Inc. (NYSE: ZTS), a leading animal health company that discovers, develops, manufactures, and commercializes vaccines, medicines, diagnostics, and other technologies for both companion animals and livestock.
Coca-Cola (NYSE: KO), a global beverage giant, best known for its flagship soft drink, Coca-Cola. They offer a wide range of non-alcoholic drinks, including sodas, juices, teas, and bottled water, catering to consumers worldwide.
The Radar Check was last updated October 11, 2024.
Stock on the Radar List. 1 of 2.Stock on the Radar List. 2 of 2.
Portfolio Update
Portfolio 1
Portfolio 1 for the week ended October 11, 2024: UP
Alphabet’s Google has been ordered to open up its Google Play app store to other competitors.
Amazon (NASD: AMZN) announced they were testing out new technology that should eliminate a few seconds off the delivery of each package, adding up to faster delivery times. The new system is called Vision Assisted Package Retrieval. It works by shining a green light on packages so that the driver does not have to waste time reading labels. The technology will be installed on roughly 1,000 delivery vehicles.
In an attempt to woo buyers, General Motors (NYSE: GM) is offering buyers of their electrical vehicles (EV) a home storage option that can store and transfer solar energy. The new GM Energy PowerBank could significantly reduce the impact of power outages, providing enough energy to power the average home for up to 20 hours during an outage.
Activity
Tourmaline Oil Corp (TSE: TOU) completed their acquisition of Crew Energy. As part of the deal, shareholders of Crew Energy received 0.114802 of a common share of Tourmaline. The acquisition of Crew Energy was a strategic move that strengthens Tourmaline position in the Northeast British Columbia region and positioning it as a leading player in the Canadian natural gas sector.
Dividends
Dividends Received this week for the following companies:
Companies followed by DRIP (Dividend Re-Investment Plan) indicate additional shares were purchased with the dividend. Any cash leftover was added to the cash balance.
Canadian $
Telus Corp (TSE: T) DRIP
US $
No US$ dividends this past week.
Quarterly Reports
No quarterly reports this past week.
Portfolio 2
Portfolio 2 for the week ended October 11, 2024: UP
Canadian Natural Resources (TSE: CNQ) plans to purchase some of Chevron’s oil sands and shale assets in an all-cash transaction valued at $6.5 billion. The acquisition will increase Canadian Natural’s stake in the Athabasca Oil Sands Project to 90%. The assets are expected to improve their cash flow which will be used to pay down debt, then used in shareholder friendly actions such as dividends and share buybacks.
Alimentation Couche-Tard (TSE: ATD) submitted a revised, non-binding proposal to Japan’s Seven & i Holdings Co. Ltd. (OTCM: SVNDY) in an effort to acquire all of the company’s 7-Eleven stores. The new offer is said to be in the US$47 billion range and would see ATD add approximately 85,800 7-Eleven stores to ATD’s existing more than 16,800 stores that operate in over 31 countries.
Activity
Tourmaline Oil Corp completed their acquisition of Crew Energy. See Portfolio 1 for more information
Dividends
Dividends Received this week for the following companies:
Companies followed by DRIP (Dividend Re-Investment Plan) indicate additional shares were purchased with the dividend. Any cash leftover was added to the cash balance.
Canadian $
Telus Corp (TSE: T) DRIP
Brookfield Renewable Partners LP (TSE: BEP.UN)
US $
No US$ dividends this past week.
Quarterly Reports
No quarterly reports this past week.
Portfolio 3
Portfolio 3 for the week ended October 11, 2024: UP
TD Bank was hit with US$3 billion fine and faces restrictions on its growth in the US after being found guilty of allowing drug cartels to launder money over several years. This makes TD the largest bank in US history to plead guilty to violating federal anti-money laundering laws. As a shareholder, it is frustrating to see TD involved in such a scandal, not to mention the sharp drop in its share price. On the bright side, though, that dip could mean snagging an extra share through the dividend reinvestment program when the next quarterly payout rolls around. 😊
Brookfield Asset Management (TSE: BAM) announced they will buy European real estate company Tritax EuroBox (LSE: EBOX), owners of warehouses and distribution centres throughout Europe.
Activity
No significant activity to report this week.
Dividends
Dividends Received this week for the following companies:
October: A Month of Market Mayhem or Opportunities?
September may be notorious for its volatility, but October is when the real drama unfolds in the markets. October has witnessed some of the stock market’s most jaw-dropping crashes, earning its reputation for volatility. One of the earliest examples was the Panic of 1907, which peaked in October, wiping out about 50% of the market’s value due to a banking crisis sparked by failed speculation. Then there’s Black Tuesday, October 29, 1929, a date forever linked to the crash that ushered in the Great Depression. Preceded by Black Thursday (October 24) and Black Monday (October 28), this period erased massive wealth and sent shockwaves across the global economy. Fast forward to October 19, 1987—Black Monday—when the Dow Jones nosedived 22.6% in a single day, the largest one-day percentage drop in US history. Fueled by program trading, overvalued stocks, and low liquidity, this crash triggered investor panic.
However, October is also known for remarkable recoveries. After the 1987 crash, the markets began to recover within months, regaining most losses by year-end. Similarly, October 2002 signaled the bottom of the bear market that followed the dot-com bubble burst, paving the way for a bull run that lasted until October 2007, during which the S&P 500 more than doubled, driven by economic recovery, low interest rates, and strong corporate earnings. While October is notorious for downturns, it also marks key turning points toward recovery.
Why is October so unpredictable? One reason October is the psychological factor. Investors recall past crashes, creating a self-fulfilling prophecy where fear drives sharper market swings. October also marks the start of third-quarter earnings season, prompting significant market reactions to summer performances. Portfolio rebalancing also plays a role, as institutional investors adjust their holdings before year-end, creating waves of buying and selling. Plus, October often coincides with global events—wars, political upheaval, or economic shifts—that add fuel to the fire.
For Canadian investors, October brings its share of volatility. The Canadian market often mirrors US market swings due to close economic ties, but domestic factors are significant too. Commodity prices, like oil and gold, key economic data (such as inflation and employment), and the BoC’s interest rate decisions can all heighten market fluctuations, contributing to October’s unpredictability.
As autumn arrives, October brings a mix of excitement and anxiety for investors. Known for its dramatic swings and historic crashes, this month can feel like a rollercoaster ride for those monitoring their portfolios. It presents both cautionary tales and golden opportunities—one moment you are bracing for turbulence, and the next, you are ready to seize a recovery.
For savvy investors, the key is to stay focused on long-term strategies. With a little luck, the positive momentum from September will carry into October, and if economic data remains favourable, it could further boost investor confidence. Remember not to panic during market fluctuations—stick to your long-term investing plan. If you have cash available, a crash can be an opportunity to add to existing holdings or invest in quality companies. Alternatively, consider diversifying your portfolio with another strong contender. What does this October hold for you?
As we brace for October’s twists and turns, let’s see what happened this past week….
Items that may only interest or educate me ….
Canadian Economic news, US Economic news, Another kink in the (supply) chain .…
Canadian Economic news
This past week’s key economic data that the Bank of Canada (BoC) considers when deciding whether to raise or lower the interest rate.
Canadian market volatility
Canada’s Volatility Index (CVIX) started the week at 10.84, rising steadily to a mid-week high of 12.37 before easing to 10.69 by Friday’s close. The sharp spike in volatility came after escalating tensions in the Middle East following Iran’s missile attack on Israel. Throughout the week, the CVIX fluctuated amid concerns over cooling labour markets in both Canada and the US. However, a stronger-than-expected US jobs report on Friday provided some relief, calming the CVIX as the week ended on a more stable note.
Tracked under the ticker VIXI on the Toronto Stock Exchange (TSE), the CVIX measures anticipated market volatility. Readings below 10 indicate a calm, stable market; values between 10 and 20 signal moderate volatility and typical market fluctuations, while levels above 20 suggest heightened uncertainty and increased market turbulence.
US Economic news
This past week’s key data points that the Federal Reserve (Fed) considers when deciding whether to raise or lower the interest rate.
Labour data
Recent US labour reports from the Labor Department’s Job Openings and Labor Turnover Survey (JOLTS) and the Bureau of Labor Statistics’ Employment Situation Summary (ESS) reveal encouraging signs of strength across the job market.
JOLTS
The JOLTS report for August indicated 8.0 million job openings, slightly up from July’s upwardly revised 7.711 million and beating analysts’ expectations of 7.655 million. This marks the first increase in job openings in three months, pushing the ratio of job openings to unemployed persons from 1.08 in July to 1.13 in August. However, year-over-year, job openings have declined by 1.3 million.
This JOLTS highlights the ongoing demand for workers, which could drive wage growth and temper the need for the Fed to aggressively cut interest rates if inflation concerns linger. However, any decline in openings could point to a cooling labour market.
ADP Employment Report
The ADP employment report for September showed a strong rebound in private-sector hiring, with 143,000 jobs added—up from 99,000 in August and exceeding expectations of 120,000. This marks the first increase in five months, with notable growth in the manufacturing sector. Of the ten major industry sectors, Information was the only one to see a decline in employment.
The ADP report is a key indicator of private-sector job creation, offering an early look at trends that help shape expectations for the broader labour market ahead of the official ESS.
ESS
The ESS for September delivered strong results, with non-farm payrolls jumping by 254,000—well above both August’s revised figure of 159,000 and the 246,000 jobs added last September. This exceeded analysts’ forecasts of 140,000 new jobs and surpassed the 12-month average increase of 203,000 jobs.
Meanwhile, the unemployment rate dipped to 4.1%, down from 4.2% in August, defying expectations of it holding steady. Though it remains above the 3.8% rate from September 2023, this is still a positive sign. Additionally, wages grew by 0.4% for the second consecutive month, bringing the annual increase to 4.0%, outpacing expectations.
This stronger than expected report eases concerns of a cooling job market and boosts the likelihood of the Fed opting for a smaller 0.25% rate cut, or possibly holding steady at the next meeting, as they work to balance inflation risks with strong employment.
Conclusion
Overall, the US labour market continues to show resilience with steady job growth, low unemployment, and rising wages. The JOLTS, ADP, and ESS reports collectively point to a robust job market, making it more likely the Fed will proceed cautiously with interest rate adjustments to avoid stoking inflation. This strength bodes well for the economy, providing a brighter outlook for both consumers and investors.
American market volatility
The CBOE Volatility Index (VIX), often referred to as the market’s “fear gauge,” began the week at 17.06 before spiking to 20.49 after a missile attack by Iran on Israel, which escalated tensions in the Middle East and pushed oil prices higher. The VIX fluctuated between 18.25 and 25.0 for the rest of the week, eventually settling at 19.17 on Friday. Stronger-than-expected US labour data helped calm market jitters, bringing the VIX down from its mid-week highs.
The VIX measures projected market volatility over the next 30 days. Levels below 12 indicate a calm market, while readings between 12 and 20 reflect normal fluctuations. A range of 20 to 30 suggests rising uncertainty, and levels above 30 signify extreme stress, often linked to major market disruptions or crises.
Another kink in the (supply) chain
Just as North American supply chains were regaining momentum, a major disruption hit. At 12:01 a.m. ET on October 1, around 45,000 dockworkers at 36 East and Gulf Coast ports began a work stoppage after their contract expired—marking the first large-scale stoppage in 50 years. Nearly half of America’s ocean-going shipping was impacted, with West Coast ports still operational but unable to fully absorb the shock. The primary issues were demands for higher wages and revisions to automation terms in the expired six-year contract. Analysts estimated the stoppage could cost the US economy up to US$5 billion per day, potentially causing shortages of goods like bananas (the most popular fruit in America) and cars and raising prices ahead of the holiday season. Fortunately, many retailers had anticipated the disruption and stocked up inventory beforehand.
After three days, the work stoppage was paused, reopening critical gateways for imports like food, vehicles, and heavy machinery. Thanks to advance planning and cargo diversions to the West Coast, many manufacturers and retailers weathered the short disruption. However, a longer stoppage would have caused significant supply chain bottlenecks and higher shipping costs as goods were rerouted.
The immediate impact of the stoppage was felt across industries relying on imports and exports—such as retail, automotive, and construction—with concerns over delays, potential shortages, and rising costs. While larger companies mitigated the damage through stockpiling and rerouting shipments, the disruption added pressure to already strained logistics networks.
While the stoppage has ended, it is important to note that the current deal only extends the contract until January 15, 2025. Ongoing negotiations over wages and automation still need a final resolution. In the meantime, dockworkers will continue under the terms of their previous contract.
Now that the work stoppage has ended, the swift resolution helps avoid long-term damage to supply chains, which is good news for us investors. With businesses focused on clearing shipment backlogs and getting operations back on track, the immediate risk of major disruptions has passed. While there may still be some short-term logistical challenges, the worst-case scenario has been averted. This means companies in affected sectors—like retail, automotive, and manufacturing—should stabilize, allowing for more predictable performance going forward. For us investors, it signals a return to smoother supply chain operations, reducing the chance of unexpected costs and delays that could impact companies’ sales and net income, which in turn could impact share prices.
Weekly Market Review
Monday: the indexes spent most of the day underwater after Fed Chair Powell said the central bank was in no hurry to cut rates. However, a late rally saw all four indexes – the Toronto Stock Exchange Composite Index (TSX), the S&P 500 Index (S&P), the Dow Jones Industrial Average (DJIA), and the Nasdaq Composite Index (Nasdaq) – finish in positive territory after investors began to grasp the rest of Mr. Powell’s speech where he said the economy was in good shape, they expected a total of 0.5% more cuts to come this year, and they were prepared to do what was necessary to keep the American economy rolling.
In Canada, the TSX fell just short of ending the month with a record high on the strength of higher oil prices and momentum from the US markets. In trading, the Technology sector posted the biggest gain, while Basic Materials (miners and fertilizer manufacturers) posted the biggest loss.
In the US, the S&P and the DJIA both end the month on a high note, setting record highs on the last day of the month. In trading, The Energy sector advanced the most, while the Basic Materials sector declined the most.
Tuesday: a mixed day that saw all three American indexes end in the red, with the TSX being the lone index to end higher. A higher-than-expected jobs opening report has many investors feeling the Fed will lower rates by 0.25% rather than a hoped for 0.5%. Oil prices surged after Iran launched a barrage of missiles at Israel, increasing supply concerns.
In Canada, the TSX closed at a record high on the strength of higher oil and gold prices. In trading, Energy and Basic Materials were the only sectors to advance, the Technology sector had the sharpest drop.
In the US, escalating hostilities in the Middle East prompted investors to shift their investments to safer areas of the market. In trading, the Energy sector rode higher oil prices to the largest daily gain, while the technology sector suffered the largest loss.
Wednesday: It was a choppy day in the markets, with the TSX being the only major index to close in the red. Investor optimism about future rate cuts was tempered by growing geopolitical tensions in the Middle East, which kept investor sentiment cautious. These concerns also drove oil prices higher, as fears about potential supply disruptions from the region intensified.
In Canada, the TSX hit an all time high during the session but was not able to hold it as investors started taking some money off the table after the recent runup. In trading, the Technology sector had the biggest increase, while Consumer Staples declined the most.
In the US, a higher-than-expected ADP private payrolls report showed the labour market remains resilient. In trading, the Energy sector gained the most, while the Consumer Staples sector fell the farthest.
Thursday: The four major indexes spent most of the day fluctuating in negative territory before ultimately closing in the red. Investors are holding their breath ahead of tomorrow’s US jobs report for September, looking for any signs of a cooling labour market that could pave the way for another 0.5% rate cut by the Fed. Meanwhile, escalating tensions in the Middle East fueled a sharp rise in oil prices, adding to the market’s uncertainty.
In Canada, the TSX continued its recent pullback, however, losses were limited by higher energy prices. A three-day strike at the port of Montreal that had shut down two container traffic terminals came to an end; however, talks are ongoing regarding wages. In trading, the surge in oil prices let to the Energy sector posting the biggest gain, while the Utilities sector sank the most.
In the US, higher oil prices helped the Energy sector post the largest gain, while Consumer Cyclicals fell the farthest.
Friday: a much higher than expected US jobs report eased concerns of a slowing US economy, sending all four indexes soaring. Tensions in the Middle East pushed oil prices higher, helping oil post its biggest weekly gain in over a year.
In Canada, buoyed by higher oil prices, and the good news out of the US, the TSX closed at another record high. In trading on Bay Street, the Technology sector recorded the biggest advance, while Consumer Staples dropped the most.
In the US, the re-opening of East and Gulf coast ports added to overall investor optimism, helping send the DJIA to another record high close. In trading on Wall Street, the Financials sector posted the largest gain, while Utilities had the steepest decline.
Weekly Market and Portfolio Review
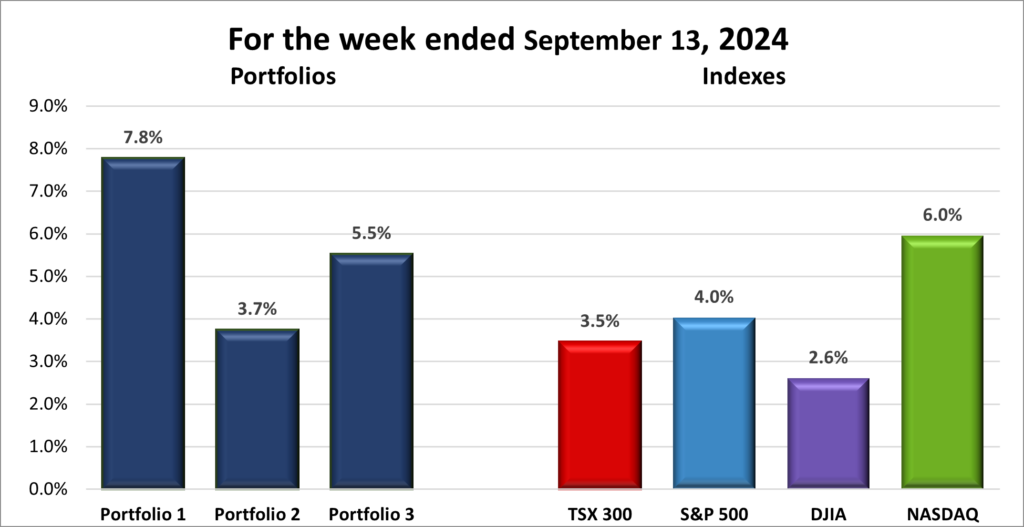
For the week, the TSX (SPTSX) gained 0.9%, the S&P 500 (SPX) advanced 0.2%, the DJIA (INDU) rose 0.1% and the Nasdaq (CCMP) increased by 0.1%.
Index
Weekly Streak
TSX:
4 – week winning streak
S&P:
4 – week winning streak
DJIA:
4 – week winning streak
Nasdaq:
4 – week winning streak
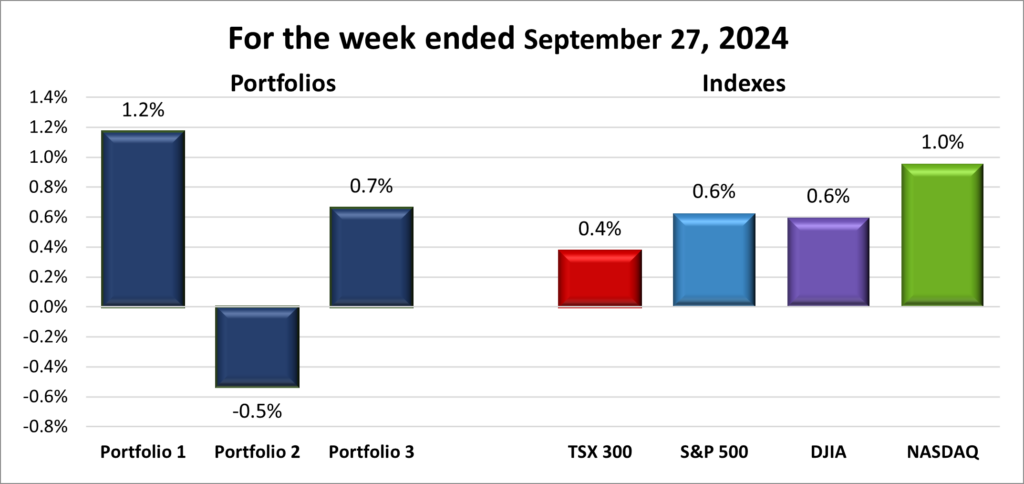
The week kicked off on a positive note, closing out September on a high and seeing the S&P notch yet another record close. All four major indexes posted a monthly win, leaving the usually dour September with an upbeat finish. The week seemed like it might fizzle out as investors grew anxious over a potentially slowing American labour market, hinting at broader economic weakness. But, in a twist, a blowout US jobs report sent all four indexes soaring. The TSX climbed further into positive territory, while the three major American indexes joined the weekly win column, as shown in the chart above.
Investor confidence remains strong, thanks to the Fed’s significant interest rate cut the previous week and a resilient US economy. This week, American labour data was the key market driver on both sides of the border. Weaker numbers could’ve sparked concerns about a slowing US economy, but the data exceeded expectations, signalling continued strength in the labour market and economy.
Tensions in the Middle East added some turbulence throughout the week, putting downward pressure on American markets. However, Canada’s TSX benefited from rising oil prices, which boosted energy stocks and kept the resource-heavy index in the green all week.
All in all, the week was a bit of a rollercoaster, but the strong US jobs report turned what could’ve been a lackluster finish into wins for all four indexes. With the TSX gaining strength from rising energy prices and US markets rallying on positive labour data, the outlook for the coming weeks looks promising. As we head deeper into October—a month that’s often a wildcard for markets—the strong economic news could help keep the upward momentum going. Here’s hoping the rally continues! 😊
Portfolio
Weekly Streak
Portfolio 1:
4 – week winning streak
Portfolio 2:
2 – week losing streak
Portfolio 3:
4 – week winning streak
Not a bad way to kick off October, with two out of three portfolios increasing in value— definitely better than the start of September when all three portfolios dropped by at least 1.5% in that first week. 😊
Portfolio 1 was the top performer, but it did not break into positive territory until the last day of the week. While there were not any dramatic moves—no gains or losses exceeding 10%— a slim majority of companies posted a weekly loss. Fortunately, the largest holding, Nvidia, posted a weekly gain, driving the portfolio into the win column and extending its win streak to four weeks.
Portfolio 2 was the only portfolio to decrease in value, with 40% of the holdings down for the week. It is no surprise the portfolio declined, but there was a bright spot: TC Energy (TSE: TRP) jumped 18%, softening the blow.
Portfolio 3 also finished in the green, despite only 39% of stocks growing in value. Like Portfolio 1, there was not a single stock posting either a 10%+ gain or loss.
Hopefully, the strong US labour report from last week sets the stage for a rally. Historically, October has been the second-best month for the technology sector in the S&P 500, right after November. Since all three portfolios are tech-heavy, here is to hoping this trend continues and lifts us through the rest of the month! 😊
Weekly Portfolio & Index performance for the week ended October 4, 2024.
Monthly Market and Portfolio Review
For the month of September, the TSX (SPTSX) advanced 2.8%, the S&P 500 (SPX) rose 2.0%, the DJIA (INDU) increased 1.8% and the Nasdaq (CCMP) was buoyed 2.7%.
September brought an unexpected boost to the markets, flipping its usual reputation as a historically tough month for stocks. The S&P gained 2.1%, a significant contrast to its historical average decline of 1.1% in September, where it suffers losses about 55% of the time. This year, all four major indexes posted solid gains, with the TSX, S&P, and DJIA setting multiple record highs. Much of the focus was on the Fed, as investors anxiously awaited the size of the next rate cut. When the Fed delivered a jumbo 0.5% cut, it sparked a wave of market optimism that fueled the impressive performance across the board. By the end of the month, the S&P had its best year-to-date run since 1997 and capped off its strongest quarter since late 2021. What started as a month of uncertainty turned into one of gains, buoyed by a reduction in the US benchmark interest rate and renewed investor confidence.
In the US, several key factors shaped the markets: concerns that the AI boom was slowing, a softening labour market, cooling inflation, uncertainty around the upcoming election, and the biggest driver, the Fed’s rate cut – both the anticipation and the actual reduction. The Fed’s first rate cut since March 2020, an aggressive 0.5%, helped propel markets higher, though some worried it signaled deeper concerns about the economy. Chinese economic stimulus measures aimed at jumpstarting the world’s second-largest economy also added to the positive momentum, further boosting investor sentiment.
In Canada, the TSX’s three-week rally was fueled by a blend of falling inflation, a third 0.25% rate cut by the BoC, rising commodity prices, and the ripple effect of the Fed’s moves south of the border. These factors reignited investor confidence, giving the TSX the final push it needed to end the month on a strong note.
September’s market performance across North America was a welcome surprise for investors, with both the US and Canadian markets benefiting from central bank actions and improving economic conditions. The combination of rate cuts, cooling inflation, and strong commodity prices reignited investor confidence on both sides of the border. As we head into October, another month known for volatility, the focus will likely remain on economic data and central bank policies. With any luck, October will provide another pleasant surprise much like September. Keep your fingers crossed. 😊
After a mixed August, September brought a welcome turnaround for all three portfolios. As shown in the chart below, each portfolio posted gains, with Portfolios 1 and 3 outperforming their August results, while Portfolio 2 held steady, matching last month’s performance.
Portfolio 1 started off rough, dropping 7.1% in the first week, only to rebound with a 7.8% gain the following week. From there, it posted steady weekly gains, averaging around 1%. The real driver? Nvidia (NASD: NVDA), which was behind both the early drop and the later surge. By the final week, Nvidia’s weight in the portfolio pulled it back into the green, despite the majority of stocks posting losses that week. Unsurprisingly, technology stocks played a pivotal role throughout the month.
Portfolio 2 had a more volatile ride, with a mix of ups and downs. Fortunately, the gains in weeks two and three more than compensated for the losses in weeks one and four. Hammond Power Solutions (TSE: HPS.A) was a standout, with significant swings in its share price that added some drama to the portfolio’s performance during the first three weeks.
Portfolio 3 stole the spotlight in September, delivering the strongest performance across all portfolios and indexes. Other than a dip in the first week, it consistently posted solid weekly gains. Key drivers included Lithium Americas (TSE: LAC) and Lithium Americas (Argentina) (TSE: LAAC), both of which fluctuated wildly, but overall contributed to the portfolio’s success. It was a strong month for Portfolio 3, closing September on a high note.
September delivered some much-needed gains across the portfolios after a choppy start to the month. Key stocks like Nvidia and those in the lithium sector helped each portfolio find its rhythm, with Portfolio 3 leading the charge with steady gains. As we enter the home stretch of the year, hopefully these positive trends have laid the groundwork for a strong finish. Here is to hoping October keeps the momentum going!
Monthly Portfolio & Index performance for September, 2024.
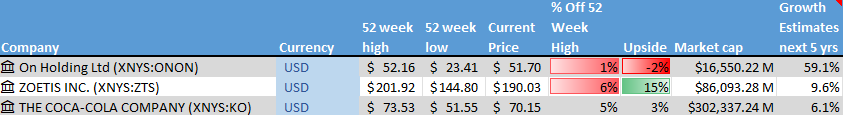
Companies on the Radar
This past week, I did not spot any fresh additions to my radar list. Sometimes, my best ideas are already on my radar or nestled in one of my three portfolios. 😊 Just a reminder, these are not buy recommendations – always do your own research and do what will help you achieve your own financial goals!
On Holding AG (NYSE: ONON), a medium cap Swiss company, founder-run, sports products company.
Zoetis Inc. (NYSE: ZTS), a leading animal health company that discovers, develops, manufactures, and commercializes vaccines, medicines, diagnostics, and other technologies for both companion animals and livestock.
Coca-Cola (NYSE: KO), a global beverage giant, best known for its flagship soft drink, Coca-Cola. They offer a wide range of non-alcoholic drinks, including sodas, juices, teas, and bottled water, catering to consumers worldwide.
The Radar Check was last updated October 4, 2024.
Stock on the Radar List. 1 of 2.Stock on the Radar List. 2 of 2.
Portfolio Update
Portfolio 1
Portfolio 1 for the week ended October 4, 2024: UP
Carnaval Cruise Line (NYSE: CCL) increased revenues, lowered expenses, and raised its profit outlook as a result of strong demand for cruise vacations.
General Motors’ (NYSE: GM) Cruise self-driving car division was ordered by the National Highway Traffic Safety Administration to pay a US$1.5 million fine after the company failed to disclose details of a serious pedestrian involved accident in a October 2023 crash. Cruise also faces ongoing investigations by the Justice Department and the Securities and Exchange Commission regarding the same accident.
In other GM news, the company reported a 2.2% decrease in third quarter sales. In the previous year, quarterly sales grew by 21%.
Amazon (NASD: AMZN) announced they plan to hire 250,000 temporary transportation and warehouse workers for the upcoming holiday shopping season. This is the same amount they hired for the 2023 holiday season. The company is anticipating online spending to surpass overall holiday sales in the final quarter of 2024.
Rivian (NASD: RIVN) cut its production forecast for the year and missed third-quarter deliveries expectations s a result of a parts shortage and slowing growth in electric vehicle demand.
Activity
No significant activity to report this week.
Dividends
Dividends Received this week for the following companies:
Portfolio 2 for the week ended October 4, 2024: DOWN
TC Energy’s pipeline spin off, South Bow Corp. (TSE: SOBO), began trading on the Toronto Stock Exchange this week, closing lower on its first day. The spin-off was part of TC Energy’s strategy to reduce debt and sharpen its focus on natural gas operations. As part of the deal, TC Energy shareholders received one share of South Bow for every five common shares of TC Energy they owned. Looking ahead, South Bow is set to debut on the New York Stock Exchange (NYSE) next week.
Activity
No significant activity to report this week.
Dividends
Dividends Received this week for the following companies:
Canadian $
Canadian Natural Resources Ltd (TSE: CNQ)
US $
No US$ dividends this past week.
Quarterly Reports
No quarterly reports this past week.
Portfolio 3
Portfolio 3 for the week ended October 4, 2024: UP
Microsoft (NASD: MSFT) has been classified by Germany’s competition bureau, the Bundeskartellamt, as a “company with paramount cross-market significance for competition.” This enables the bureaus to take stronger action against the company in the future.
Goeasy (TSE: GSY) announced its inclusion in the 2024 Report on Business magazine’s list of Canada’s Top Growing Companies, recognized for its impressive three-year cumulative revenue growth.
Enghouse Systems (TSE: ENGH) announced President Vince Mifsud has resigned from the company to pursue another opportunity. He will leave the company in December. His duties will be transitioned to the Chief Executive Officer and Chair, Steve Sadler. In the meantime, the company will immediately begin a search for his replacement.
Activity
No significant activity to report this week.
Dividends
Dividends Received this week for the following companies:
As I mentioned earlier this month, September usually gets a bad rap as one of the toughest months for stocks. But this year? It has been a pleasant surprise! Thanks to anticipation around the US Federal Reserve’s (Fed) first rate cut since the COVID-19 pandemic began in March 2020, the market’s mood shifted. Add in the Bank of Canada’s (BoC) third rate cut in three months, and it has been a win for Canadian investors too. It seems like both central banks feel they are finally winning the inflation battle—if it is not already won.
With just one trading day left in the month, all four major North American indexes are up at least 2%. The TSX leads the pack, rising 3.0%, while the DJIA is up 2.6%, the Nasdaq 2.1%, and the S&P 2.0%.
September 2024 ended up being a month of anticipation and uncertainty. Investors were on edge, waiting to see if the Fed would cut rates and by how much, to give the economy a bit of breathing room. Now that the Fed has delivered, markets are cautiously optimistic, but everyone is still keeping an eye on the data. It looks like this month might just defy the odds!
As this pleasantly surprising September winds down, the markets have been riding a wave of cautious optimism, largely driven by central bank rate cuts, especially from the Fed. But before we officially turn the page to October, let’s take a look at what happened this past week ….
Items that may only interest or educate me ….
Canadian Economic news, US Economic news, Government shutdown avoided, ….
Canadian Economic news
This past week’s key economic data that the BoC considers when deciding whether to raise or lower the interest rate.
Bank of Canada minutes
Following two consecutive reductions, the BoC’s Governing Council decided to cut the benchmark interest rate by an additional 0.25%, bringing it to 4.25%. The minutes from their recent meeting offer a revealing glimpse into the deliberations and thought processes behind this decision.
Prior to this announcement, Council members engaged in discussions about the shifting global economic landscape, with a particular focus on the contrasting situations in the world’s two largest economies: the United States and China. While the American economy showcased unexpected growth, China’s economy continued to struggle.
Turning their attention to domestic matters, the Council noted a continued cooling in the Canadian labour market. Notably, per capita GDP has declined for the fifth straight quarter, despite overall economic growth exceeding expectations, which was largely fueled by increased government spending. Encouragingly, inflation metrics also showed positive signs, with headline inflation, CPI-trim (which averages price data), and CPI-median (which identifies the midpoint of price changes) all falling below 3%.
While officials expressed confidence in the downward trend towards their 2% inflation target, they remained cautious about the labour market’s weakness, acknowledging that recovery might take longer than initially anticipated. With downside risks to inflation stemming from a slowing economy in mind, the Council felt it prudent to lower the rate. They indicated that if the data continued to suggest falling inflation, further reductions would be considered.
Gross Domestic Product (GDP)
In July, the Canadian economy surprised on the upside, with Statistics Canada reporting a 0.2% growth, beating expectations of 0.1%. On an annual basis, GDP expanded by 1.5%.
Breaking it down, the Goods-producing industries saw a modest 0.1% increase, led by a 0.6% rise in ‘Agriculture, forestry, fishing, and hunting.’ However, ‘Construction’ took the hardest hit, dropping 0.4%. Over in the Services-producing industries, ‘Retail trade’ was a standout, climbing 1.0%, while ‘Management of companies and enterprises’ saw the biggest loss, down 3.2%.
Year-over-year, the Goods-producing sector dipped 0.3%. The highlight was ‘Agriculture, forestry, fishing, and hunting’ growing 6.1%. On the downside, ‘Construction’ slumped 2.7%. On the Services side, ‘Educational services’ led the way with a 3.6% increase, while ‘Management of companies and enterprises’ experienced a steep 33.1% decline.
Looking ahead to the August data, preliminary estimates suggest the economy remained flat, with gains in oil and gas extraction and the public sector balancing out losses in manufacturing, transportation, and warehousing.
Canadian market volatility
Canada’s Volatility Index (CVIX) kicked off the week at 10.39, rising above 11.5 on Tuesday before settling below 11 for the remainder of the week, closing at 10.84. The mid-week surge was likely driven by market excitement following China’s announcement of economic stimulus measures to revive its economy.
Tracked under the ticker VIXI on the Toronto Stock Exchange (TSE), the CVIX measures anticipated market volatility. Readings below 10 indicate a calm, stable market; values between 10 and 20 signal moderate volatility and typical market fluctuations, while levels above 20 suggest heightened uncertainty and increased market turbulence.
US Economic news
This past week’s key data points that the Fed considers when deciding whether to raise or lower the interest rate.
Gross Domestic Product (GDP)
The Commerce Department’s Bureau of Economic Analysis final reading of second-quarter GDP held steady at 3% annually, unchanged from the previous estimate in August. Gains in private inventory and federal government spending outweighed the declines in non-residential fixed investment and exports.
This solid performance boosts confidence that the economy will maintain steady growth in the coming year. It also signals that any further slowdown in the labour market may be limited, offering a reassuring outlook for jobs and economic resilience.
Personal Consumption Expenditures (PCE)
The Commerce Department’s Bureau of Economic Analysis released some encouraging news about inflation: the PCE price index grew by just 0.1% in August, down from 0.2% in July. On an annual basis, the PCE inflation rate came in at 2.2%, lower than analysts’ expectations of 2.3% and down from July’s 2.5%.
Turning to core PCE, which excludes the often-volatile food and energy prices, the index rose 0.1% in August, slightly below July’s 0.2% increase. While this result was also below the anticipated 0.2% growth, the year-over-year core PCE figure matched expectations at 2.7%, up from 2.6% in July.
Overall, this latest data paints a positive picture, with both monthly and annual PCE rates slowing more than expected and getting closer to the Fed’s target inflation rate of 2%. While the slight uptick in core PCE raises a minor concern, the broader trend is encouraging. Looking ahead to the Fed’s next meeting in November, it seems more likely they will opt for a modest cut of 0.25% rather than the 0.5% many investors are hoping for.
American market volatility
The CBOE Volatility Index (VIX), often referred to as the market’s “fear gauge,” opened the week at 16.93. During the early part of the week, volatility gradually declined to 15.01, buoyed by positive news about the strength of the American economy in the second quarter. However, in the last two days, volatility increased again, settling at 16.96 by week’s end. This uptick was likely driven by PCE data that met expectations, raising the likelihood of a smaller 0.25% interest rate cut instead of the more aggressive 0.5% reduction many had been hoping for.
The VIX measures projected market volatility over the next 30 days. Levels below 12 indicate a calm market, while readings between 12 and 20 reflect normal fluctuations. A range of 20 to 30 suggests rising uncertainty, and levels above 30 signify extreme stress, often linked to major market disruptions or crises.
Consumer Sentiment Index (CSI)
The University of Michigan’s final September reading on consumer sentiment brought some encouraging news, climbing to 70.1 from August’s 67.9 and surpassing expectations of 69.3. That is a 3.2% month-over-month increase and a 3.4% improvement from last year.
Breaking it down, the Current Economic Conditions index rose to 63.3, up 3.3% from August, although it remains 11% lower than in September 2023. Meanwhile, the Index of Consumer Expectations surged to 74.4, beating both forecasts and August’s reading of 72.1, marking a strong 13.2% gain year-over-year.
The Current Economic Conditions index captures how consumers feel about their immediate financial situation and the broader economy, offering insight into present-day confidence. In contrast, the Consumer Expectations index looks ahead, gauging optimism about personal finances and the economy in the near future.
What do these numbers tell us? Consumers are feeling more secure in their current finances and increasingly optimistic about the future. However, many have indicated that their outlook is closely tied to the upcoming presidential election.
For investors, improving consumer sentiment often signals increased consumer spending, which can drive higher revenues for businesses and, in turn, lift stock prices. This latest CSI reading is a positive sign for the markets, offering a potential boost to us investors’ portfolios. 😊
Consumer Confidence Index (CCI)
The Conference Board reported a sharp drop in its CCI for September, which came in much lower than expected at 98.7, down from a upwardly revised 105.6 in August. Analysts had been predicting a reading of 104, making this the biggest one month drop since August 2021.
Both of the CCI’s main components declined. The Present Situation Index, which reflects consumers’ views on the current business and labour environment, fell to 124.3 from 134.4 in August. The Expectations Index, which gauges six-month outlooks for income, business, and jobs, slipped to 81.7 from 82.5—its third straight monthly decline. Fortunately, it remains above 80, as dipping below that level often signals a recession.
The drop in both components points to growing concerns over the labour market, particularly after unemployment hit a three-year high of 4.2%. While the job market remains relatively strong, the combination of slowing employment growth and persistent inflation has left consumers feeling less optimistic about the future.
Shutdown avoided
A US government shutdown was narrowly avoided as lawmakers in both the House and Senate passed a bill late Wednesday to extend federal funding through late December. This move delays the politically risky prospect of a shutdown until after the upcoming election. With the election on the horizon, Republicans were reluctant to engage in the usual brinkmanship that often accompanies funding negotiations. The bill prevents a shutdown that would have hit after the current funding expired on September 30, with the new deadline now set for December 20. Between now and then, Congress will need to finalize agency budgets, but the election’s outcome could shift priorities.
Weekly Market Review
Monday: It was a choppy day in the markets, but all four major indexes—Toronto Stock Exchange Composite (TSX), S&P 500, Dow Jones Industrial Average (DJIA), and Nasdaq Composite—managed to close in positive territory. Investors are still concerned the Fed’s 0.5% rate cut is an indicator the US economy is performer worse than thought. Oil prices ended lower on concerns of lower demand and a weak Chinese economy.
In Canada, the TSX set a record high close for the third session in a row. In trading, the Consumer Staples sector advanced the most while the Basic Materials sector (miners and fertilizer manufacturers) lost the most.
In the US, the S&P and DJIA both edged up to reach new record highs as investors digested comments from three Fed officials backing the larger rate cut. In trading, despite lower oil prices, the Energy sector posted the biggest gain, with Healthcare recoding the biggest decline.
Tuesday: all four indexes posted modest gains as investors weighed fresh economic stimulus measures from the Chinese government and their potential ripple effects on North American markets. Oil prices surged on news of the Chinese economic stimulus measures.
In Canada, the Chinese economic stimulus measures boosted commodity prices and sent the resource heavy TSX to another record high close. In trading, Basic Materials posted the biggest gain, while Consumer Staples declined the most.
In the US, despite weakening consumer confidence in the labour market, both the DJIA and S&P ended the day at record highs, driven by positive news out of China. In trading, Basic Materials posted the biggest gain while Financials suffered the drop.
Wednesday: The markets cooled today, pushing all but the Nasdaq into the red. Investors are now weighing the possibility that the Fed’s jumbo-sized rate cut was an attempt to stave off a slowing US economy, which could be heading toward a recession. Oil prices dropped as concerns about supply issues in Libya eased.
In Canada, the TSX ended lower as investors took a breather, and some gains, after the recent runup to a record high. Lower oil prices also contributed to the TSX’s pullback. In trading, the Utilities sector scored the biggest gain, while the Energy sector fell the farthest.
In the USA, the Nasdaq was essentially flat, while the S&P and DJIA ended lower as investors await tomorrow’s GDP and Friday’s PCE data. In trading, Utilities and Technology were the only sectors to advance, while the Energy dropped the most.
Thursday: strong US economic data, including second quarter GDP that was higher than expected, combined with Chinese efforts to kickstart their economy lifted all four indexes into the green. Oil prices fell when a report suggested the world’s top oil exporter, Saudi Arabia, was prepared to give up their target of US$100 per barrel as they prepare to increase production.
In Canada, The TSX surpassed the 24,000 mark for the first time thanks to higher commodity prices caused by China’s efforts to boost their economy. It was a good day in the Canadian markets, led higher by the Technology sector. Communications Services and Energy were the only sectors to finish the day lower.
In the US, The S&P rose to an all time high, boosted by better-than-expected economic data, quelling concerns the Fed’s giant sized rate cut was in response to the economy slowing too fast. In trading, the Basic Materials sector advanced the most, while Energy slid the farthest backward.
Friday: It was a mixed day, with all four indexes starting strong but losing momentum just before noon, leaving the DJIA as the only one to close in positive territory. The latest US PCE inflation report indicated a continued decline in inflation, sparking hopes for another potential jumbo-sized rate cut by the Fed. Meanwhile, oil prices closed higher, driven by investor optimism for increased demand from China, the world’s top oil importer, following their recent economic stimulus package.
In Canada, the TSX slipped as advance estimates for GDP in August suggest the economy has stalled. In trading on Bay Street, Energy gained the most, while Basic Materials dropped the furthest.
In the USA, the DJIA posted another record high close, while the S&P and Nasdaq both ended slightly lower. Consumer sentiment improved as a result of falling inflation and lower interest rates. In trading on Wall Street, the Energy sector increased the most, while Technology had the biggest drop-off.
Weekly Market and Portfolio Review
For the week, the TSX (SPTSX) rose 0.4%, the S&P 500 (SPX) advanced 0.6%, the DJIA (INDU) increased 0.6% and the Nasdaq (CCMP) grew 1.0%.
Index
Weekly Streak
TSX:
3 – week winning streak
S&P:
3 – week winning streak
DJIA:
3 – week winning streak
Nasdaq:
3 – week winning streak
This past week continued the upward momentum from the previous week, though it wasn’t without its bumps, as shown in the chart above. The TSX, S&P and DJIA all set record high closes multiple times throughout the week. The rally was primarily driven by the Fed’s recent rate cut, which propelled indexes higher at the start of the week. However, as the week progressed, uncertainty crept in. Analysts and investors began to question the reasons behind the Fed’s 0.5% cut. Some interpreted it as a signal of potential weakness in the US economy, while Fed officials reassured that the move reflected progress in cooling inflation and a softer job market.
Adding a boost to the markets was news from China. Their announcement of new economic stimulus measures provided another lift, particularly to the commodities and energy sectors. As one of the world’s largest consumers of oil and raw materials, China’s efforts to jumpstart its economy raised expectations for increased demand, further fueling market optimism.
Returning to the US, investors looked to key economic reports for more clarity about the jumbo rate cut. Thursday’s better-than-expected second-quarter GDP numbers reassured markets that the American economy remains strong, pushing indexes higher. On Friday, the PCE report showed headline inflation falling to 2.2%, just above the Fed’s 2% target. This solidified expectations of another rate cut in November, with growing speculation of a second consecutive 0.5% reduction.
In Canada, the TSX benefitted from the Fed’s rate cut and China’s stimulus. The combination of lower interest rates and an expected rise in commodity demand created the perfect environment for the resource-heavy TSX to thrive. However, it wasn’t all good news as the advanced estimates for Canada’s GDP suggest the Canadian economy has stalled, which could add to the existing uncertainties and open the door for the BoC to make their own jumbo-sized rate cut at their next meeting at the end of October.
While the Fed’s rate cut, promising economic news from the US, and China’s stimulus provided a boost, lingering questions about the strength of the American and Canadian economies and the pace of inflation remain in focus. Adding to the uncertainty is the fact that we’re entering October—a month historically known for heightened market volatility, thanks to events like the 1929 crash and 1987’s Black Monday. Buckle up, because October’s “rollercoaster” reputation might just live up to its name.
Portfolio
Weekly Streak
Portfolio 1:
3 – week winning streak
Portfolio 2:
1 – week losing streak
Portfolio 3:
3 – week winning streak
While the major indexes enjoyed a steady climb this week, the Portfolios delivered a mixed bag of results, as shown in the chart below.
Portfolio 1 led the way but faced some challenges, with only 43% of its companies posting weekly gains. Fortunately, Nvidia Corporation (NASD: NVDA) rose 4.6%, and impressive double-digit surges from Lightspeed Commerce (TSE: LSPD) up 21%, Indie Semiconductor (NASD: INDI) up 16%, and Navitas Semiconductor (NASD: NVTS) up 15% helped extend its winning streak to three weeks. While Nvidia didn’t post a gain over 10%, its dominant position in the portfolio was enough to offset losses from the majority of other stocks.
Portfolio 2 was the only one to slip into the red, snapping a two-week winning streak. With just 48% of holdings posting gains and no standout performances, the portfolio couldn’t overcome losses from the rest of the stocks.
Portfolio 3 had a solid week, with 72% of its holdings increasing in value. Leading the pack was Lithium Americas (Argentina) (TSE: LAAC) skyrocketing 31% (ah, the perks of a low priced, small cap stock! 😊), while Lithium Americas (TSE: LAC) also gained 16%. The combination of a sizable majority of stocks posting weekly gains and a few significant gains, lifted the portfolio into positive territory.
All in all, it was a week of mixed fortunes across the Portfolios. While Portfolios 1 and 3 extended their winning streaks, Portfolio 2 hit a bump in the road. But that’s the nature of investing—sometimes it’s a rollercoaster, and other times it’s a steady climb. While a real rollercoaster is a fun ride, I prefer my investments to be steady climbers. 😊
Weekly Portfolio & Index performance for the week ended September 27, 2024.
Companies on the Radar
This past week, no new companies made it onto my radar, but I did make some changes. Vertiv Holdings (NYSE: VRT) was added to Portfolio 3, while IDEXX Laboratories, Inc. (NASD: IDXX) and Payfare Inc. (TSE: PAY) were dropped. Vertiv stood out due to the growing demand for data centers, which are essential for AI deployment. After running my Radar Check, I found IDEXX to be too similar to Zoetis Inc. (NYSE: ZTS) in the animal health space, and Zoetis ultimately seemed like the better opportunity. As for Payfare, they announced that their agreement with their largest customer, DoorDash (NASD: DASH), would not be renewed, leading to a significant loss in revenue. With Payfare withdrawing its previous revenue and earnings outlook, I decided it was time to remove them from the list.
The companies still on my radar offer a pretty eclectic mix across different sectors. There are two large American giants and one major Swiss player. On top of that, two of these—Zoetis and Coca-Cola (NYSE: KO)—pay steady dividends, rewarding shareholders while leading in their industries. It has become a nicely diversified list of stable, growing companies! 😊
On Holding AG (NYSE: ONON), a medium cap Swiss company, founder-run, sports products company.
Zoetis Inc., a leading animal health company that discovers, develops, manufactures, and commercializes vaccines, medicines, diagnostics, and other technologies for both companion animals and livestock.
Coca-Cola, a global beverage giant, best known for its flagship soft drink, Coca-Cola. They offer a wide range of non-alcoholic drinks, including sodas, juices, teas, and bottled water, catering to consumers worldwide.
The Radar Check was last updated September 27, 2024.
Stock on the Radar List. 1 of 2.Stock on the Radar List. 2 of 2.
Portfolio Update
Portfolio 1
Portfolio 1 for the week ended September 27, 2024: UP
The US Department of Justice filed a lawsuit against Visa (NYSE: V), accusing the company of violating antitrust laws by stifling competition—allegedly through imposing high fees on merchants and paying off potential rivals to maintain its dominance.
Alphabet’s (NASD: GOOGL) Google lodged a complaint to the European Commission (EC) against what it claimed were Microsoft’s anti-competitive practices that locked customers into Microsoft’s Azure cloud platform. Google said Microsoft used its dominant Windows Server operating system to prevent competition.
Lightspeed Commerce has enlisted a financial advisor to evaluate its business and operations, exploring strategic options that could include a potential sale of the company.
PayPal Holdings (NASD: PYPL) announced that US merchants can now buy, hold, and sell cryptocurrency directly from their business accounts, expanding its crypto offerings to businesses.
Amazon’s (NASD: AMZN) partnership with Anthropic AI has been cleared by Britain’s anti trust regulator, the Competition and Markets Authority (CMA). The CMA said the partnership did not fall under its authority so was unable to probe any further.
Activity
Sold: GDI Integrated Services (TSE: GDI) – A small cap Canadian company that provides a wide range of facility management services across North America, including commercial cleaning, HVAC maintenance and repair, energy management, and more for various commercial, industrial, and institutional clients.
I initially invested in GDI back in January 2020, right before the pandemic made clean office environments a top priority. At the time, this seemed like a brilliant move, as the share price surged to nearly C$60 by February 2022 (though I must admit, that was more luck than foresight 😊).
However, since then, the share price has gradually drifted back to the level I originally paid. While the end of the pandemic has likely reduced demand for their janitorial services, the company’s revenue continues to rise, which is a positive sign. But what concerns me is that despite this revenue growth, GDI’s net income has been declining. Additionally, the company’s long-term debt has increased, so it is not as if they are using profits to pay down debt.
I have been holding out, hoping for a turnaround, but it is becoming clear there are better opportunities with stronger potential on my Radar List. With that in mind, I decided to sell my GDI shares, locking in a small profit, and shifting my focus to those more promising prospects.
Dividends
Dividends Receivedthis week for the following companies:
Companies followed by DRIP (Dividend Re-Investment Plan) indicate additional shares were purchased with the dividend. Any cash leftover was added to the cash balance.
Canadian $
Dream Industrial Real Estate Investment Trust (TSE: DIR.UN) DRIP
Portfolio 2 for the week ended September 27, 2024: DOWN
Guardant Health (NASD: GH) announced that a recently published study in the journal Nature Medicine revealed that utilizing the Guardant360® CDx liquid biopsy results to guide targeted therapy can significantly extend survival for patients fighting advanced cancer.
Activity
No significant activity to report this week.
Dividends
Dividends Received this week for the following companies:
Companies followed by DRIP (Dividend Re-Investment Plan) indicate additional shares were purchased with the dividend. Any cash leftover was added to the cash balance.
Canadian $
Hammond Power Solutions
Dream Industrial Real Estate Investment Trust (TSE: DIR.UN) DRIP
Portfolio 3 for the week ended September 27, 2024: UP
Brookfield Asset Management (TSE: BAM) announced it raised US$2.4 billion for the Catalytic Transition Fund (CTF), which seeks to scale up climate finance in emerging markets. BAM’s goal is to raise $5 billion inside the CTF, to be used for clean energy projects and assets.
Microsoft (NASD: MSFT) announced they were investing US$1.3 billion to build up their cloud computing and artificial intelligence (AI) infrastructure in Mexico.
Activity
Sold: GDI Integrated Services: Please see writeup under Portfolio 1.
Bought: Vertiv Holdings: This large-cap American company is a leader in critical digital infrastructure and continuity solutions. In short, Vertiv designs, builds, and maintains systems that ensure IT equipment runs smoothly. Their products include cooling systems to prevent data center overheating, power distribution units for consistent energy delivery, racks to protect IT hardware, and software to manage critical infrastructure.
With AI and data-heavy applications booming, the demand for data centers is soaring—where Vertiv shines. A notable 75% of their market exposure is tied to data centers, making their products essential for building, and operating these facilities efficiently. As sustainability and energy consumption become key concerns, Vertiv’s energy-efficient solutions are more important than ever. The rise of edge computing, which processes data closer to its source, also presents exciting opportunities for their innovative offerings
Vertiv’s focus on resilience and reliability makes their solutions critical in sectors like finance, healthcare, and telecom, where uninterrupted operations are vital. Their diversified presence across industries, from telecom to government, helps them navigate market fluctuations. Vertiv is benefiting from major trends in AI, edge computing, and the rollout of 5G and future mobile communications technology, positioning the company for continued success.
With a seasoned leadership team, including the CEO who has worked for the company since 1998, Vertiv has shown strong financial performance—growing revenues, net income, earnings per share, and cash flow in recent years. Both gross and profit margins have improved, even as the company manages its long-term debt.
That said, investing in Vertiv does come with risks. The infrastructure industry is competitive and subject to rapid technological changes, particularly the electrical equipment industry. Economic downturns, rising interest rates, or reduced capital expenditure in key sectors like data centers could pose challenges to growth. However, with its focus on innovation and strong demand from sectors like AI and 5G, Vertiv is well-positioned to navigate these challenges and capitalize on the opportunities ahead.
As AI, cloud technologies, and telecom networks expand, the need for reliable infrastructure will only grow. Vertiv’s strategic focus and proven capabilities put it in an excellent position to benefit from this trend. Adding Vertiv to Portfolio 3 not only offers solid growth potential and diversification but also brings in dividend income. More importantly for me, it has the potential to significantly boost the portfolio’s overall value. 😊
Dividends
Dividends Received this week for the following companies:
Connecting the Dots II: US Economic Data and Fed Policy
Last week, I talked about how Canadian economic reports connect and impact Bank of Canada (BoC) decisions, which in turn affect investors. This week, I will dive into the American economic reports, exploring how the US Federal Reserve (Fed) uses data to shape interest rates, and what that means for us Canadian investors.
Many of these reports mirror their Canadian counterparts, but the US economy plays an outsized role in global markets—including Canada. There is a saying, ‘When the US sneezes, Canada catches a cold.’ 😊 For investors, keeping an eye on US data is crucial because Fed moves often create ripple effects that cross borders and impact our portfolios.
Understanding how the Fed uses reports like job numbers, inflation trends, and Gross Domestic product (GDP growth to set rates is key to navigating market movements. Let us look at the major US economic reports, released monthly, and explore how they influence Fed decisions and affect us as investors:
Labour Reports: JOLTS and ESS – Why Jobs Count
Let us start with labour reports like Job Openings and Labor Turnover Survey(JOLTS) and the Employment Situation Summary (ESS). These provide insight into the health of the job market. JOLTS shows how many jobs are available and how many people are quitting (a sign of confidence in finding something better!). ESS provides the unemployment rate and wage growth.
Think of job market as the heartbeat of the economy. Lots of job openings and low unemployment show strength, meaning people have money to spend, which fuels business growth—good news for investors
Economic Reports: GDP – The Big Picture of Growth
GDP measures the overall health of the economy by tracking the total value of goods and services produced. If the US economy is growing steadily, the Fed may raise rates to prevent overheating and inflation. Slower GDP growth or signs of an economic slowdown, on the other hand, could lead the Fed to hold or even cut rates to support the economy. For Canadian investors, US GDP trends matter since a strong US economy can boost demand for Canadian exports, while a slowdown may hurt it.
Inflation Reports: CPI and PCE – Why Prices Matter
When it comes to inflation, the Fed leans on two key reports: the Consumer price Index (CPI) and the Personal Consumption Expenditures (PCE). The CPI, released monthly, measures changes in the price of everyday consumer goods like groceries and gas. If CPI data shows that prices are rising quickly, it can spark inflation fears and lead the Fed to raise rates to rein in spending.
The PCE is the Fed’s preferred measure of inflation because it offers a broader view of price changes, capturing both out-of-pocket expenses and costs covered by employers, such as health insurance. The Fed pays particular attention to the core PCE. The core PCE excludes volatile items like food and energy, making it a more stable reflection of underlying inflation trends. When the PCE climbs, it reinforces inflationary pressures and strengthens the case for rate hikes. These inflation reports are key for Fed policy, giving investors a clear signal of where interest rates may head.
How the Fed Reacts to this data
The Fed does not base its decisions on a single report. It weighs a mix of data – labour, GDP, and inflation trends – to get a fuller picture of the economy. Strong job creation, steady GDP growth, and rising inflation may prompt rate hikes, while weaker growth or tame inflation could lead the Fed to hold rates or cut them.
For Canadian investors, these moves can have significant implications. Since US interest rates affect global financial conditions, a Fed rate hike can strengthen the US dollar, making Canadian exports cheaper for Americans and potentially boosting demand. This increased demand can have a positive impact on Canadian stocks. Conversely, rate cuts can weaken the US dollar, making Canadian goods relatively more expensive in USD terms, which might dampen demand and put pressure on Canadian markets.
Impact on Stock Markets and Investors
What does this mean for us as investors? When the Fed raises rates, borrowing costs rise, potentially slowing consumer spending and corporate expansion – especially in growth sectors like technology. Stocks may come under pressure, while bonds might look more appealing, leading investors to shift their money away from stocks and into bonds.
On the other hand, when the Fed cuts rates, it often spurs more spending and investment, boosting stock prices, particularly in growth industries. However, if rate cuts come amid economic weakness, it could signal trouble ahead and increase market volatility.
By understanding how these economic reports fit together, you can better anticipate market trends and adjust your investment strategy accordingly. Whether the Fed is signaling higher rates or potential cuts, staying aware of these shifts helps you make informed decisions for your portfolio.
When you are new to investing, all these economic reports – Canadian and American – can feel like a lot to digest. But once you understand how these pieces connect, you will start to see the bigger picture – and how the Fed uses this data to make the decisions they do, which in turn can impact your investment outcomes.
Now that you have a sense of how US economic data connects, let’s see what the Fed did with the latest numbers in this week’s interest rate decision – and catch up on everything else that happened this week….
Items that may only interest or educate me ….
Canadian Economic news, US Economic news, The Fed goes big, ….
Canadian Economic news
This past week’s key economic data that the BoC considers when deciding whether to raise or lower the interest rate.
Consumer price Index (CPI)
Statistics Canada’s latest CPI report shows that inflation cooled in August, with prices dipping by 0.2% after rising 0.4% in July. On a year-over-year basis, inflation slowed to 2.0%, down from July’s 2.5%, marking the slowest pace since February 2021. This drop now brings inflation in line with the BoC’s 2% target, surprising some analysts who had expected a slight decrease to 2.1%.
Taking a closer look, the ‘Alcoholic beverages, tobacco products, and recreational cannabis’ category posted the biggest monthly gain, up 0.8%, while gasoline prices slid by 2.6%. On a yearly basis, shelter costs (which include rent and mortgages) jumped 5.3%, while gasoline prices dropped 5.1%.
Core inflation, which strips out the more volatile food and energy components, also edged down by 0.1% from July but remained up 2.4% compared to last August.
With headline inflation now hitting the BoC’s target, the central bank can turn its attention to stimulating economic growth. This could open the door to a larger rate cut of 0.5%, to give a much-needed boost to an economy that is slowed on a per capita basis due to the higher interest rates. However, the BoC will need to tread carefully to prevent inflation from falling too low, as rates significantly below 2% could increase the risk of deflation, reduced economic activity, and pressure for further BoC intervention.
Canadian market volatility
Canada’s Volatility Index (CVIX) started the week at 13.21, spiked to 14.68 following the Fed’s decision to lower the US interest rate, and then quickly dropped below 11, ending the week at 10.23. The volatility index was relatively stable for most of the week, except for that mid-week spike.
Tracked under the ticker VIXI on the Toronto Stock Exchange (TSE), the CVIX measures anticipated market volatility. Readings below 10 indicate a calm, stable market; values between 10 and 20 signal moderate volatility and typical market fluctuations, while levels above 20 suggest heightened uncertainty and increased market turbulence.
Retail Sales
On Friday, Statistics Canada reported that retail sales in July rose by 0.9%, exceeding the expected 0.6% increase and rebounding from June’s 0.3% decline. Annually, retail sales were also up 0.9%, a significant improvement from June’s modest 0.2% growth.
Breaking down the data, the ‘Other motor vehicle dealers’ subsector saw the largest monthly increase, jumping 5.6%, while ‘Electronics and appliances retailers’ experienced the biggest decline, falling 2.0%. Year over year, ‘Health and personal care retailers’ posted the most substantial gain, up 5.8%, whereas ‘Shoe retailers’ suffered the steepest drop, down 6.9%.
Core retail sales, excluding gasoline stations, fuel vendors, and motor vehicle and parts dealers, rose for the second consecutive month, increasing by 0.6% in July. This gain not only surpassed expectations but also outpaced June’s 0.3% rise. On a year-over-year basis, core retail sales grew by 0.9%, slightly down from the 1.2% increase recorded in June.
July’s retail sales surge was likely driven by the anticipation of lower interest rates, which had been on consumers’ minds for months. The BoC’s rate cuts freed up cash previously tied up in debt repayments, providing consumers with more disposable income—and it seems they did not hesitate to spend it. 😊
An early estimate for August suggests a 0.5% sales growth, though this figure may be revised as more data comes in.
US Economic news
This past week’s key data points that the Fed considers when deciding whether to raise or lower the interest rate.
Federal Open Market Committee (FOMC)
The Fed’s FOMC lowered the key interest rate by 0.5%, bringing the benchmark rate to 5.0%. For more details on this decision, see the section below titled ‘The Fed Goes Big.’
American market volatility
The CBOE Volatility Index (VIX), often referred to as the market’s “fear gauge,” started the week at 17.17, up from the previous week’s close of 16.56. It surged to 19.20 on the day of the Fed’s rate announcement before dropping to 16.15 by the week’s end. The early week volatility stemmed from uncertainty over how much the Fed would lower rates. Once the rate cut was announced, the removal of uncertainty caused volatility to drop sharply.
The VIX measures projected market volatility over the next 30 days. Levels below 12 indicate a calm market, while readings between 12 and 20 reflect normal fluctuations. A range of 20 to 30 suggests rising uncertainty, and levels above 30 signify extreme stress, often linked to major market disruptions or crises.
Retail Sales
The Commerce Department’s Census Bureau reported that retail sales rose by 0.1% in August, handily beating expectations of a 0.2% decline. This follows an upwardly revised 1.1% gain in July. Year-over-year, retail sales increased by 2.1%.
Looking closer, ‘Miscellaneous store retailers’ saw the largest gains, with sales rising 1.7% month-over-month and 10.7% annually. Conversely, ‘Gasoline stations’ experienced the steepest declines, with sales falling 1.2% from July and 6.8% from the previous year.
Core retail sales, which exclude motor vehicles, parts, and gasoline stations, rose by 0.2% in August, down slightly from July’s 0.4% increase. Annually, core retail sales were up 3.3%.
While the stronger-than-expected retail sales suggest that consumers are still spending, this data alone is unlikely to significantly influence the Fed’s upcoming rate decision.
The Fed goes big
The Fed has kicked off its long-anticipated rate cuts with a hefty 0.5% reduction, lowering the US overnight rate to 5.0%. This marks the first cut in four years, following a stretch of aggressive hikes aimed at curbing inflation. The move signals the end of the Fed’s most intense inflation-fighting campaign since the early 1980s, when inflation soared to 14.8% and interest rates shot above 20%. In contrast, today’s lower inflation environment makes this shift feel far less dramatic. 😊
The reasoning behind such a bold cut comes as inflation hits its lowest point in three years, paired with signs of a cooling economy and job market. Many analysts argued the Fed may have waited too long to act and believed a larger cut was necessary to stay ahead of potential economic weakness. The policy shift was widely expected, as inflation had eased without causing major economic damage. Still, some worried the economy had slowed more than anticipated, making this jumbo rate cut feel overdue.
Fed Chair Jerome Powell addressed these concerns in his post-meeting press conference, reassuring markets that “The US economy is in good shape. It is growing at a solid pace. Inflation is coming down. The labour market is in a strong place. We want to keep it there.” Despite Powell’s optimism, the size of the cut surprised some observers. Although inflation has cooled to 2.9%, it remains above the Fed’s 2% target, leading some to argue for a more cautious approach. In fact, the decision was not unanimous –one official dissented, favoring a smaller 0.25% reduction, marking the first non-unanimous vote in two years.
Looking ahead, most Fed officials anticipate lowering rates by another 0.5% this year, aiming for a total 1% reduction. While future cuts will hinge on evolving economic data, this bold initial move marks a significant shift in the Fed’s strategy.
When the Fed makes a large rate cut like this – from 5.5% to 5.0 – it sends ripples throughout the economy, impacting consumers, investors, and even Canadians with American investments. For consumers, lower rates mean cheaper borrowing. Whether you are considering a mortgage, car loan, or credit card, this can translate to lower monthly payments. However, if you are a saver, your savings account may earn less interest, making saving feel less rewarding.
For investors, rate cuts often boost the stock market. Lower borrowing costs allow businesses to invest more in growth, potentially driving up profits and stock prices, especially in sectors like technology and real estate. Bondholders could see gains as well since existing bonds with higher rates become more valuable when new bonds offer lower returns. Additionally, lower mortgage rates tend to stimulate the real estate market, driving more demand for homes.
Canadian investors are not left out either. A lower US rate can weaken the American dollar, which may strengthen the Canadian dollar in comparison. This could affect the value of American investments when converted back to Canadian dollars. On the flip side, a stronger US economy – fueled by cheaper borrowing – could increase demand for Canadian exports, benefiting industries like manufacturing and resources. So while the rate cut is happening in the US, its effects are likely to be felt on both sides of the border.
Overall, this bold rate cut marks a turning point in the Fed’s strategy, signaling a shift from fighting inflation to supporting the economy’s growth. For consumers, it could mean cheaper borrowing costs, and for investors, new opportunities in both stocks and bonds. Even for Canadians, the ripple effects are real, with potential impacts on currency exchange rates and exports. As the Fed continues to monitor economic data, it is a reminder that these decisions do not just happen in a vacuum – they directly shape the financial landscape and could influence your next investment move or even your monthly budget.
Weekly Market Review
Monday: another mixed day in the markets with the Nasdaq Composite Index (Nasdaq) the only index to lose ground. Investors are waiting to find out if the Fed lowers rates by 0.25% or 0.5%. Oil prices edged higher after much of the oil produced in the US gulf coast region remained offline after Hurricane Francine reached landfall last week.
In Canada, the Toronto Stock Exchange (TSX) notched its third consecutive record high, driven by a boost in commodities. Investors were betting on a Fed rate cut, which typically benefits the commodities sector. In trading, Healthcare posted the biggest gain, while Communications Services suffered the biggest loss.
In the US, the Dow Jones Industrial Average (DJIA) closed at a record high, boosted by expectations of the upcoming rate cut. The S&P 500 Index (S&P) also moved higher but was limited by declines in the Technology sector. In trading, Financials improved the most while Consumer Cyclicals and Technology were the only sectors to decline.
Tuesday: all four indexes remained near the flatline, with only the Nasdaq managing to close above it, as investors awaited the Fed’s rate decision tomorrow. Investors are confident that the Fed will lower the US interest rate but are uncertain of the size of the reduction, although many are leaning towards a 0.5% cut. Oil prices rose on supply disruptions caused by last week’s hurricane and speculation that lower interest rates will spur demand, overcoming concerns of lower demand from China.
In Canada, the TSX’s win streak came to an end as inflation fell to the BoC’s 2% target, causing investors to worry about the economy slowing too much. In trading, the Energy sector advanced the most while the Consumer Staples sector had the biggest decline.
In the US, both the S&P and DJIA briefly hit record highs in morning trading before falling into negative territory in the afternoon. The latest retail sales report indicated consumers were still willing and able to spend money. In trading, Energy posted the biggest gain while Healthcare suffered the sharpest drop.
Wednesday: the indexes spent most of the morning in the red, before a brief spike into the green on news the Fed cut the US interest rate by 0.5%, before falling back into the red at the end of the day. It seems like many investors took some profits after the recent run up and today’s brief surge. The price of oil ended lower as investors took the jumbo rate cut to indicate potential economic weakness ahead.
In Canada, the TSX was weighed down by lower oil and commodity prices. In trading, Healthcare was the big winner, while Utilities fell the hardest.
In the USA, all three indexes bounced up and down throughout the day before ending lower. In trading, the Energy and Communications Services were the only sectors to advance, while Utilities posted the largest loss.
Thursday: after digesting yesterday’s rate cut by the Fed, investors got back into the markets and sent all four indexes soaring into positive territory. Oil prices also climbed following the rate cut, driven by the expectation that lower interest rates will boost available cash, leading to increased demand.
In Canada, buoyed by the news out of the US, the TSX also set a record high close, getting a boost from higher commodity and oil prices. In trading, the Technology sector posted the biggest gain while the Utilities sector recorded the biggest loss.
In the USA, the S&P and DJIA both closed at record highs. The Nasdaq did not set a record but did post an impressive 2.5%, led by the big technology stocks. In trading, the Technology sector recorded the largest increase, while the Utilities sector suffered the biggest decline.
Friday: all four indexes pulled back from yesterday’s highs, but the TSX and DJIA were able to scramble back into the green with a last-minute push. The jumbo-sized rate cut has investors worried that the US economy is slowing more than originally thought.
In Canada, the TSX barely made it into positive territory, but it was enough to set another record high close. Stronger than expected retail sales data and higher commodity prices, particularly for gold and uranium, were the main drivers for the TSX’s gain. In trading on Bay Street, the Communications Services sector advanced the most, while the Healthcare sector had the biggest decline.
In the US, the DJIA small gain was enough for it to set another record high close. Otherwise, it was fairly uneventful day in the American markets. In trading on Wall Street, Utilities was the big winner, while the Industrials sector saw the biggest drop.
Weekly Market and Portfolio Review
For the week, the TSX (SPTSX) gained 1.3%, the S&P 500 (SPX) rose 1.4%, the DJIA (INDU) climbed 1.6% and the Nasdaq (CCMP) increased 1.5%.
Index
Weekly Streak
TSX:
2 – week winning streak
S&P:
2 – week winning streak
DJIA:
2 – week winning streak
Nasdaq:
2 – week winning streak
The first week of September might have been the worst of the year, but the second week flipped the script, delivering the best performance of 2024. With that rollercoaster behind us, everyone was on edge, wondering how this past week would unfold as investors eagerly awaited the Fed’s decision on interest rates.
As you can see in the chart above, the week started cautiously, with markets treading water as everyone held their breath for the Fed’s announcement. But everything changed midweek when the Fed unveiled a blockbuster 0.5% rate cut—its first since launching the most aggressive rate hike campaign in history back in early 2022. This dramatic cut injected fresh energy into the markets, sending all four major indexes soaring.
This rate cut, possibly the most anticipated in history, was framed as a precautionary measure to protect the economy’s resilience rather than a reaction to cooling labour and inflation data. Fed Chair Powell reassured investors, stating that the Fed now has “greater confidence” in inflation steadily moving toward its 2% target. Most Fed officials expect the rate to drop by another 0.5% by the end of the year, with two FOMC meetings left on the calendar.
In Canada, the ripple effects of the Fed’s rate cut were felt immediately. With the US as Canada’s largest trading partner, the Fed’s rate cut had an immediate positive impact on Canadian markets, reflecting the close economic ties between the two countries (the US purchases 75% of Canadian exports). This move by the Fed might even pave the way for the BoC to accelerate its own rate cuts, possibly mirroring the Fed’s bold 0.5% reduction at their next meeting.
Now that the long-awaited rate cut has arrived, it seems investors are already hungry for more rate cuts. 😊
Portfolio
Weekly Streak
Portfolio 1:
2 – week winning streak
Portfolio 2:
2 – week winning streak
Portfolio 3:
2 – week winning streak
Following the strong performance from the previous week was no easy feat, but all three portfolios managed to keep their winning streaks alive, each extending it to two consecutive weeks. Interestingly, 68% of the holdings in each portfolio posted gains, reflecting a solid week across the board.
Portfolio 1 lagged behind the other two despite some standout performers. CrowdStrike (NASD: CRWD) led the charge with a 15% gain, followed by Carnival Cruise Lines (NYSE: CCL) up 14%, Hammond Power Solutions (TSE: HPS.A) up 11%, and Lightspeed Commerce (TSE: LSPD) up 10%. However, Rivian Automotive (NASD: RIVN) weighed on the portfolio, sliding 12% and capping its overall growth.
Portfolio 2 outperformed Portfolio 1, though only slightly. The standout stocks included Hammond Power Solutions and Airbnb (NASD: ABNB), both climbing 11%. Additionally, iA Financial (TSE: IAG) reached an all-time high, further boosting the portfolio’s performance.
Portfolio 3 emerged as the top performer, increasing in value more than both the other portfolios and the indexes. This strong showing came despite not having any individual stock post a major weekly gain, underscoring the portfolio’s balanced and resilient structure.
Sure, a repeat of last week’s 3+% across-the-board growth would have been fantastic, but any week where all three portfolios increase in value is a win in my book. It’s a solid step forward, keeping the momentum alive and proving that steady wealth generation can set the stage for long-term success.
Weekly Portfolio & Index performance for the week ended September 20, 2024.
Companies on the Radar
This week, three companies appeared on my radar, though none of them are ‘new.’ These are not unfamiliar names or businesses I know little about—they are all large American companies:
Coca-Cola (NYSE: KO): A global beverage giant, best known for its flagship soft drink, Coca-Cola. They offer a wide range of non-alcoholic drinks, including sodas, juices, teas, and bottled water, catering to consumers worldwide.
IDEXX Laboratories, Inc. (NASD: IDXX): Specializing in animal health care, IDEXX develops diagnostic products and services for veterinary practices. Their offerings include tools for disease detection, medical imaging, and laboratory testing to support the health of pets and livestock.
Zoetis Inc. (NYSE: ZTS): A leading animal health company that discovers, develops, manufactures, and commercializes vaccines, medicines, diagnostics, and other technologies for both companion animals and livestock.
All three have shown steady growth in revenue and earnings per share over the last few years. While none may be ‘sexy’ stocks, they offer solid potential for steady growth and would bring diversification and balance to any of the three technology heavy portfolios.
They join the three companies already on my radar list, listed below.
Payfare Inc. (TSE: PAY), a small-cap Canadian company that provides gig workers with instant access to their earnings along with a comprehensive suite of digital banking services.
Vertiv Holdings (NYSE: VRT), a large American company that designs and builds infrastructure and continuity solutions to businesses around the world.
On Holding AG (NYSE: ONON), a medium cap Swiss company, founder-run, sports products company.
The Radar Check was last updated September 20, 2024.
Stock on the Radar List. 1 of 2.Stock on the Radar List. 2 of 2.
Portfolio Update
Portfolio 1
Portfolio 1 for the week ended September 20, 2024: UP
Amazon.com (NASD: AMZN) has mandated office workers return to work at corporate offices five days a week, beginning in 2025.
In other Amazon news, the company’s Amazon Web Services (AWS) division has contracted Intel (NASD: INTC) to build custom artificial intelligence (AI) chips for use in their datacentres.
Sea Limited (NYSE: SE) has teamed up with Alphabet’s (NASD: GOOGL) YouTube to launch a new online shopping service, starting in Indonesia and gradually expanding throughout Southeast Asia. This partnership allows consumers to purchase items they see on YouTube directly through links to Sea Limited’s e-commerce platform, Shopee.
BCE (TSX: BCE) announced they sold their 37.5% stake in Maple Leaf Entertainment and Sports (MLSE) to Rogers Communications (TSE: RCI.B) for C$4.7 billion. The purchase will make Rogers the majority owner of MLSE, the parent company of the Toronto Maple Leafs. For BCE, the infusion of cash will help them as they restructure following declining revenues from their legacy phone and news business units.
The European Union’s (EU) anti trust regulator, the European Commission (EC), has begun proceedings to ensure Apple (NASD: AAPL) complies with their ruling that the company opens up its ecosystem to competitors. The EC will spell out what Apple must do to comply with the EC’s regulations.
Activity
No significant activity to report this week.
Dividends
Dividends Received this week for the following companies:
Companies followed by DRIP (Dividend Re-Investment Plan) indicate additional shares were purchased with the dividend. Any cash leftover was added to the cash balance.
Canadian $
Yellow Pages Ltd (TSE: Y)
Decisive Dividend (TSE: DE) DRIP
US $
Alphabet Inc (NASD: GOOGL)
BSR Real Estate Investment Trust (TSE: HOM.U)
General Motors (NYSE: GM)
Quarterly Reports
No quarterly reports this past week.
Portfolio 2
Portfolio 2 for the week ended September 20, 2024: UP
The Walt Disney Company (NYSE: DIS) announced they have reached an agreement in principle with DirecTV to provide access to Disney owned networks, including ABC and ESPN, to DirecTV subscribers.
Activity
No significant activity to report this week.
Dividends
Dividends Received this week for the following companies:
Canadian $
SmartCentres Real Estate Investment Trust (TSE: SRU.UN)
iA Financial Corporation Inc (TSE: IAG)
Whitecap Resources Inc (TSE: WCP)
Supremex Inc. (TSE: SXP)
US $
No US$ dividends this past week.
Quarterly Reports
No quarterly reports this past week.
Portfolio 3
Portfolio 3 for the week ended September 20, 2024: UP
Microsoft (NASD: MSFT) announced two shareholder friendly actions. The Board of Directors approved a share buy back program of up US$60 billion which will reduce the number of outstanding shares and mean a bigger piece of the pie for shareholders. The second action was a 10% increase in the quarterly dividend, raising it to US$0.83 per share.
In other Microsoft news, the company signed a deal with Constellation Energy (NASD: CEG) to supply electricity to their datacentres in the region. To do this Constellation plans to restart one of the nuclear reactors at the Three Mile Island nuclear facility.
TD Bank (TSE: TD) announced current Chief Executive Officer Bharat Masrani will retire next year. Taking over will be Ray Chun, head of their Canadian banking division.
Activity
No significant activity to report this week.
Dividends
Dividends Received this week for the following companies:
Companies followed by DRIP (Dividend Re-Investment Plan) indicate additional shares were purchased with the dividend. Any cash leftover was added to the cash balance.
Canadian $
SmartCentres Real Estate Investment Trust (TSE: SRU.UN) DRIP
You might have noticed that I always highlight economic data in my Weekly Updates. I get it—it can seem a bit dry, and you might wonder why I make it such a priority. Honestly, before I started investing, my eyes glazed over when I saw all those reports too! 😊 But once I began to take investing more seriously, I started paying attention to what really moves the markets, especially those sharper swings.
When you are new to investing, reports like labour data, inflation stats, and economic growth figures might feel overwhelming. But once you understand how they fit together, it all starts to make sense—especially when it comes to how the Bank of Canada (BoC) makes decisions that can directly impact your investments.
Understanding these reports and their influence on interest rates and market performance is essential for building wealth and achieving your financial goals. Here is a quick guide to the key economic reports and their implications for your investments:
1. Labour Force Survey (LFS)
The LFS is like the ultimate health check for the Canadian job market. Every month, it tells us how many jobs are being created, how many people are unemployed, and how engaged the workforce is. A booming job market usually signals that the economy is thriving, while rising unemployment might be a warning sign. The BoC closely tracks this data to decide if the economy needs a push in the form of lower rates – or a break with a rate hike.
2. Gross Domestic Product (GDP)
Think of GDP as the scoreboard for the economy. Released quarterly, it shows the total value of goods and services produced, offering a snapshot of economic health. GDP grows in two ways. First, when more people enter the workforce, they contribute to the economy by producing more, boosting GDP through increased output and consumer spending. Second, even with the same number of workers, GDP can rise if workers become more productive—thanks to new technology or skills, for example. This combination of growth through workforce and productivity drives economic expansion.
While a rising GDP usually signals a healthy economy, the story is not always that simple. In Canada, recent GDP growth has been somewhat misleading due to a surge in immigration. Although the economy is expanding, GDP per capita – the economic output per person – is actually shrinking. This suggests that productivity may be slipping, potentially leading to a lower standard of living for many Canadians, despite the headline growth. The Bank of Canada keeps a close eye on these figures as they assess whether adjustments to interest rates are needed to maintain a balanced and sustainable economy.
3. Inflation Reports (CPI and PCE)
Inflation is like a hidden force that impacts everything—from your grocery bill to the value of your investments. To monitor inflation, two key reports come into play: the Consumer Price Index (CPI) and the Personal Consumption Expenditures (PCE) Price Index. The CPI, released monthly, tracks price changes for essentials like food, gas, and rent. When the CPI goes up, inflation is rising, and your money does not stretch as far.
The PCE Price Index, although more relevant in the US, is another important measure. It tracks price changes but also includes costs not directly paid by consumers, like employer-provided health insurance. While CPI focuses more on out-of-pocket costs, PCE offers a broader view of overall spending. The BoC mostly uses CPI to guide its policies, while the US Federal Reserve (Fed) leans on PCE. Together, these reports help shape how the BoC gauges inflation and adjusts interest rates accordingly.
How the Bank of Canada Reacts:
The BoC does not react to just one data point. They weigh job reports, GDP growth, inflation trends and other data to get a full picture. If the economy is heating up – with strong job creation, climbing GDP, and rising inflation – they might raise interest rates to cool things down. Higher rates make borrowing more expensive, slowing spending and helping control inflation.
When the economy is growing steadily and inflation is in check, the BoC might hold rates steady to avoid disrupting the balance. But if the economy falters – whether GDP growth slows, inflation dips, or unemployment rises – they could lower rates. Lowering rates encourages spending and investment by making borrowing cheaper, giving the economy a needed boost.
Impact on Stock Markets and Investors
So, how does all this affect your investments? When interest rates rise, borrowing costs go up, making it harder for companies – especially high-growth sectors like technology – to expand, which can push stock prices down. Bonds also become more attractive, causing some investors to shift money out of stocks.
Steady rates create stability, which is generally good for the stock market because it gives businesses and investors more confidence.
But when the BoC cuts rates, it is like giving the economy a shot of adrenaline. Lower borrowing costs encourage consumers to spend and businesses to expand, often leading to rising stock prices. Investors also find stocks more appealing since bonds offer lower returns in a low-rate environment. However, if rates are being cut because the economy is struggling, it might hint at underlying issues that could weigh on stock performance.
As an investor, understanding how these reports tie together helps you anticipate market trends and adjust your strategy. If the BoC is likely to raise rates, you might brace for some short-term volatility. If they are about to cut rates, it could be a signal for growth stocks and more opportunities for gains.
Now that we have covered the basics of these key economic reports and their role in shaping the markets, it is time to see how events of the past week played out. The previous week was all about labour data, but this time, inflation took center stage. Let’s take a look at how things unfolded this past week…
Items that may only interest or educate me ….
Canadian Economic news, US Economic news, Has the Magnificent 7 lost a member, ….
Canadian Economic news
This past week’s key economic data that the BoC considers when deciding whether to raise or lower the interest rate.
Canadian market volatility
Canada’s Volatility Index (CVIX) started the week at 13.21, hovered around the 12.0 mark for most of the week, and then dipped to 10.12 at the end of the week. This sharp drop in volatility likely reflects positive market reactions to the latest US inflation report, which showed continued easing, along with expectations of an upcoming rate cut in the US. Additionally, the growing optimism that both Canada and the US may achieve ‘soft landings’—where inflation returns to 2% without triggering a recession—helped calm market nerves.
Tracked under the ticker VIXI on the Toronto Stock Exchange (TSE), the CVIX measures anticipated market volatility. Readings below 10 indicate a calm, stable market; values between 10 and 20 signal moderate volatility and typical market fluctuations, while levels above 20 suggest heightened uncertainty and increased market turbulence.
US Economic news
This past week’s key data points that the Fed considers when deciding whether to raise or lower the interest rate.
Consumer price Index (CPI)
The August CPI report showed inflation rising by 0.2% month over month, matching expectations and maintaining the same pace as July. On an annual basis, all items, or headline, CPI came in lower than anticipated at 2.5%, the slowest annual increase since February 2021, down from July’s 2.9%. Analysts had forecasted a 2.6% rise, so this was a positive surprise.
The biggest monthly increase was seen in ‘Transportation services,’ which jumped 0.9%, while ‘Utility (piped) gas service’ recorded the steepest decline, falling 1.9%. Year over year, ‘Transportation services’ led with a 7.9% price surge, and ‘Fuel oil’ saw the largest price drop, plunging 12.1%, thanks to lower oil prices.
Core CPI, which strips out volatile food and energy costs, increased by 0.3%, slightly higher than both July’s 0.2% rise and market expectations. Year over year, core CPI landed at 3.2%, the same pace as July and in line with predictions.
In short, the August inflation report was a mixed bag. Headline inflation continues its downward trend, but core inflation ticked up on a monthly basis and remains above 3% annually. As a result, the chances of a 0.5% rate cut by the Fed next week now seem slim. Many investors had been hoping for a 0.5% cut, but this report likely dampens those expectations, leaving them to settle for a 0.25% reduction – something they would have been happy with just a few months ago.
American market volatility
The CBOE Volatility Index (VIX), often referred to as the market’s “fear gauge,” surged to 21.37 at the start of the week before steadily dropping to close at 16.56. This 20% decline in the VIX likely stems from the latest CPI report showing further declines in inflation, reinforcing expectations that the Fed is steering the economy toward a soft landing. The anticipation of an upcoming rate cut, expected to be between 0.25% and 0.5%, also contributed to calming investor sentiment.
The VIX measures projected market volatility over the next 30 days. Levels below 12 suggest a calm market, while readings between 12 and 20 indicate normal fluctuations. A range of 20 to 30 reflects rising uncertainty, and levels above 30 signify extreme stress, often associated with major market disruptions or crises.
Consumer Sentiment Index (CSI)
The University of Michigan’s preliminary CSI for September showed an encouraging rise, marking the second consecutive monthly increase. The index came in at 69, a five-month high, beating both the forecast of 68 and August’s reading of 67.9. For comparison, it was 67.8 in September 2023.
Breaking down the components, the Current Economic Conditions index, which reflects how consumers feel about their present financial situation and the broader economy, rose to 62.9 from 61.3 in August, though it remains below last year’s 71.1. Meanwhile, the Index of Consumer Expectations, which measures the economic outlook for the next 6 to 12 months, climbed to 73.0, up from 72.1 in August and significantly higher than the 65.7 recorded a year ago. These gains suggest growing optimism both in current conditions and future prospects, offering a snapshot of consumer confidence.
The improved CSI reflects expectations that inflation will continue to ease, and prices will stabilize. Year-ahead inflation expectations fell for the fourth straight month, reaching 2.7%—the lowest since December 2020 and well within the 2.3-3.0% range seen before the pandemic. Although more consumers believe the Democrats will win the upcoming election, there’s still considerable uncertainty surrounding the outcome, which may temper some of their optimism. Nevertheless, many remain hopeful about near-term economic improvements.
Has the Magnificent 7 lost a member?
The term ‘Magnificent 7’ first came into play in 2023, referring to a powerhouse group of technology stocks: Amazon.com (NASD: AMZN), Apple (NASD: AAPL), Alphabet (NASD: GOOGL), Meta Platforms (NASD: META), Microsoft (NASD: MSFT), Nvidia (NASD: NVDA), and Tesla (NASD: TSLA). While most of these companies are widely recognized as tech giants, Tesla stands out as a bit of an anomaly.
Despite its inclusion in this elite group, Tesla’s performance this year diverges from the trend seen with its peers. As of September 13, Tesla’s stock is down over 7%, whereas the other six companies have collectively risen by an average of 35%, with Nvidia leading the pack with a remarkable 140% gain. This divergence prompts a closer look at Tesla’s identity: is it truly a tech company, or is it fundamentally a car company?
Is Tesla a Car Company or a Tech Company?
Tesla operates at the intersection of automotive and technology worlds, making its classification challenging. Although it might initially appear to be a traditional car manufacturer, there is much more beneath the surface. Let us examine both perspectives to determine where Tesla really fits.
At first glance, Tesla appears to be a traditional car manufacturer in several ways. A sizable portion of Tesla’s revenue stems from selling electric vehicles (EV), including popular models like the Model 3, Model S, Model X, Model Y, and the recently released Cybertruck. Upcoming models such as the Roadster further emphasize its automotive focus. Tesla is often compared to legacy carmakers like Ford, GM, and Toyota, with its success frequently measured by vehicle sales. Additionally, Tesla’s Gigafactories, which produce vehicles on a massive scale, resemble traditional automotive production facilities.
However, Tesla’s story extends beyond traditional boundaries. Looking under the hood (😊), reveals its technological edge. Tesla is a leader in the quest for fully autonomous vehicles, utilizing advanced artificial intelligence (AI) through its Full Self-Driving (FSD) software. Beyond its automotive offerings, Tesla has expanded into energy products, including solar panels and battery storage systems, broadening its role beyond the automotive sector. Unlike traditional cars, Tesla vehicles benefit from over-the-air software updates, a feature typically associated with tech products rather than conventional automobiles. Moreover, Tesla’s substantial investment in areas such as AI, battery technology, and sustainable energy highlights its deep dive into technological innovation, often overlooked by traditional car manufacturers.
So, What Is Tesla?
While Tesla might resemble a car company at first glance, its operations and innovations place it firmly in the tech sector. Its dual focus on transformative technologies and energy solutions highlights its broader impact, redefining multiple industries beyond just automobiles. Ultimately, I feel Tesla is a tech company that happens to manufacture cars, leveraging its technological prowess to drive future industry evolution.
Revisiting the Magnificent 7
Given Tesla’s mixed profile and, more importantly, its underperformance compared to its tech-focused counterparts, the debate about its place in the Magnificent 7 is gaining traction. While Tesla’s innovations are undeniable, its core business and recent share price performance may warrant a reconsideration of its status. Could it be time to rebrand the Magnificent 7 as the Magnificent 6, reflecting a purer focus on high growth, technology-driven stocks?
Weekly Market Review
Monday: it was great to see the markets rebound from the previous week’s losses, the worst week of 2024, and all four indexes – the Toronto Stock Exchange Composite Index (TSX), the S&P 500 Index (S&P), the Dow Jones Industrial Average (DJIA), and the Nasdaq Composite Index (Nasdaq) – gain at least 1% during the session. Oil prices climbed amid concerns over potential supply disruptions at US oil refineries, as a hurricane threatened to hit the Gulf Coast, a key region for American energy production.
In Canada, the TSX broke a five-day losing streak as investors snapped up stocks that had been beaten down last week. In trading, in general it was good day for the TSX, led by the Healthcare sector. The Energy sector was the only sector to end lower, despite the higher price for oil.
In the US, bargain hunting investors push all three American indexes higher as investors await the latest inflation data for clues to how big of a rate cut the Fed will make later this month. All sectors ended the day higher, led by Consumer Staples, with Communications Services trailing the pack.
Tuesday: it was a choppy day in the markets with the TSX and DJIA ending in the red, while the S&P and Nasdaq managed to end the day in the green. Investors are focused on tomorrow’s US inflation report, the last major economic report before the Fed’s meetings next week. A lowered demand growth forecast for oil caused the price of oil to fall to its lowest level since December 2021.
In Canada, lower oil prices were the main reason the TSX ended lower. In trading, Basic Materials (miners and fertilizer manufacturers) advanced the most, while Energy lost the most.
In the US, investors hunkered down, waiting for tonight’s presidential debate and tomorrow’s CPI report. Bank stocks tumbled after JP Morgan (NYSE: JPM) warned about possible lower income in future earnings. In trading, Consumer Cyclicals posted the biggest advance, while Energy saw the biggest decline.
Wednesday: the indexes were trending downward until the release of the US CPI report. Following the release of the mixed inflation data, the indexes reversed course sending all four into positive territory by the end of the day. Due to higher-than-expected core CPI data, investors now anticipate the Fed will lower rates by 0.25%. Oil prices edged higher as worries over shrinking US inventories and potential production delays outweighed fears of weakening demand.
In Canada, the TSX rode the tailwinds of the US inflation report to a two-week high. In trading, Consumer Cyclicals led a broad-based rally that saw only the Communications Services sector end lower.
In the US, the presidential debate was light on policies that could sway independent voters or the markets. In trading, Technology posted the biggest daily gain, while the Energy sector declined the most.
Thursday: all four indexes ended higher following yesterday’s CPI report that showed inflation continued to cool. Oil prices rose after Hurricane Francine battered southern Louisiana, possibly disrupting US oil production and supply.
In Canada, higher commodity prices, especially the price of gold, lifted the TSX to a record high close. In trading it was another day of broad-based gains, led by the Basic Materials sector. Healthcare was the only sector to end in the red.
In the USA, the Producer Price Index (PPI) data came in higher than expected, all but confirming the Fed will cut the interest rate by 0.25% and the economy will have a soft landing. Technology companies are back in favour as the S&P and Nasdaq recorded their fourth straight day of gains. In trading, all sectors ended in the green led by Communications Services, with Financials trailing the pack.
Friday: the indexes jumped on speculation that a 0.5% rate cut by the Fed was still a possibility. Oil prices inched higher as investors gauged the impact of damage caused by Hurricane Francine on output from the Louisiana coast.
In Canada, the TSX hit a new all-time high for the second consecutive day, driven by anticipation of next week’s Fed rate cut and rising commodity prices. The index posted its strongest weekly performance since October 2023, led by gains in the Healthcare sector, while on the downside, Consumer Staples saw the largest losses.
In the US, investors are betting on nearly even odds that the Fed will implement a 0.5% interest rate cut, following comments from a former Fed official suggesting there is a strong case for the larger reduction. This speculation and growing optimism fueled the Nasdaq’s best weekly performance of the year. In trading on Wall Street, all sectors advance led by the Utilities sector, while Healthcare brought up the rear.
Weekly Market and Portfolio Review
For the week, the TSX (SPTSX) increased 3.5%, the S&P 500 (SPX) rose 4.0%, the DJIA (INDU) advanced 2.6% and the Nasdaq (CCMP) jumped 6.0%.
Index
Weekly Streak
TSX:
1 – week winning streak
S&P:
1 – week winning streak
DJIA:
1 – week winning streak
Nasdaq:
1 – week winning streak
After a rocky start to September, with all major indexes falling by more than 2%, I thought this month might erase August’s gains. Fortunately, a much needed rebound saw each index climb over 2.5% this past week, providing some welcome relief.
The previous week, markets were rattled by worse-than-expected labour data, which weighed heavily on investor sentiment. This week, the focus shifted to inflation. Investors closely analyzed the latest inflation report for clues on whether the Fed would lower US rates by 0.25% or 0.5% at their upcoming meeting. A favourable report, showing inflation continues to slow, followed by stronger-than-expected PPI data, led many to feel that a 0.25% rate cut was almost certain. These reports also bolstered confidence that the economy was on track for a “soft landing.” However, at the end of the week, a former Fed official suggested there was a “strong case for a 50 [0.5%]” rate cut, reigniting speculation about a larger reduction.
In Canada, the TSX hit consecutive record highs, buoyed by optimism surrounding the anticipated US rate cut, confidence in the Canadian economy’s own path to a soft landing, and rising commodity prices.
All eyes are now on next week’s Federal Open Market Committee (FOMC) meeting. Investors are anxiously awaiting the size of the rate cut and the Fed’s outlook for further reductions throughout the rest of 2024. After months of speculation, the key questions remain: how large the upcoming cut will be, and what the pace of future reductions might look like. In a perfect world, the Fed will opt for the bigger 0.5% cut and leave the door open for further cuts. 😊
Portfolio
Weekly Streak
Portfolio 1:
1 – week winning streak
Portfolio 2:
1 – week winning streak
Portfolio 3:
1 – week winning streak
After last week’s debacle, it was a relief to see all three portfolios rebound with gains of over 3.5%, as highlighted in the chart below. Portfolio 1 stood out, with 75% of its holdings posting gains, led by an 18% jump from Hammond Power Supply (TSE: HPS.A) and a notable 10% increase in Nvidia’s value. As Nvidia is the largest holding by both share count and portfolio weight, its surge played a pivotal role in driving Portfolio 1’s outperformance, helping it surpass the gains of the other portfolios and all of the indexes. 😊
Portfolio 2 also rebounded, driven by Hammond Power Solutions’ outstanding 18% jump and Guardant Health’s (NASD: GH) 12% rise. A solid performance that saw 72% of the holdings advance helped Portfolio 2 get back in the winner’s circle.
Meanwhile, Portfolio 3 posted a strong 5.5% gain, which on any other week might have secured top honours. However, it had to settle for second place behind Portfolio 1’s breakout week. With 86% of its holdings in the green, Portfolio 3 was buoyed by a 10% gain from Lithium Americas (Argentina) (TSE: LAAC).
Overall, it was a great week, with each portfolio not only recovering from the previous week’s losses but exceeding them. As Oliver Twist might say, “Please, sir, I want some more!” 😊
Weekly Portfolio & Index performance for the week ended September 13, 2024.
Companies on the Radar
This week, I did not spot any new companies that caught my eye. However, I decided to remove Equitable Bank (TSE: EQB) from my radar. With Canadian banks and other financial sector names already represented in all three portfolios, it made sense to clear some space on my radar. If I were to add another financial sector player, Equitable would be at the top of the list.
For now, my Radar List is down to the three companies listed below.
Payfare Inc. (TSE: PAY), a small-cap Canadian company that provides gig workers with instant access to their earnings along with a comprehensive suite of digital banking services.
Vertiv Holdings (NYSE: VRT), a large American company that designs and builds infrastructure and continuity solutions to businesses around the world.
On Holding AG (NYSE: ONON), a medium cap Swiss company, founder-run, sports products company.
The Radar Check was last updated September 13, 2024.
Stock on the Radar List. 1 of 2.Stock on the Radar List. 2 of 2.
Portfolio Update
Portfolio 1
Portfolio 1 for the week ended September 13, 2024: UP
At its annual new product unveiling, Apple showed its latest smartphone, the iPhone 16, with Apple’s version of AI, called Apple Intelligence, integrated into the new devices. The company also revealed their latest watches and AirPods.
Amazon has unveiled plans to invest a massive US$10.45 billion over the next five years to expand, maintain, and operate data centers in the United Kingdom. Additionally, they will pour 10.1 billion reais into Brazil over the next decade to boost their data center infrastructure there. With surging demand for AI and other technologies, Amazon is building out their infrastructure to meet the growing need for enhanced data capabilities across key global markets.
General Motors (NYSE: GM) and Hyundai Motors (OTCM: HYMTF) are investigating ways that the two companies can work together on the co-development of “passenger and commercial vehicles, internal combustion engines and clean-energy, electric and hydrogen Technologies.”
Activity
No significant activity to report this week.
Dividends
Dividends Received this week for the following companies:
Canadian $
No C$ dividends this past week.
US $
Skyworks Solutions (NASD: SWKS)
Home Depot (NYSE: HD)
Quarterly Reports
No quarterly reports this past week.
Portfolio 2
Portfolio 2 for the week ended September 13, 2024: UP
After being rejected in their bid to become the largest operator of convenience stores, Alimentation Couche-Tard (TSE: ATD) said they were prepared to have further confidential conversations with Seven & i Holdings (OTCM: SVNDY) to see if a deal can be reached.
TC Energy’s (TSE: TRP) deal to sell its Canadian natural gas pipeline system to a group of Indigenous communities has been delayed because of transaction structuring issue. The sale is part of TRP’s plan to reduce it debt load and help finance future opportunities.
In other TRP news, the company was fined C$590,000 by the British Columbia Environmental Assessment Office for deficient erosion and sediment control measures along their pipeline construction route.
Microsoft is planning to let go 650 employees in their Xbox division as they attempt to integrate their purchase of Activision Blizzard and lower their expenses.
in other Microsoft news, the company named former GE chief financial officer Carolina Dybeck Happe as its chief operations officer.
Activity
No significant activity to report this week.
Dividends
Dividends Received this week for the following companies:
Portfolio 3 for the week ended September 13, 2024: UP
Brookfield Asset Management (TSE: BAM) announced they will invest up to US$1.1 billion in Infinium, a private company pioneering ultra-low carbon electrofuels (eFuels). This partnership aims to accelerate the development of sustainable aviation fuel, which has the potential to slash greenhouse gas emissions by an impressive 90% compared to conventional jet fuels. If successful, this could be a game-changer for the aviation industry’s carbon footprint and a big step toward a greener future.
Elsewhere in the Brookfield universe, BAM announced their real estate arm would be selling its Brazilian shopping malls to focus on office towers and apartment buildings, as well as logistics.
TD Bank (TSE: TD) has been ordered by an American regulator to pay nearly US$28 million after it was found to have repeatedly provided inaccurate and negative information about its customers to credit reporting agencies, potentially damaging their credit scores.
Activity
No significant activity to report this week.
Dividends
Dividends Received this week for the following companies:
 At one point, markets tumbled 8.5%, flirting with correction territory (a correction occurs when an index or stock drops 10% or more from its recent peak). However, the storm passed quickly, and markets regained their footing, finishing the quarter on a high note. All four major indexes moved higher by the end of September, with the S&P 500 (S&P) and Nasdaq Composite Index (Nasdaq) logging their fourth straight quarter of gains, even hitting new all-time highs. Leading the charge was the Dow Jones Industrial Average (DJIA), which surged 8.2% and set multiple records. The roller-coaster ride sent the volatility index (VIX) to its highest level since 2020, adding some extra drama to the quarter.
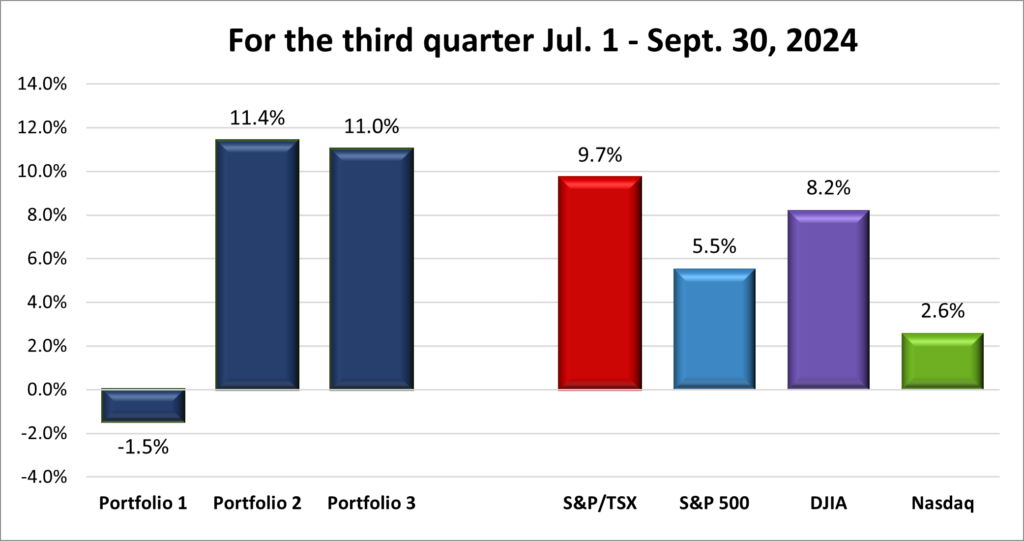
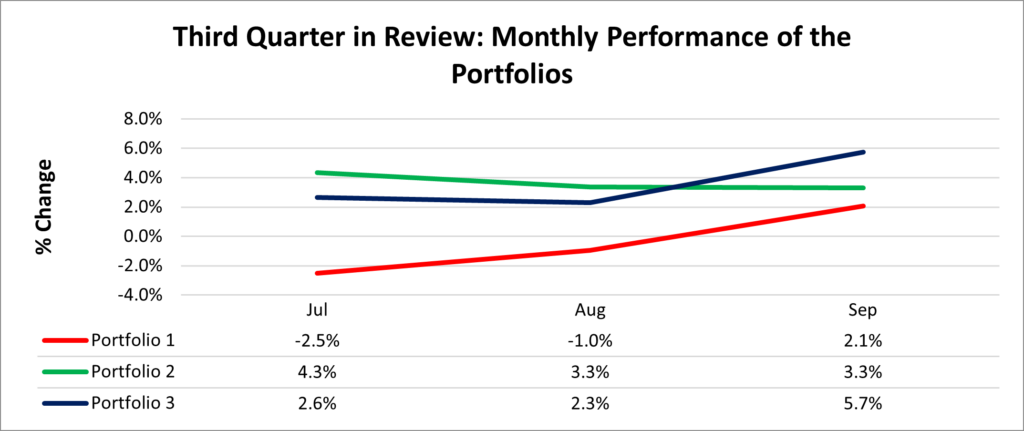

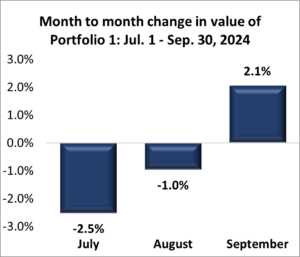

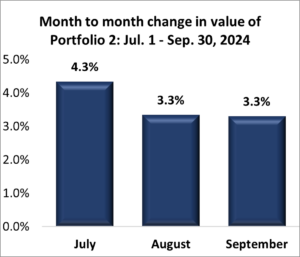
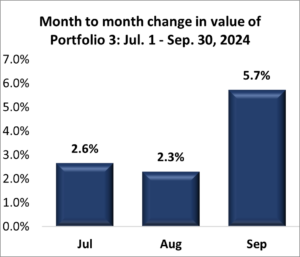
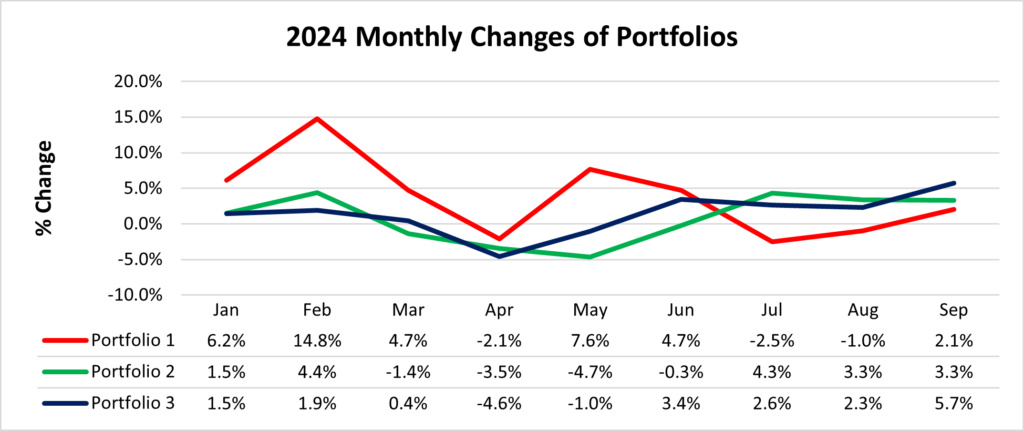
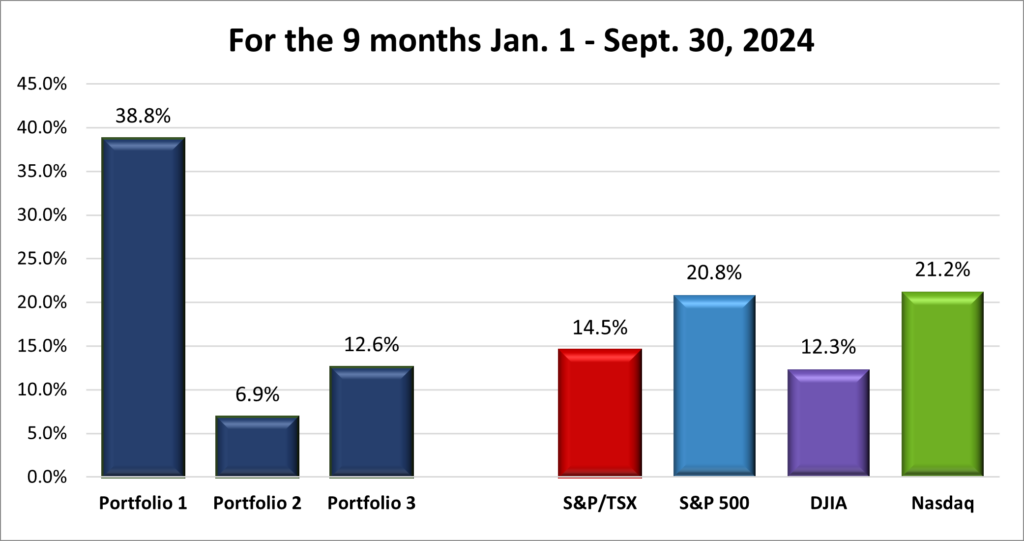

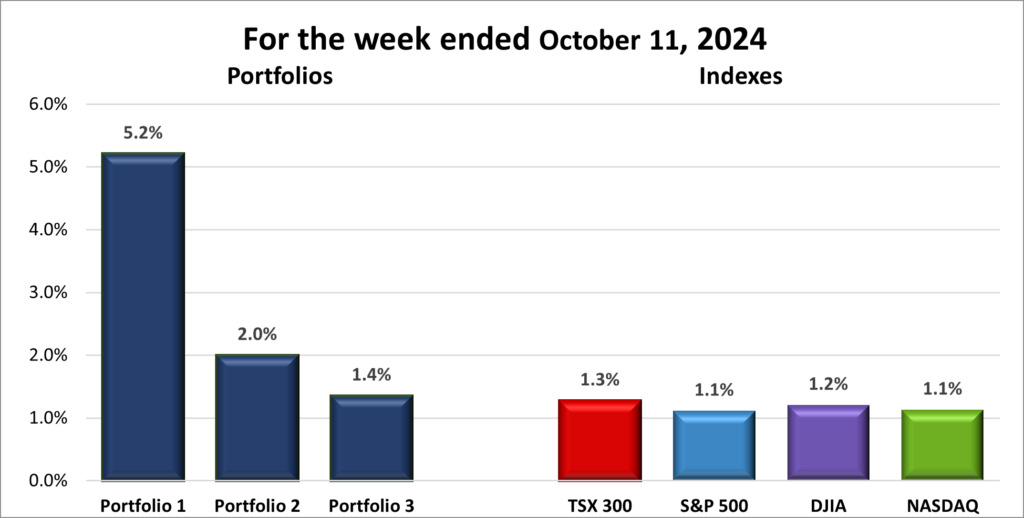
 Another week with no new additions to my radar list—though I am not actively hunting for fresh opportunities right now. That said, if the markets take a sharp dip, I will be looking to either add to my current holdings or jump on one of the companies listed below.