The September Roller Coaster
September has a long-standing reputation for being one of the worst and most turbulent months for the markets, often marked by increased volatility. This phenomenon is often referred to as the “September Effect.” This year appears to be no exception as investors try to gauge the Federal Reserve’s next moves based on the latest economic data. Historically, it has been the worst-performing month for the indexes. In fact, from 1950 to 2023, the S&P 500 (S&P) averaged a decline of about 0.5% in September, making it one of the few months where the index consistently posts negative returns.
Several notable market crashes have occurred during September. In 1929, the Dow Jones Industrial Average (DJIA) saw sharp losses leading up to the Great Depression, with September’s declines setting the stage for the infamous October crash. More recently, in 2001, the 9/11 terrorist attacks led to a sharp drop in stock prices when markets reopened. In 2008, the collapse of Lehman Brothers triggered the global financial crisis, with September being one of the most turbulent months that year.
Several factors contribute to September’s volatility. Many mutual funds close their fiscal year during this month, prompting portfolio rebalancing, selling off underperforming stocks, and locking in gains, which adds selling pressure. Additionally, critical economic data and earnings reports released in September shape market sentiment, often leading to swift market moves. After the quiet summer trading season, activity ramps up as professional traders return, further intensifying volatility. Moreover, the perception of September as a “bad month” can become a self-fulfilling prophecy, with skittish investors selling or hedging positions, amplifying market movements.
Though September is primarily known for declines, there have been exceptions during strong bull markets, though these instances are rarer.
In summary, September’s volatility stems from a blend of fiscal rebalancing, crucial economic reports, and investor psychology. With its history of market swings and downturns, even minor news can spark nervous reactions, reinforcing its reputation as a tough month for investors. So, buckle up and hang on – it is time for what is typically a wild and woolly roller coaster ride! 😊
Let’s take a closer look at the start of the September roller coaster and see how the market’s ride has played out so far ….
Items that may only interest or educate me ….
Canadian Economic news, US Economic news, ….
Canadian Economic news
This past week’s key economic data that the Bank of Canada (BoC) considers when deciding whether to raise or lower the interest rate.
Bank of Canada rate decision
As widely anticipated, the BoC lowered its benchmark interest rate by 0.25%, bringing it to 4.25%. This marks the third consecutive cut of the same size. The BoC highlighted the absence of significant inflationary pressure and signaled more rate cuts could be on the horizon as long as inflation continues its downward trend.
Governor Tiff Macklem also suggested a larger cut could be on the table if necessary, stating, “If we need to take a bigger step, we’re prepared to take a bigger step.” He emphasized the need to guard against the risk of an overly weak economy that could cause inflation to fall too low.
The BoC is increasingly concerned about the steady slowdown in the economy, which could push inflation below their target of 2%. While inflation below 2% might not seem worrisome at first, it can signal underlying economic weakness, potentially leading to slower growth, reduced investment, and deflation risks.
However, for consumers, businesses, and investors, this latest rate cut is good news. Lower interest rates generally stimulate economic activity by making borrowing more affordable. Consumers benefit from cheaper credit, businesses see reduced financing costs, and investors often enjoy higher stock prices and improved returns. Ultimately, lower interest rates can act as a catalyst for economic growth.
Labour Force Survey (LFS)
Statistics Canada’s August Labour Force Survey revealed that the economy added 22,000 jobs, slightly below the expected 25,000 after shedding 2,800 positions in July. Most of the job gains were part-time, up 1.8%, while full-time positions dipped by 0.3%. The public sector saw a slight monthly decline of 0.2%, while the private sector grew by 0.3%. On a year-over-year basis, public sector employment surged by 4.3%, outpacing the private sector’s 1.0% growth – raising concerns, particularly as the private sector ultimately funds the public one.
The unemployment rate rose to 6.6%, surpassing the anticipated 6.5% and marking the highest level since May 2017 (excluding the COVID-19 years). There were 1.5 million unemployed in August, an increase of 60,000 from July and up 272,000 from a year ago. This rise, which has been slowly climbing since April 2023, is likely linked to increased immigration.
Wage growth also eased, with average hourly earnings rising by 5.0% annually in August, slowing from July’s 5.2% gain. As the job market softens, wage growth is also starting to slow.
Although employment increased slightly, it has remained relatively steady over the past four months. The combination of stagnant job growth and slowing wages should help ease concerns about inflation reversing course. This latest data reinforces the likelihood that the BoC will stay on course for a rate cut at their October 23 meeting, with a potential 0.5% reduction becoming increasingly plausible.
Canadian market volatility
Canada’s Volatility Index (CVIX) began the week at 10.40 and rose to 12.43 by week’s end. This increase, driven by weaker-than-expected labour data from both Canada and the US, represents a nearly 20% rise in volatility. Despite this uptick, the CVIX remains within a normal range of volatility.
Tracked under the ticker VIXI on the Toronto Stock Exchange (TSE), the CVIX measures anticipated market volatility. Readings below 10 indicate a calm and stable market, values between 10 and 20 reflect moderate volatility and normal market fluctuations, while levels above 20 signal increased volatility and heightened market uncertainty.
US Economic news
This past week’s key data points that the Federal Reserve (Fed) considers when deciding whether to raise or lower the interest rate.
Labour data
Three key reports provide a monthly snapshot of the US labour market each month: the Job Openings and Labor Turnover Survey, the ADP National Employment Report, and the Labor Department’s Employment Situation Summary. Analyzing these reports reveals trends in employment, wage growth, and potential future economic policy.
Job Openings and Labor Turnover Survey (JOLTS)
The July JOLTS report showed job openings fell to 7.67 million, down from a downwardly revised 7.91 million in June and the lowest level since January 2021. This decline was well below the anticipated 8.1 million and reduced the job openings-to-worker ratio below 1.1, a significant drop from over two openings per worker in 2022. This cooling in job openings suggests a slowing labour market, reinforcing the case for the Fed to lower the interest rates.
ADP Employment Report
The August ADP Employment Report indicated continued slowdown in private-sector hiring, with only 99,000 jobs added—well below the expected 145,000 and a decrease from July’s downwardly revised 111,000. This slowdown is consistent with broader economic trends showing a deceleration in both employment and economic activity. The ADP report, produced by the ADP Research Institute, provides an early look at private-sector employment before the official government jobs report.
Bureau of Labor Statistics’ Employment Situation Summary (ESS)
The August ESS revealed a steady but slightly slower job market, with non-farm payrolls increasing by 142,000. This was below the anticipated 160,000 but slightly above July’s 114,000. Job growth has been steady in recent months, though it remains below the yearly average of 202,000. The unemployment rate fell to 4.2%, a modest improvement from July’s 4.3%. Wages saw a positive shift, with average earnings rising by 3.8% year-over-year, up from July’s 3.6% and exceeding the expected 3.7%.
Conclusion
The August labour data paints a picture of a cooling job market, highlighted by slower job growth and a decline in job openings. Yet, the silver lining comes with strong wage growth and a slight dip in unemployment, providing a glimmer of optimism for workers. This latest data suggests the Fed is still on track for a soft landing—aiming to bring inflation back to its 2% target without triggering a recession. With these trends in mind, it seems likely the Fed will move forward with a rate cut at their upcoming meeting. The big question now is whether the reduction will be a modest 0.25% or a more substantial 0.5%.
American market volatility
The CBOE Volatility Index (VIX), often dubbed the market’s “fear gauge,” began the week at 15.0 but surged to 22.7 after Friday’s government labour report, eventually settling at 22.38. The jump in volatility was driven by weaker-than-expected labour data, particularly from the JOLTS and ESS reports, which heightened investor concerns about the economy slowing more rapidly than anticipated.
The VIX measures expected market volatility over the next 30 days. Readings below 12 suggest a calm and stable market, while values between 12 and 20 indicate normal fluctuations. Levels between 20 and 30 signal heightened volatility and uncertainty, and readings above 30 reflect extreme stress, often seen during crises.
Weekly Market Review
Monday: the stock markets in Canada and the USA were closed for the Labour Day holiday.
Tuesday: it seemed like the markets were repeating their start of August plunge as all four indexes – the Toronto Stock Exchange Composite Index (TSX), S&P, DJIA, and the Nasdaq Composite Index (Nasdaq) – ended down sharply. Investors are concerned that the upcoming US jobs data could indicate the US labour market is softer than expected. Oil prices plunged on low global demand for oil and a potential deal that would bring Libyan oil supplies back online and add to the over supply of oil.
In Canada, the TSX fell on lower oil and commodity prices. In trading, Communications Services and Healthcare were the only sectors to advance while Basic Materials (miners and fertilizer manufacturers) had the steepest drop.
In the US, Nvidia’s share price plummeted nearly 10%, wiping out approximately $279 billion in market value, the largest single-day loss ever recorded by an American company. In trading, Consumer Staples was the only sector to record a gain, otherwise it was a day of broad losses with the Technology sector getting hit the hardest.
Wednesday: after opening the day higher, most indexes ended lower, except for the DJIA, which managed to close slightly in positive territory. Investors are concerned about a slowing US economy. Oil prices fell for the third consecutive day over concerns about over supply and lower demand.
In Canada, despite another 0.25% cut to the Canadian benchmark interest rate, which gave a boost to interest sensitive sectors, lower energy prices weighed on the index. In trading, Healthcare posted the biggest gain while Energy suffered the biggest decline.
In the USA, the July JOLTS report show job openings fell to the lowest level since January 2021, suggesting the economy was slowing more than expected. In trading, Utilities rose the most while Energy dropped the most.
Thursday: another mixed day in the markets, with the Nasdaq the only index to end higher as the latest US job openings data suggests a slowing US labour market. Investors await tomorrow’s US August labour data for an indication of the size of the upcoming rate cut as well as potential signs of an economic slowdown. Oil prices rose on news of a possible delay to an increase in supply by OPEC+ member nations.
In Canada, despite a slight increase in oil prices, declining oil stocks weighed heavily on the TSX for the third straight session. In trading, Communications Services advanced the farthest while Consumer Cyclicals slipped the most.
In the US, in trading, the Consumer Cyclicals sector advanced the furthest, while Healthcare saw the biggest drop.
Friday: the markets ended the shortened week on a down note with all four indexes down sharply. Weaker than expected labour reports in both countries weighed heavily on the markets on both sides of the border.
In Canada, the poor jobs reports that saw unemployment rise in both countries sent the TSX down to its lowest point in three weeks. In trading, Communications Services and Consumer Staples were the only sectors to advance, while Basic Materials declined the most.
In the US, it was a day of broad losses, with Consumer Staples showing the smallest decline, while Communication Services took the hardest hit.
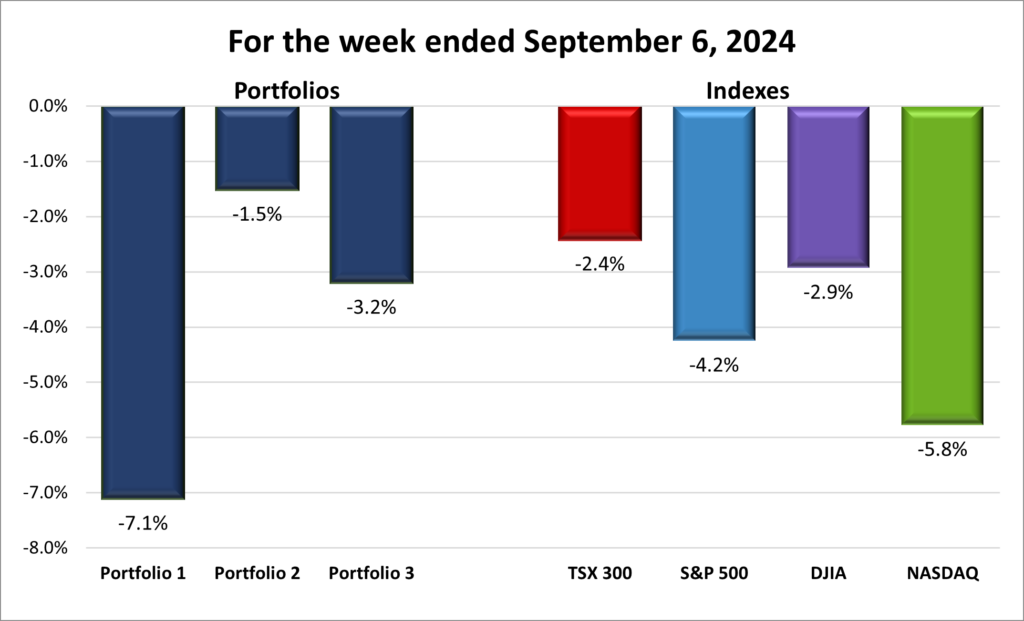
Weekly Market and Portfolio Review
For the week, the TSX (SPTSX) fell 2.4%, the S&P 500 (SPX) lost 4.2%, the DJIA (INDU) declined 2.9% and the Nasdaq (CCMP) tumbled 5.8%.
| Index | Weekly Streak |
| TSX: | 1 – week losing streak |
| S&P: | 1 – week losing streak |
| DJIA: | 1 – week losing streak |
| Nasdaq: | 2 – week losing streak |
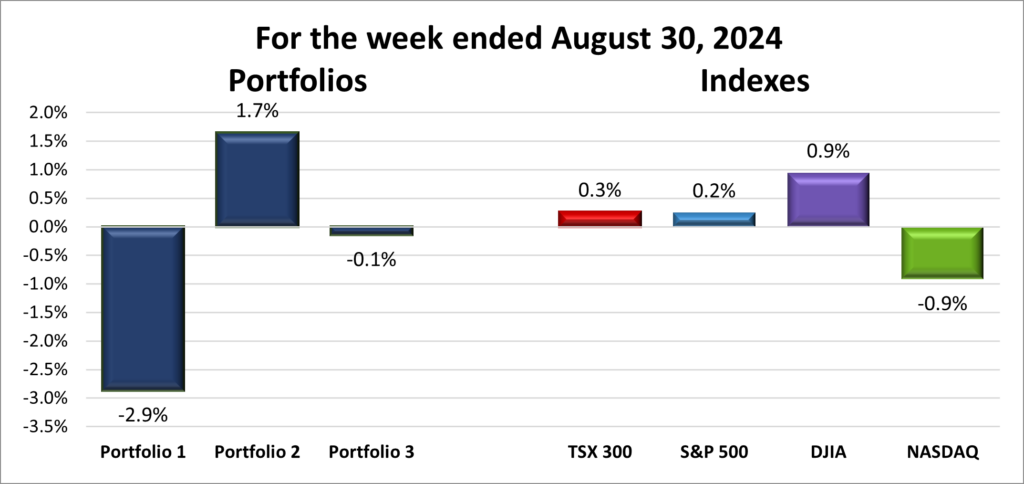
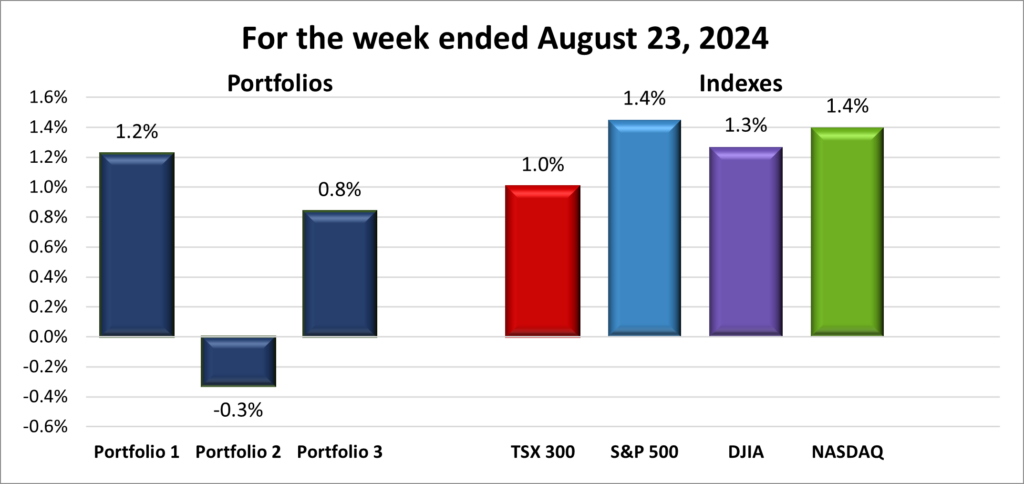
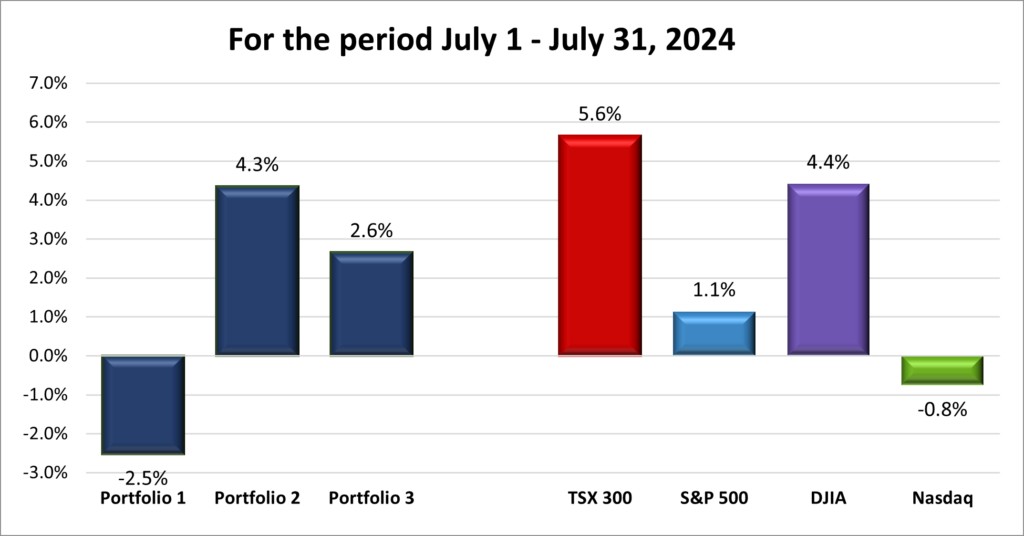
![]() September wasted no time living up to its reputation as a tough month for stocks, as illustrated in the chart above. On the first trading day, major indexes saw steep declines: the TSX, S&P, DJIA, and Nasdaq dropped by 1.3%, 2.1%, 1.5%, and 1.5%, respectively. By the week’s end, the S&P and DJIA experienced their largest weekly falls since March 2023, while the Nasdaq had its worst week since January 2022.
September wasted no time living up to its reputation as a tough month for stocks, as illustrated in the chart above. On the first trading day, major indexes saw steep declines: the TSX, S&P, DJIA, and Nasdaq dropped by 1.3%, 2.1%, 1.5%, and 1.5%, respectively. By the week’s end, the S&P and DJIA experienced their largest weekly falls since March 2023, while the Nasdaq had its worst week since January 2022.
The market turmoil was driven by multiple factors: weakening job markets in both Canada and the US, growing skepticism around the artificial intelligence (AI) boom, and the uncertainty of the upcoming U.S. election. Investors tend to shy away from uncertainty, and right now, it’s everywhere.
Adding to the tension is the debate over the Federal Reserve’s next move. Analysts and investors aren’t questioning if the Fed will lower rates, but rather by how much. Some fear the Fed’s aggressive rate hikes may have gone on too long, risking a deeper economic slowdown. Weak labour data supports the argument for deeper cuts but raises concerns that a “soft landing,” where inflation falls to the 2% target without causing a recession, might be out of reach, with recession fears creeping back in.
The biggest shock of the week came from Nvidia. The AI giant saw a record US$279 billion wiped from its market cap (number of shares outstanding X the price per share) on Tuesday—the largest single-day loss for any company in history. For comparison, Canada’s largest company by market cap, the Royal Bank of Canada, is worth C$232.2 billion. Nvidia’s sharp decline shook investor confidence in the AI sector, sending other tech stocks tumbling, especially in the Nasdaq and S&P.
Meanwhile, the approaching U.S. election, still a tight race, brings even more uncertainty. If the election mirrors the last one, with contested results lingering beyond voting day, the markets could face at least two more months of instability—adding further stress to an already volatile September.
September may be off to a rough start, just like August, but it’s still early days. Here’s hoping for a rebound as the month progresses! Fingers crossed. 😊
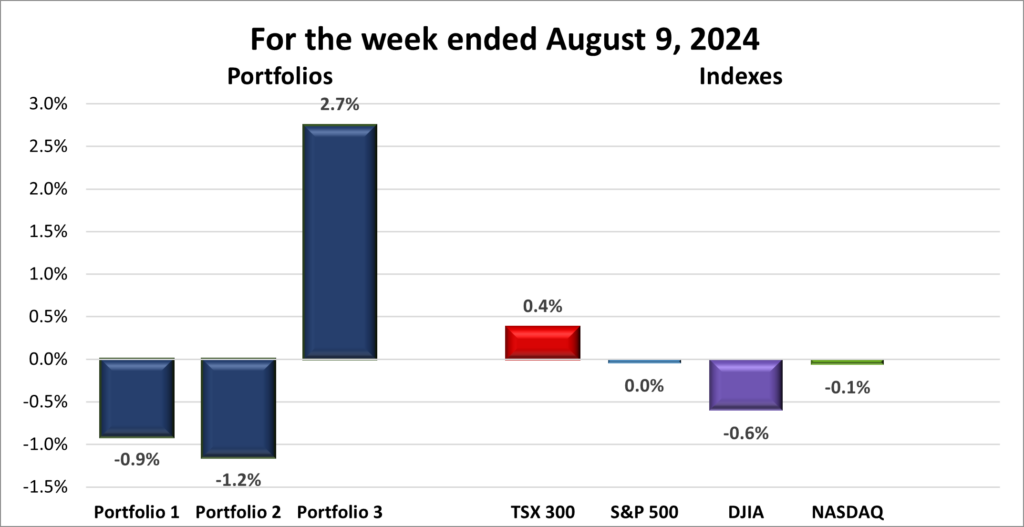
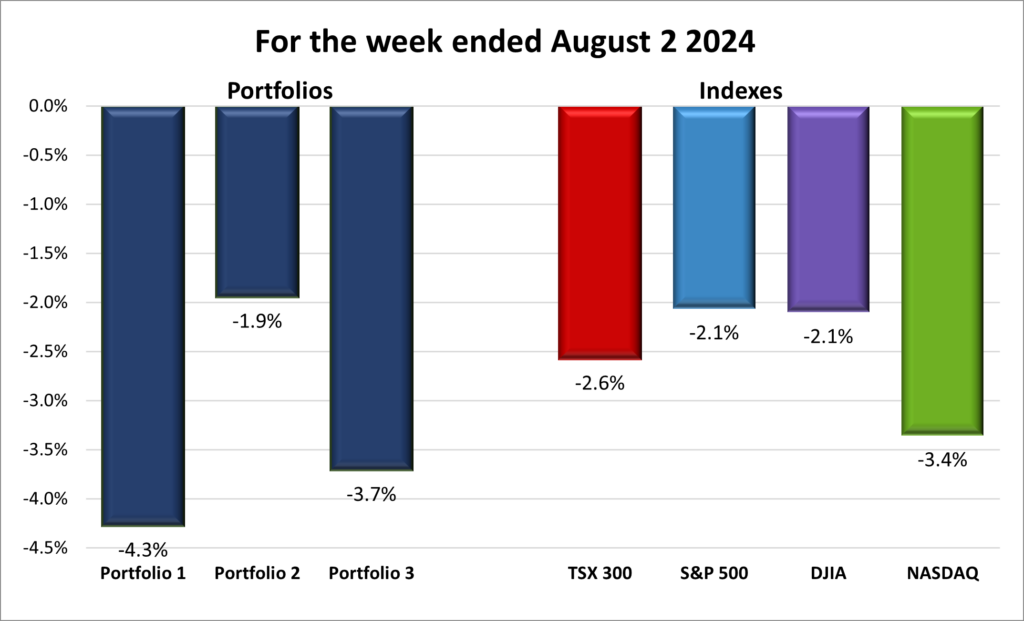
| Portfolio | Weekly Streak |
| Portfolio 1: | 2 – week losing streak |
| Portfolio 2: | 1 – week losing streak |
| Portfolio 3: | 2 – week losing streak |
![]() It was a rough week across the board, with the major indexes posting losses and dragging down all three portfolios—though some fared worse than others, as shown in the chart below.
It was a rough week across the board, with the major indexes posting losses and dragging down all three portfolios—though some fared worse than others, as shown in the chart below.
Portfolio 1 took the hardest hit, with only 20% of its holdings seeing gains. A series of sharp declines, particularly in technology stocks, contributed to the slump. Nvidia, the portfolio’s largest holding, dropped 13%, while Navitas Semiconductor (NASD: NVTS) plummeted 26%, and Celestica (TSE: CLS) fell 19%. Other notable losers included indie Semiconductor (NASD: INDI) down 16%, Celsius Holdings (NASD: CELH) off by 15%, and CrowdStrike (NASD: CRWD), International Petroleum (TSE: IPCO), and Hammond Power Solutions (TSE: HPS.A) all down 12%, and finally, Skyworks Solutions (NASD: SWKS) dropped 10%. While technology sector stocks were hit the hardest, the portfolio also significant losses in Consumer Staples (Celsius), Energy (IPCO), and Industrials (Hammond).
Portfolio 2 was the best performer of the week, though that is not saying much. 30% of its holdings managed gains, but the rest were not so lucky. Supremex (TSE: SXP) and Hammond Power Solutions each fell 12%, while Birkenstock (NYSE: BIRK) slipped 11%. If only I had waited to invest in Birkenstock. ☹
Portfolio 3 saw a performance between the other two portfolios, faring better than Portfolio 1 but not as well as Portfolio 2. As with portfolio 2, 30% of its holdings showed gains, but the biggest losers were Lithium Americas (TSE: LAC), which dropped 13%, and Lithium Americas (Argentina) (TSE: LAAC), down 11%.
All in all, it was a tough and most definitely bearish week for the portfolios. Let us hope the rest of September brings better news and fewer bumps in the road!
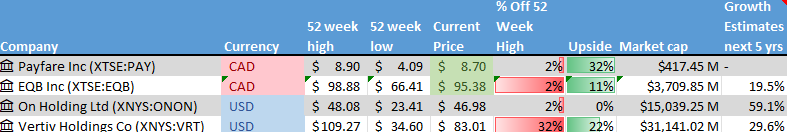
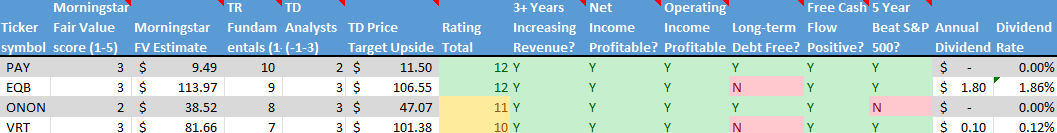
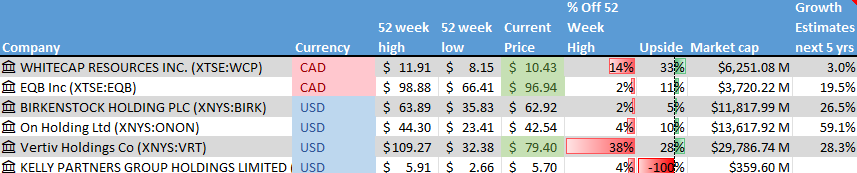
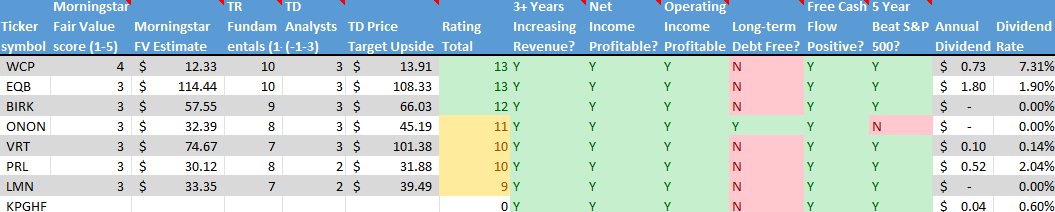
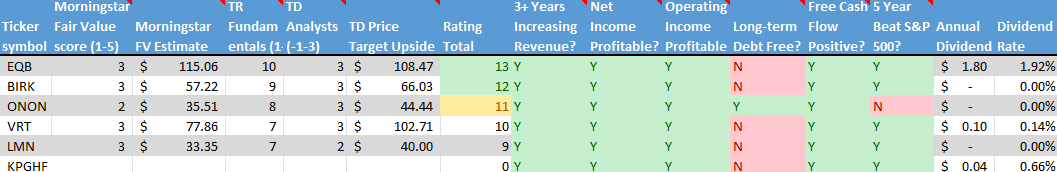
Companies on the Radar
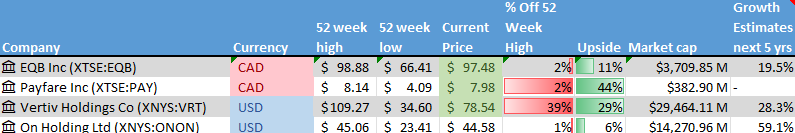
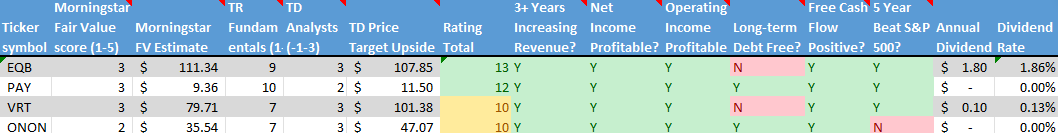
 No new companies caught my attention this past week, so my radar list remains focused on the four companies listed below.
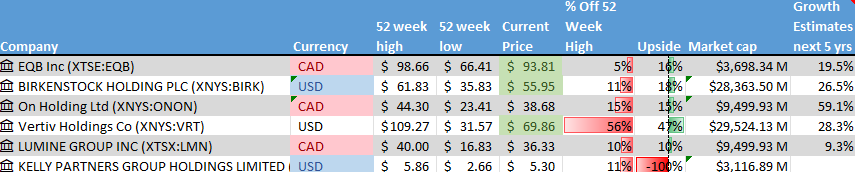
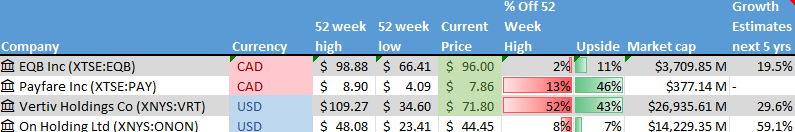
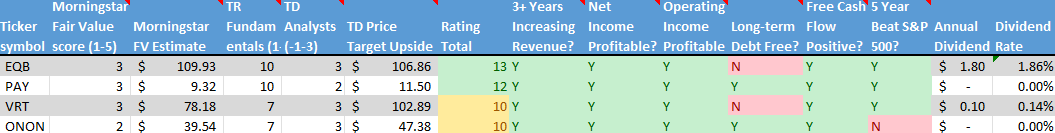
- Equitable Bank (TSE: EQB), a mid sized (when the number of outstanding shares times the shares prices is between $2 billion to $10 billion) Canadian bank, considered Canada’s 7th bank, which provides financial services to consumers and businesses.
- Payfare Inc. (TSE: PAY), a small-cap Canadian company that provides gig workers with instant access to their earnings along with a comprehensive suite of digital banking services.
- Vertiv Holdings (NYSE: VRT), a large American company that designs and builds infrastructure and continuity solutions to businesses around the world.
- On Holding AG (NYSE: ONON), a medium cap Swiss company, founder-run, sports products company.
The Radar Check was last updated September 6, 2024.
Portfolio Update
Portfolio 1
Portfolio 1 for the week ended September 6, 2024: DOWN ![]()
- Apple (NASD: AAPL) announced they plan to use organic light-emitting diode (OLED) displays for all iPhone models sold in 2025 and later, moving entirely away from liquid crystal displays (LCDs). OLEDs supposedly provide more vibrant colours and sharper contrast.
- The US Department of Justice has subpoenaed Nvidia and others in its antitrust investigation into the company, focusing on whether the chipmaker is restricting customers from switching to other suppliers and penalizing those who do not exclusively use its AI chips.
- General Motors (NYSE: GM) announced plans to start producing its first-ever hybrid-flex vehicles in Brazil, capable of running on 100% ethanol or gasoline in addition to their electric batteries.
- Alphabet’s (NASD: GOOGL) Google may find themselves before the European Union’s antitrust regulators, the European Commission, once again. Italy’s antitrust authority said the company’s refusal to allow an e-mobility app to access Google’s Android Auto platform is a possible breach of competition rules.
Elsewhere in Europe, Britain’s antitrust regulator, the Competition and Markets Authority (CMA), has conditionally found that since at least 2015 Google abused its dominant position in digital advertising to restrict competition. - PayPal (NASD: PYPL) is expanding into in-person transactions with plans to enter the point-of-sale payments space. The company aims to integrate its debit card with Apple’s mobile wallet, making it easier for users to make contactless payments. To attract customers, PayPal is offering 5% cash back on select purchases, up to $1,000 per month, along with additional rewards from popular brands.
Activity
No significant activity to report this week.
Dividends
Dividends Received this week for the following companies:
Companies followed by DRIP (Dividend Re-Investment Plan) indicate additional shares were purchased with the dividend. Any cash leftover was added to the cash balance.
Canadian $
Decisive Dividend Corp (TSEV: DE) DRIP
US $
Walmart Inc. (NYSE: WMT)
Visa Inc, (NYSE: V)
Quarterly Reports
No quarterly reports this past week.
Portfolio 2
Portfolio 2 for the week ended September 6, 2024: DOWN ![]()
- For the second consecutive year, Disney (NYSE: DIS) used its sports channels as negotiating leverage, pulling them from one of its broadcast partners. This time, DirecTV lost access to ESPN, ABC, and other channels after the two companies failed to reach a mutually agreeable deal.
- Alimentation Couche-Tard Inc. (TSE: ATD) had its bid to acquire the 7-Eleven chain from Japan’s Seven & i Holdings rejected. While Seven & i acknowledged it might consider a significantly higher offer, the company expressed concerns that the deal, which would make ATD the dominant convenience store operator, could face hurdles with U.S. antitrust regulators.
Activity
No significant activity to report this week.
Dividends
Dividends Received this week for the following companies:
Canadian $
Fortis Inc. (TSE: FTS)
US $
No US$ dividends this past week.
Quarterly Reports
Alimentation Couche-Tard Inc
First quarter 2025 financial results on September 4, 2024
Portfolio 3
Portfolio 3 for the week ended September 6, 2024: DOWN ![]()
- Brookfield Corporation (TSE: BN) is working on a deal to sell Saeta Yields, a renewable energy company with assets in Portugal and Spain, to United Arab Emirates company Masdar.
Activity
No significant activity to report this week.
Dividends
Dividends Received this week for the following companies:
No dividends this past week.
Quarterly Reports
Enghouse Systems Limited
Third quarter 2024 financial results on September 6, 2024