
October: A Month of Market Mayhem or Opportunities?
September may be notorious for its volatility, but October is when the real drama unfolds in the markets. October has witnessed some of the stock market’s most jaw-dropping crashes, earning its reputation for volatility. One of the earliest examples was the Panic of 1907, which peaked in October, wiping out about 50% of the market’s value due to a banking crisis sparked by failed speculation. Then there’s Black Tuesday, October 29, 1929, a date forever linked to the crash that ushered in the Great Depression. Preceded by Black Thursday (October 24) and Black Monday (October 28), this period erased massive wealth and sent shockwaves across the global economy. Fast forward to October 19, 1987—Black Monday—when the Dow Jones nosedived 22.6% in a single day, the largest one-day percentage drop in US history. Fueled by program trading, overvalued stocks, and low liquidity, this crash triggered investor panic.
However, October is also known for remarkable recoveries. After the 1987 crash, the markets began to recover within months, regaining most losses by year-end. Similarly, October 2002 signaled the bottom of the bear market that followed the dot-com bubble burst, paving the way for a bull run that lasted until October 2007, during which the S&P 500 more than doubled, driven by economic recovery, low interest rates, and strong corporate earnings. While October is notorious for downturns, it also marks key turning points toward recovery.
Why is October so unpredictable? One reason October is the psychological factor. Investors recall past crashes, creating a self-fulfilling prophecy where fear drives sharper market swings. October also marks the start of third-quarter earnings season, prompting significant market reactions to summer performances. Portfolio rebalancing also plays a role, as institutional investors adjust their holdings before year-end, creating waves of buying and selling. Plus, October often coincides with global events—wars, political upheaval, or economic shifts—that add fuel to the fire.
For Canadian investors, October brings its share of volatility. The Canadian market often mirrors US market swings due to close economic ties, but domestic factors are significant too. Commodity prices, like oil and gold, key economic data (such as inflation and employment), and the BoC’s interest rate decisions can all heighten market fluctuations, contributing to October’s unpredictability.
As autumn arrives, October brings a mix of excitement and anxiety for investors. Known for its dramatic swings and historic crashes, this month can feel like a rollercoaster ride for those monitoring their portfolios. It presents both cautionary tales and golden opportunities—one moment you are bracing for turbulence, and the next, you are ready to seize a recovery.
For savvy investors, the key is to stay focused on long-term strategies. With a little luck, the positive momentum from September will carry into October, and if economic data remains favourable, it could further boost investor confidence. Remember not to panic during market fluctuations—stick to your long-term investing plan. If you have cash available, a crash can be an opportunity to add to existing holdings or invest in quality companies. Alternatively, consider diversifying your portfolio with another strong contender. What does this October hold for you?
As we brace for October’s twists and turns, let’s see what happened this past week….
Items that may only interest or educate me ….
Canadian Economic news, US Economic news, Another kink in the (supply) chain .…
Canadian Economic news
This past week’s key economic data that the Bank of Canada (BoC) considers when deciding whether to raise or lower the interest rate.
Canadian market volatility
Canada’s Volatility Index (CVIX) started the week at 10.84, rising steadily to a mid-week high of 12.37 before easing to 10.69 by Friday’s close. The sharp spike in volatility came after escalating tensions in the Middle East following Iran’s missile attack on Israel. Throughout the week, the CVIX fluctuated amid concerns over cooling labour markets in both Canada and the US. However, a stronger-than-expected US jobs report on Friday provided some relief, calming the CVIX as the week ended on a more stable note.
Tracked under the ticker VIXI on the Toronto Stock Exchange (TSE), the CVIX measures anticipated market volatility. Readings below 10 indicate a calm, stable market; values between 10 and 20 signal moderate volatility and typical market fluctuations, while levels above 20 suggest heightened uncertainty and increased market turbulence.
US Economic news
This past week’s key data points that the Federal Reserve (Fed) considers when deciding whether to raise or lower the interest rate.
Labour data
Recent US labour reports from the Labor Department’s Job Openings and Labor Turnover Survey (JOLTS) and the Bureau of Labor Statistics’ Employment Situation Summary (ESS) reveal encouraging signs of strength across the job market.
JOLTS
The JOLTS report for August indicated 8.0 million job openings, slightly up from July’s upwardly revised 7.711 million and beating analysts’ expectations of 7.655 million. This marks the first increase in job openings in three months, pushing the ratio of job openings to unemployed persons from 1.08 in July to 1.13 in August. However, year-over-year, job openings have declined by 1.3 million.
This JOLTS highlights the ongoing demand for workers, which could drive wage growth and temper the need for the Fed to aggressively cut interest rates if inflation concerns linger. However, any decline in openings could point to a cooling labour market.
ADP Employment Report
The ADP employment report for September showed a strong rebound in private-sector hiring, with 143,000 jobs added—up from 99,000 in August and exceeding expectations of 120,000. This marks the first increase in five months, with notable growth in the manufacturing sector. Of the ten major industry sectors, Information was the only one to see a decline in employment.
The ADP report is a key indicator of private-sector job creation, offering an early look at trends that help shape expectations for the broader labour market ahead of the official ESS.
ESS
The ESS for September delivered strong results, with non-farm payrolls jumping by 254,000—well above both August’s revised figure of 159,000 and the 246,000 jobs added last September. This exceeded analysts’ forecasts of 140,000 new jobs and surpassed the 12-month average increase of 203,000 jobs.
Meanwhile, the unemployment rate dipped to 4.1%, down from 4.2% in August, defying expectations of it holding steady. Though it remains above the 3.8% rate from September 2023, this is still a positive sign. Additionally, wages grew by 0.4% for the second consecutive month, bringing the annual increase to 4.0%, outpacing expectations.
This stronger than expected report eases concerns of a cooling job market and boosts the likelihood of the Fed opting for a smaller 0.25% rate cut, or possibly holding steady at the next meeting, as they work to balance inflation risks with strong employment.
Conclusion
Overall, the US labour market continues to show resilience with steady job growth, low unemployment, and rising wages. The JOLTS, ADP, and ESS reports collectively point to a robust job market, making it more likely the Fed will proceed cautiously with interest rate adjustments to avoid stoking inflation. This strength bodes well for the economy, providing a brighter outlook for both consumers and investors.
American market volatility
The CBOE Volatility Index (VIX), often referred to as the market’s “fear gauge,” began the week at 17.06 before spiking to 20.49 after a missile attack by Iran on Israel, which escalated tensions in the Middle East and pushed oil prices higher. The VIX fluctuated between 18.25 and 25.0 for the rest of the week, eventually settling at 19.17 on Friday. Stronger-than-expected US labour data helped calm market jitters, bringing the VIX down from its mid-week highs.
The VIX measures projected market volatility over the next 30 days. Levels below 12 indicate a calm market, while readings between 12 and 20 reflect normal fluctuations. A range of 20 to 30 suggests rising uncertainty, and levels above 30 signify extreme stress, often linked to major market disruptions or crises.
Another kink in the (supply) chain
Just as North American supply chains were regaining momentum, a major disruption hit. At 12:01 a.m. ET on October 1, around 45,000 dockworkers at 36 East and Gulf Coast ports began a work stoppage after their contract expired—marking the first large-scale stoppage in 50 years. Nearly half of America’s ocean-going shipping was impacted, with West Coast ports still operational but unable to fully absorb the shock. The primary issues were demands for higher wages and revisions to automation terms in the expired six-year contract. Analysts estimated the stoppage could cost the US economy up to US$5 billion per day, potentially causing shortages of goods like bananas (the most popular fruit in America) and cars and raising prices ahead of the holiday season. Fortunately, many retailers had anticipated the disruption and stocked up inventory beforehand.
After three days, the work stoppage was paused, reopening critical gateways for imports like food, vehicles, and heavy machinery. Thanks to advance planning and cargo diversions to the West Coast, many manufacturers and retailers weathered the short disruption. However, a longer stoppage would have caused significant supply chain bottlenecks and higher shipping costs as goods were rerouted.
The immediate impact of the stoppage was felt across industries relying on imports and exports—such as retail, automotive, and construction—with concerns over delays, potential shortages, and rising costs. While larger companies mitigated the damage through stockpiling and rerouting shipments, the disruption added pressure to already strained logistics networks.
While the stoppage has ended, it is important to note that the current deal only extends the contract until January 15, 2025. Ongoing negotiations over wages and automation still need a final resolution. In the meantime, dockworkers will continue under the terms of their previous contract.
Now that the work stoppage has ended, the swift resolution helps avoid long-term damage to supply chains, which is good news for us investors. With businesses focused on clearing shipment backlogs and getting operations back on track, the immediate risk of major disruptions has passed. While there may still be some short-term logistical challenges, the worst-case scenario has been averted. This means companies in affected sectors—like retail, automotive, and manufacturing—should stabilize, allowing for more predictable performance going forward. For us investors, it signals a return to smoother supply chain operations, reducing the chance of unexpected costs and delays that could impact companies’ sales and net income, which in turn could impact share prices.
Weekly Market Review
Monday: the indexes spent most of the day underwater after Fed Chair Powell said the central bank was in no hurry to cut rates. However, a late rally saw all four indexes – the Toronto Stock Exchange Composite Index (TSX), the S&P 500 Index (S&P), the Dow Jones Industrial Average (DJIA), and the Nasdaq Composite Index (Nasdaq) – finish in positive territory after investors began to grasp the rest of Mr. Powell’s speech where he said the economy was in good shape, they expected a total of 0.5% more cuts to come this year, and they were prepared to do what was necessary to keep the American economy rolling.
In Canada, the TSX fell just short of ending the month with a record high on the strength of higher oil prices and momentum from the US markets. In trading, the Technology sector posted the biggest gain, while Basic Materials (miners and fertilizer manufacturers) posted the biggest loss.
In the US, the S&P and the DJIA both end the month on a high note, setting record highs on the last day of the month. In trading, The Energy sector advanced the most, while the Basic Materials sector declined the most.
Tuesday: a mixed day that saw all three American indexes end in the red, with the TSX being the lone index to end higher. A higher-than-expected jobs opening report has many investors feeling the Fed will lower rates by 0.25% rather than a hoped for 0.5%. Oil prices surged after Iran launched a barrage of missiles at Israel, increasing supply concerns.
In Canada, the TSX closed at a record high on the strength of higher oil and gold prices. In trading, Energy and Basic Materials were the only sectors to advance, the Technology sector had the sharpest drop.
In the US, escalating hostilities in the Middle East prompted investors to shift their investments to safer areas of the market. In trading, the Energy sector rode higher oil prices to the largest daily gain, while the technology sector suffered the largest loss.
Wednesday: It was a choppy day in the markets, with the TSX being the only major index to close in the red. Investor optimism about future rate cuts was tempered by growing geopolitical tensions in the Middle East, which kept investor sentiment cautious. These concerns also drove oil prices higher, as fears about potential supply disruptions from the region intensified.
In Canada, the TSX hit an all time high during the session but was not able to hold it as investors started taking some money off the table after the recent runup. In trading, the Technology sector had the biggest increase, while Consumer Staples declined the most.
In the US, a higher-than-expected ADP private payrolls report showed the labour market remains resilient. In trading, the Energy sector gained the most, while the Consumer Staples sector fell the farthest.
Thursday: The four major indexes spent most of the day fluctuating in negative territory before ultimately closing in the red. Investors are holding their breath ahead of tomorrow’s US jobs report for September, looking for any signs of a cooling labour market that could pave the way for another 0.5% rate cut by the Fed. Meanwhile, escalating tensions in the Middle East fueled a sharp rise in oil prices, adding to the market’s uncertainty.
In Canada, the TSX continued its recent pullback, however, losses were limited by higher energy prices. A three-day strike at the port of Montreal that had shut down two container traffic terminals came to an end; however, talks are ongoing regarding wages. In trading, the surge in oil prices let to the Energy sector posting the biggest gain, while the Utilities sector sank the most.
In the US, higher oil prices helped the Energy sector post the largest gain, while Consumer Cyclicals fell the farthest.
Friday: a much higher than expected US jobs report eased concerns of a slowing US economy, sending all four indexes soaring. Tensions in the Middle East pushed oil prices higher, helping oil post its biggest weekly gain in over a year.
In Canada, buoyed by higher oil prices, and the good news out of the US, the TSX closed at another record high. In trading on Bay Street, the Technology sector recorded the biggest advance, while Consumer Staples dropped the most.
In the US, the re-opening of East and Gulf coast ports added to overall investor optimism, helping send the DJIA to another record high close. In trading on Wall Street, the Financials sector posted the largest gain, while Utilities had the steepest decline.
Weekly Market and Portfolio Review
For the week, the TSX (SPTSX) gained 0.9%, the S&P 500 (SPX) advanced 0.2%, the DJIA (INDU) rose 0.1% and the Nasdaq (CCMP) increased by 0.1%.
| Index | Weekly Streak |
| TSX: | 4 – week winning streak |
| S&P: | 4 – week winning streak |
| DJIA: | 4 – week winning streak |
| Nasdaq: | 4 – week winning streak |
![]() The week kicked off on a positive note, closing out September on a high and seeing the S&P notch yet another record close. All four major indexes posted a monthly win, leaving the usually dour September with an upbeat finish. The week seemed like it might fizzle out as investors grew anxious over a potentially slowing American labour market, hinting at broader economic weakness. But, in a twist, a blowout US jobs report sent all four indexes soaring. The TSX climbed further into positive territory, while the three major American indexes joined the weekly win column, as shown in the chart above.
The week kicked off on a positive note, closing out September on a high and seeing the S&P notch yet another record close. All four major indexes posted a monthly win, leaving the usually dour September with an upbeat finish. The week seemed like it might fizzle out as investors grew anxious over a potentially slowing American labour market, hinting at broader economic weakness. But, in a twist, a blowout US jobs report sent all four indexes soaring. The TSX climbed further into positive territory, while the three major American indexes joined the weekly win column, as shown in the chart above.
Investor confidence remains strong, thanks to the Fed’s significant interest rate cut the previous week and a resilient US economy. This week, American labour data was the key market driver on both sides of the border. Weaker numbers could’ve sparked concerns about a slowing US economy, but the data exceeded expectations, signalling continued strength in the labour market and economy.
Tensions in the Middle East added some turbulence throughout the week, putting downward pressure on American markets. However, Canada’s TSX benefited from rising oil prices, which boosted energy stocks and kept the resource-heavy index in the green all week.
All in all, the week was a bit of a rollercoaster, but the strong US jobs report turned what could’ve been a lackluster finish into wins for all four indexes. With the TSX gaining strength from rising energy prices and US markets rallying on positive labour data, the outlook for the coming weeks looks promising. As we head deeper into October—a month that’s often a wildcard for markets—the strong economic news could help keep the upward momentum going. Here’s hoping the rally continues! 😊
| Portfolio | Weekly Streak |
| Portfolio 1: | 4 – week winning streak |
| Portfolio 2: | 2 – week losing streak |
| Portfolio 3: | 4 – week winning streak |
![]() Not a bad way to kick off October, with two out of three portfolios increasing in value— definitely better than the start of September when all three portfolios dropped by at least 1.5% in that first week. 😊
Not a bad way to kick off October, with two out of three portfolios increasing in value— definitely better than the start of September when all three portfolios dropped by at least 1.5% in that first week. 😊
Portfolio 1 was the top performer, but it did not break into positive territory until the last day of the week. While there were not any dramatic moves—no gains or losses exceeding 10%— a slim majority of companies posted a weekly loss. Fortunately, the largest holding, Nvidia, posted a weekly gain, driving the portfolio into the win column and extending its win streak to four weeks.
Portfolio 2 was the only portfolio to decrease in value, with 40% of the holdings down for the week. It is no surprise the portfolio declined, but there was a bright spot: TC Energy (TSE: TRP) jumped 18%, softening the blow.
Portfolio 3 also finished in the green, despite only 39% of stocks growing in value. Like Portfolio 1, there was not a single stock posting either a 10%+ gain or loss.
Hopefully, the strong US labour report from last week sets the stage for a rally. Historically, October has been the second-best month for the technology sector in the S&P 500, right after November. Since all three portfolios are tech-heavy, here is to hoping this trend continues and lifts us through the rest of the month! 😊

Monthly Market and Portfolio Review
For the month of September, the TSX (SPTSX) advanced 2.8%, the S&P 500 (SPX) rose 2.0%, the DJIA (INDU) increased 1.8% and the Nasdaq (CCMP) was buoyed 2.7%.
![]() September brought an unexpected boost to the markets, flipping its usual reputation as a historically tough month for stocks. The S&P gained 2.1%, a significant contrast to its historical average decline of 1.1% in September, where it suffers losses about 55% of the time. This year, all four major indexes posted solid gains, with the TSX, S&P, and DJIA setting multiple record highs. Much of the focus was on the Fed, as investors anxiously awaited the size of the next rate cut. When the Fed delivered a jumbo 0.5% cut, it sparked a wave of market optimism that fueled the impressive performance across the board. By the end of the month, the S&P had its best year-to-date run since 1997 and capped off its strongest quarter since late 2021. What started as a month of uncertainty turned into one of gains, buoyed by a reduction in the US benchmark interest rate and renewed investor confidence.
September brought an unexpected boost to the markets, flipping its usual reputation as a historically tough month for stocks. The S&P gained 2.1%, a significant contrast to its historical average decline of 1.1% in September, where it suffers losses about 55% of the time. This year, all four major indexes posted solid gains, with the TSX, S&P, and DJIA setting multiple record highs. Much of the focus was on the Fed, as investors anxiously awaited the size of the next rate cut. When the Fed delivered a jumbo 0.5% cut, it sparked a wave of market optimism that fueled the impressive performance across the board. By the end of the month, the S&P had its best year-to-date run since 1997 and capped off its strongest quarter since late 2021. What started as a month of uncertainty turned into one of gains, buoyed by a reduction in the US benchmark interest rate and renewed investor confidence.
In the US, several key factors shaped the markets: concerns that the AI boom was slowing, a softening labour market, cooling inflation, uncertainty around the upcoming election, and the biggest driver, the Fed’s rate cut – both the anticipation and the actual reduction. The Fed’s first rate cut since March 2020, an aggressive 0.5%, helped propel markets higher, though some worried it signaled deeper concerns about the economy. Chinese economic stimulus measures aimed at jumpstarting the world’s second-largest economy also added to the positive momentum, further boosting investor sentiment.
In Canada, the TSX’s three-week rally was fueled by a blend of falling inflation, a third 0.25% rate cut by the BoC, rising commodity prices, and the ripple effect of the Fed’s moves south of the border. These factors reignited investor confidence, giving the TSX the final push it needed to end the month on a strong note.
September’s market performance across North America was a welcome surprise for investors, with both the US and Canadian markets benefiting from central bank actions and improving economic conditions. The combination of rate cuts, cooling inflation, and strong commodity prices reignited investor confidence on both sides of the border. As we head into October, another month known for volatility, the focus will likely remain on economic data and central bank policies. With any luck, October will provide another pleasant surprise much like September. Keep your fingers crossed. 😊
![]() After a mixed August, September brought a welcome turnaround for all three portfolios. As shown in the chart below, each portfolio posted gains, with Portfolios 1 and 3 outperforming their August results, while Portfolio 2 held steady, matching last month’s performance.
After a mixed August, September brought a welcome turnaround for all three portfolios. As shown in the chart below, each portfolio posted gains, with Portfolios 1 and 3 outperforming their August results, while Portfolio 2 held steady, matching last month’s performance.
Portfolio 1 started off rough, dropping 7.1% in the first week, only to rebound with a 7.8% gain the following week. From there, it posted steady weekly gains, averaging around 1%. The real driver? Nvidia (NASD: NVDA), which was behind both the early drop and the later surge. By the final week, Nvidia’s weight in the portfolio pulled it back into the green, despite the majority of stocks posting losses that week. Unsurprisingly, technology stocks played a pivotal role throughout the month.
Portfolio 2 had a more volatile ride, with a mix of ups and downs. Fortunately, the gains in weeks two and three more than compensated for the losses in weeks one and four. Hammond Power Solutions (TSE: HPS.A) was a standout, with significant swings in its share price that added some drama to the portfolio’s performance during the first three weeks.
Portfolio 3 stole the spotlight in September, delivering the strongest performance across all portfolios and indexes. Other than a dip in the first week, it consistently posted solid weekly gains. Key drivers included Lithium Americas (TSE: LAC) and Lithium Americas (Argentina) (TSE: LAAC), both of which fluctuated wildly, but overall contributed to the portfolio’s success. It was a strong month for Portfolio 3, closing September on a high note.
September delivered some much-needed gains across the portfolios after a choppy start to the month. Key stocks like Nvidia and those in the lithium sector helped each portfolio find its rhythm, with Portfolio 3 leading the charge with steady gains. As we enter the home stretch of the year, hopefully these positive trends have laid the groundwork for a strong finish. Here is to hoping October keeps the momentum going!

Companies on the Radar
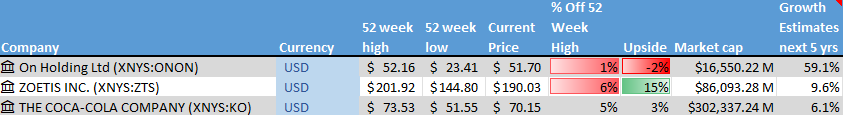
 This past week, I did not spot any fresh additions to my radar list. Sometimes, my best ideas are already on my radar or nestled in one of my three portfolios. 😊 Just a reminder, these are not buy recommendations – always do your own research and do what will help you achieve your own financial goals!
- On Holding AG (NYSE: ONON), a medium cap Swiss company, founder-run, sports products company.
- Zoetis Inc. (NYSE: ZTS), a leading animal health company that discovers, develops, manufactures, and commercializes vaccines, medicines, diagnostics, and other technologies for both companion animals and livestock.
- Coca-Cola (NYSE: KO), a global beverage giant, best known for its flagship soft drink, Coca-Cola. They offer a wide range of non-alcoholic drinks, including sodas, juices, teas, and bottled water, catering to consumers worldwide.
The Radar Check was last updated October 4, 2024.

Portfolio Update
Portfolio 1
Portfolio 1 for the week ended October 4, 2024: UP ![]()
- Carnaval Cruise Line (NYSE: CCL) increased revenues, lowered expenses, and raised its profit outlook as a result of strong demand for cruise vacations.
- General Motors’ (NYSE: GM) Cruise self-driving car division was ordered by the National Highway Traffic Safety Administration to pay a US$1.5 million fine after the company failed to disclose details of a serious pedestrian involved accident in a October 2023 crash. Cruise also faces ongoing investigations by the Justice Department and the Securities and Exchange Commission regarding the same accident.
In other GM news, the company reported a 2.2% decrease in third quarter sales. In the previous year, quarterly sales grew by 21%. - Amazon (NASD: AMZN) announced they plan to hire 250,000 temporary transportation and warehouse workers for the upcoming holiday shopping season. This is the same amount they hired for the 2023 holiday season. The company is anticipating online spending to surpass overall holiday sales in the final quarter of 2024.
- Rivian (NASD: RIVN) cut its production forecast for the year and missed third-quarter deliveries expectations s a result of a parts shortage and slowing growth in electric vehicle demand.
Activity
No significant activity to report this week.
Dividends
Dividends Received this week for the following companies:
Canadian $
No C$ dividends this past week.
US $
NVIDIA Corp.
Quarterly Reports
Carnival Corporation & plc
Third quarter 2024 financial results on October 2, 2024
Portfolio 2
Portfolio 2 for the week ended October 4, 2024: DOWN ![]()
- TC Energy’s pipeline spin off, South Bow Corp. (TSE: SOBO), began trading on the Toronto Stock Exchange this week, closing lower on its first day. The spin-off was part of TC Energy’s strategy to reduce debt and sharpen its focus on natural gas operations. As part of the deal, TC Energy shareholders received one share of South Bow for every five common shares of TC Energy they owned. Looking ahead, South Bow is set to debut on the New York Stock Exchange (NYSE) next week.
Activity
No significant activity to report this week.
Dividends
Dividends Received this week for the following companies:
Canadian $
Canadian Natural Resources Ltd (TSE: CNQ)
US $
No US$ dividends this past week.
Quarterly Reports
No quarterly reports this past week.
Portfolio 3
Portfolio 3 for the week ended October 4, 2024: UP ![]()
- Microsoft (NASD: MSFT) has been classified by Germany’s competition bureau, the Bundeskartellamt, as a “company with paramount cross-market significance for competition.” This enables the bureaus to take stronger action against the company in the future.
- Goeasy (TSE: GSY) announced its inclusion in the 2024 Report on Business magazine’s list of Canada’s Top Growing Companies, recognized for its impressive three-year cumulative revenue growth.
- Enghouse Systems (TSE: ENGH) announced President Vince Mifsud has resigned from the company to pursue another opportunity. He will leave the company in December. His duties will be transitioned to the Chief Executive Officer and Chair, Steve Sadler. In the meantime, the company will immediately begin a search for his replacement.
Activity
No significant activity to report this week.
Dividends
Dividends Received this week for the following companies:
No dividends this past week.
Quarterly Reports
No quarterly reports this past week.