Items that may only interest or educate me ….
US economic news, FOMC inputs, Market sentiment indicators ….
US economic news
The latest Consumer Price Index (CPI) gained 0.4% in April, after gaining 0.1% in March. On an annual basis, the CPI increased 4.9%, the smallest increase since April 2021. Core CPI (CPI less the volatile food and energy components) increased 0.4%, matching the increase in March. On an annual basis, the April core CPI gained 5.5%, decelerating slightly from March’s 5.6% gain. The April CPI was the 10th consecutive month inflation fell and the first time it has been below 5% in two years.
The report indicates inflation continues to fall. Investors strongly believe the Fed will hit the pause button on rate hikes at their next meeting in June. However, the question is whether it is falling fast enough for the Fed.
Federal Open Market Committee input considerations
With all the attention paid to the recent hikes to the US benchmark interest rate, it got me wondering what they based their decision upon? Here is a quick rundown of some of the key data the US Federal Reserve’s (Fed) Federal Open Market Committee (FOMC) considers when deciding whether to raise or lower the interest rate:
- Inflation: The FOMC closely monitors measures of inflation, such as the Personal Consumption Expenditures (PCE) price index (measures the total amount spent by households on goods and services), to assess whether prices are rising too quickly or too slowly.
- Employment: The FOMC looks at a variety of indicators related to employment, including the unemployment rate, job creation, and wage growth, to determine whether the labour market is healthy and whether the economy is generating enough jobs and income for workers.
- Gross Domestic Product (GDP): The FOMC considers data on GDP, which measures the total value of goods and services produced in the economy, to assess overall economic growth.
- Financial Markets: The FOMC pays close attention to financial markets, including stock and bond prices, to assess market expectations for future economic growth and inflation.
- International Developments: The FOMC also considers global economic developments, such as changes in trade policies or geopolitical risks, that could affect the U.S. economy.
The FOMC analyzes this and other economic data. If any of the following conditions exist – inflation is above the Fed’s target rate of 2% (as it is currently), employment is strong and the economy is growing too quickly, GDP growth is strong, financial markets are signaling strong economic growth and rising inflation expectations, or global economic conditions are deteriorating – the FOMC may decide to keep interest rates low to maintain price stability, maximize employment and economic growth.
Market sentiment indicators
Over the past three weeks I have talked about the Volatility Index (VIX), the Consumer Confidence Index (CCI) and the Consumer Sentiment Index (CSI). In this final look at these popular indexes used by investors of all levels, let us look at these three together.
If you are a new investor just starting out, you probably have enough to worry about without concerning yourself with these overall market sentiment indicators. For now, you can file these indicators away until you are farther along in your investing journey. However, the VIX, CSI, and CCI are all important indicators that can help you make better investment decisions.
The VIX, or the Volatility Index, is a measure of the market’s expectation of volatility in the near term (typically, over the next several weeks or months). A high VIX (> 20) usually means that the market is expecting more uncertainty, while a low VIX (< 12) suggests that the market is expecting less uncertainty. Typically, the markets and the VIX are inversely related. When the VIX is low, the S&P 500 is going up, and vice versa.
The CCI, or Consumer Confidence Index, measures how consumers feel about the job market, the economy in general, and their financial situation. A higher CCI (> 50) indicates that consumers are more confident in the economy, which can lead to increased consumer spending and investment in businesses.
The CSI, or Consumer Sentiment Index, measures how consumers feel about the economy, their personal finances, and their spending plans. A higher CSI (> 50) generally indicates that consumers are feeling more optimistic about the economy, which could lead to increased consumer spending and more business investments.
By paying attention to these indicators, investors can better gauge market sentiment (VIX), consumer behavior (CCI), and economic trends (CSI), which can help them make more informed investment decisions.
Who uses these indexes?
Professional, institutional, and individual investors can benefit from using the VIX, CCI, and CSI indexes.
Professional investors, like the traders and fund managers, might use these indexes to help them make quick decisions about when to buy or sell certain assets.
Institutional investors, like banks or insurance companies, might use these indexes to help them make more informed decisions about how to allocate large amounts of money across different asset classes.
Individual investors, even new investors just getting started, can use these indexes to help make smarter investment decisions. For example, you might use the VIX to get a sense of how risky the market is right now, or the CCI and CSI to gauge how confident consumers are feeling about the economy.
So, in short, everyone can use the VIX, CCI, and CSI indexes. You do not have to be a professional or institutional investor to benefit from using them in your investment strategy.
Is it OK to ignore the sentiment indexes?
I would say yes, especially if you are new to investing. There is enough to think about without overloading your decision-making process. When I started investing, I did not know about the market sentiment indexes so I never paid attention to them until they kept appearing in articles. In fact, I have never considered them when making an investment decision to this day. Perhaps if I had the Portfolios would not have gotten beaten down as badly in 2022. 😊 In any event, here are a few situations where they may not be useful:
- Long-term investments: The VIX, CSI, and CCI are typically used as short-term indicators, and may not be as helpful when considering long-term investments. This is the one that applies to my style of investing – long term, buy and hold. I focused on other factors, such as industry trends, product, customers, management quality, would I want to work there, and company financials when evaluating long-term investment opportunities. Even now that I am aware of these sentiment indexes, I do not pay much attention to them since my goal is to invest in quality companies for the long term.
- During major market disruptions: During times of extreme market volatility or major market disruptions, the VIX may be less reliable as a gauge of future market conditions. In these cases, you may want to look at other indicators, such as historical data, company fundamentals, or economic trends, to make informed investment decisions.
- When making investment decisions based solely on sentiment: While the CSI and CCI can provide valuable insight into consumer sentiment and economic trends, investors should avoid making investment decisions solely based on sentiment (this is how you can get into trouble). It is important to perform your due diligence and consider a variety of factors, including current and trending economic conditions, market trends, and company financials before making investment decisions.
Wrapping up, the VIX, CSI, and CCI can provide valuable information for investors. However, they are simply more tools to add to your investing toolbox to help you understand market movements and plan accordingly. They should be used in combination with your other investing tools (for example, learning about the company, its products, and customers, and reading its financial statements and notes) when making investment decisions.
The VIX can be found on yahoo! Finance or the source – Chicago Board Options Exchange (Cboe)
The Canadian CCI and CSI is only available on subscription basis from The Conference Board of Canada.
In the US, the CCI can be found at The Conference Board, while the CSI can be found at University of Michigan: Consumer Sentiment.
Now that you are aware of three more tools for your investing toolkit, let’s see what happened this past week….
Weekly Market Review
Monday: Three of the four major North American indexes – the Toronto Stock Exchange Composite Index (TSX), the S&P 500 Index (S&P), and the Nasdaq Composite Index (Nasdaq) – ended slightly higher. The lone exception was the Dow Jones Industrial Average (DJIA). Investors shifted their attention to the upcoming US inflation report (CPI) and are keeping an eye on the game of chicken going on in the US government. The price of oil rose as concerns of a US recession receded.
In Canada, the TSX maintained the upward momentum from last week as the Technology and Consumer Cyclicals led the way. Telecommunications Services, Energy and Healthcare were the only Canadian sectors to lose ground.
In the US, the three American indexes were underwater for most of the day until a late rally pushed the S&P and the Nasdaq above water. In trading, Technology and Consumer Cyclicals were the only American sectors to advance, while Utilities and Telecommunications Services dropped the most.
Tuesday: When the best performing index is flat, that is not a good sign. The TSX was the only index not to fall back as investors await tomorrow’s US inflation data and concerns grow on a possible US debt default.
In Canada, The TSX started the day with a sharp decline but was able to ride higher energy prices to return to where it started by the end of the day. The gains in energy companies offset declines in Canada’s financial sector. In trading, it was a mixed day in the Canadian sectors with half advancing and half declining. Leading the advancers were Industrials and Energy companies, while Financials and Consumer Cyclicals dropped the most.
In the US, all three American indexes slumped on weak earnings reports and forecasts, US debt ceiling negotiations, and tomorrow’s CPI report. Good news for those invested in oil companies, the US announced plans to replenish their Strategic Petroleum Reserve, lifting oil prices. It was another tough day in the American sectors with only Industrials and Energy sectors gaining. The Telecommunications Services and Technology sectors suffered the biggest falls.
Wednesday: It was another mixed bag for the four indexes, with two higher and two lower, following the release of the US CPI report that showed consumer prices rose 4.9% in April, the slowest annual pace in two years. Normally good news like inflation coming in lower than expected would send the markets higher however it was muted by concerns of the US defaulting on its debt.
In Canada, lower commodity prices did in the resource heavy TSX, offsetting the good news US CPI report. On Bay Street, only the Industrials and Telecommunications Services sector ended in the green while Energy and Basic Materials (miners and fertilizer manufacturers) led the other sectors lower.
In the US, the lower CPI data caused investors to hope the Fed will pause its interest rate hikes. Both the growth-oriented Nasdaq and S&P rose on the hope interest rates will top out at 5.25%. Meanwhile, the more traditional DJIA ended slightly lower. On Wall Street, the Technology and Utilities sectors posted the biggest gains, while Energy and Basic Materials posted the biggest declines.
Thursday: Yet another mixed day in the North American stock markets with the Nasdaq the only index to end higher. Rather than concerns about additional interest rate hikes, investors are now concerned how long these higher interest rates in Canada and the US will last and what damage it could do their respective economies.
In Canada, the TSX dropped for a second day as commodity prices (such as oil, gold, and copper) continued to drop. In trading, leading the way in the Canadian sectors were Financials and Consumer Staples, while Basic Materials and Industrials had the biggest drops.
In the US, regional bank concerns flared up again, this time over falling deposits at PacWest Bancorp (NASD: PACW). Lower oil prices, and concerns about the US defaulting on its debt also helped drag the DJIA and S&P lower. Nasdaq was able to finish in the green thanks to a surge in Alphabet (NASD: GOOGL) after Google showcased a few of its artificial intelligence (AI) products in. In trading, Technology, Consumer Cyclicals and Consumer Staples were the only American sectors to end in the green. Basic Materials and Energy suffered the biggest pullbacks.
Friday: The markets started out on an upward track but quickly reversed themselves before an afternoon rally saw the TSX inch into the green, up 0.01%, while all three American indexes failed to get out of the red. Mixed economic data, ongoing US debt default concerns, and a notable rise in consumers’ inflation expectations caused the May CSI to fall to a six-month low of 57.7, down from April’s 63.5. Oil prices ended the week lower on concerns of lower demand in the world’s two biggest economies – USA and China.
In Canada, the TSX was boosted into positive territory on a strong earnings report from Air Canada (TSX: SC) indicating people have been travelling more and there remains pent up travel demand. In trading, Utilities and Industrials led the way higher in the Canadian sectors while Technology and Healthcare had the biggest drops.
In the US, the DJIA ran its losing streak to five days when a member of the Fed said they may have to raise the interest rate again if inflation remains high. The mega cap technology stocks which have been carrying the load for the Nasdaq and S&P most of the year had an off day, perhaps investors taking profits, dragging both indexes lower. In trading in the American sectors, Utilities and Energy gained the most while Consumer Cyclicals and Financials had the biggest declines.
Weekly Market and Portfolio Review
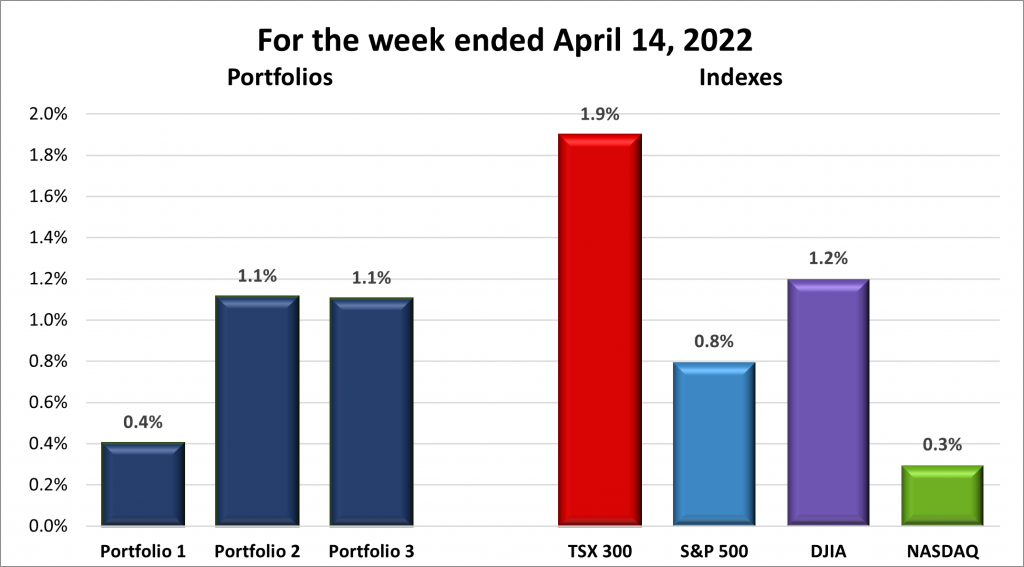
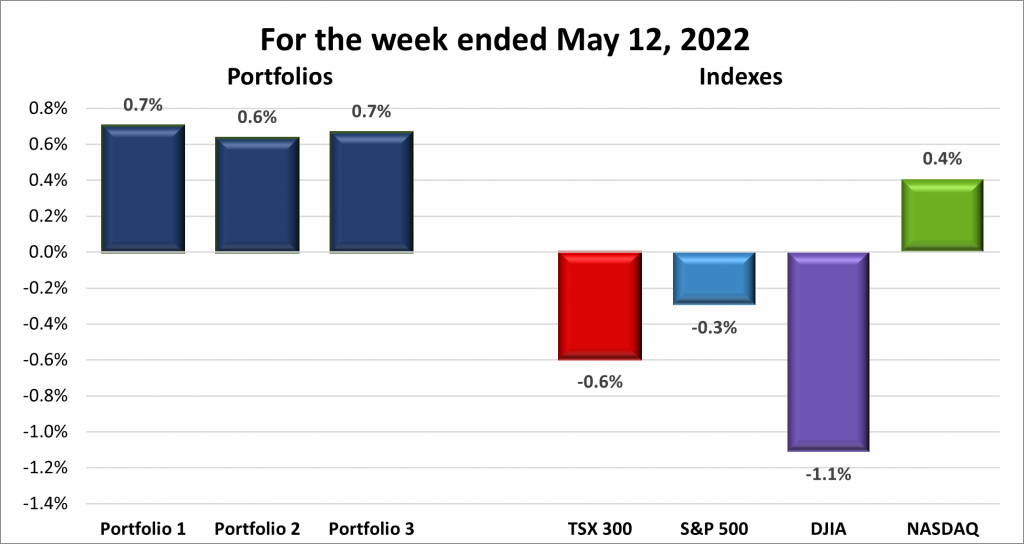
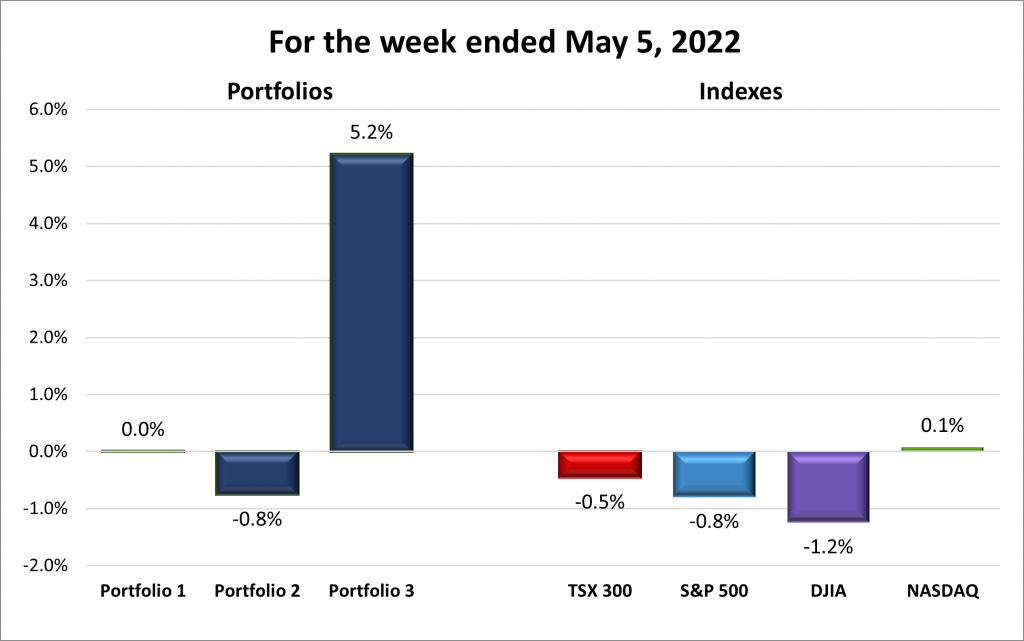
For the week, the TSX (SPTSX) fell for the third week in a row, this time dropping 0.6%, the S&P 500 (SPX) slipped 0.3%, the DJIA (INDU) dropped 1.1% and the Nasdaq (CCMP) advanced 0.4%.
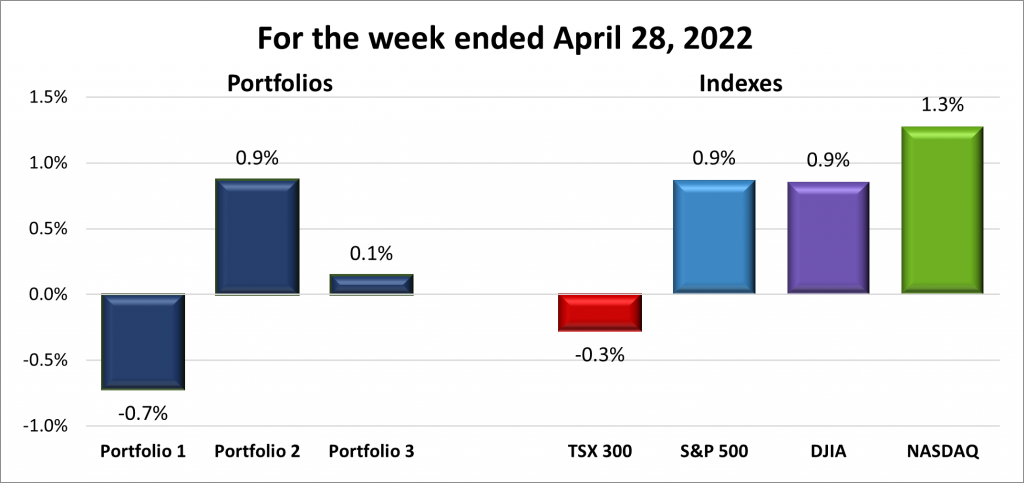
![]() In general, this current earnings season has been quite good, but after the year we had in 2022 the bar was not set very high to begin with. With most of the reporting companies beating the low bar the indexes got a bit of a boost but as has been the case for the last few weeks, the number one driver of the markets remains the Fed’s interest rate policy. And so, it was again this past week as investors debated whether recent economic data would allow the Fed to hold the line on interest rate hikes. Many investors felt there would be a pause at their next meeting but at the end of the week a member of the Fed said they might have to raise the rate unless inflation dropped. And down they went, as you can see in the chart above.
In general, this current earnings season has been quite good, but after the year we had in 2022 the bar was not set very high to begin with. With most of the reporting companies beating the low bar the indexes got a bit of a boost but as has been the case for the last few weeks, the number one driver of the markets remains the Fed’s interest rate policy. And so, it was again this past week as investors debated whether recent economic data would allow the Fed to hold the line on interest rate hikes. Many investors felt there would be a pause at their next meeting but at the end of the week a member of the Fed said they might have to raise the rate unless inflation dropped. And down they went, as you can see in the chart above.
The Nasdaq continues to advance on the strength of the mega cap technology companies, up 19% in 2023. Unfortunately, the rally has not extended to the broader market. The S&P and blue chip DJIA were both dragged lower on concerns about an interest rate pause, US debt default and ongoing bank issues. The TSX fell when the commodity prices dropped mid week.
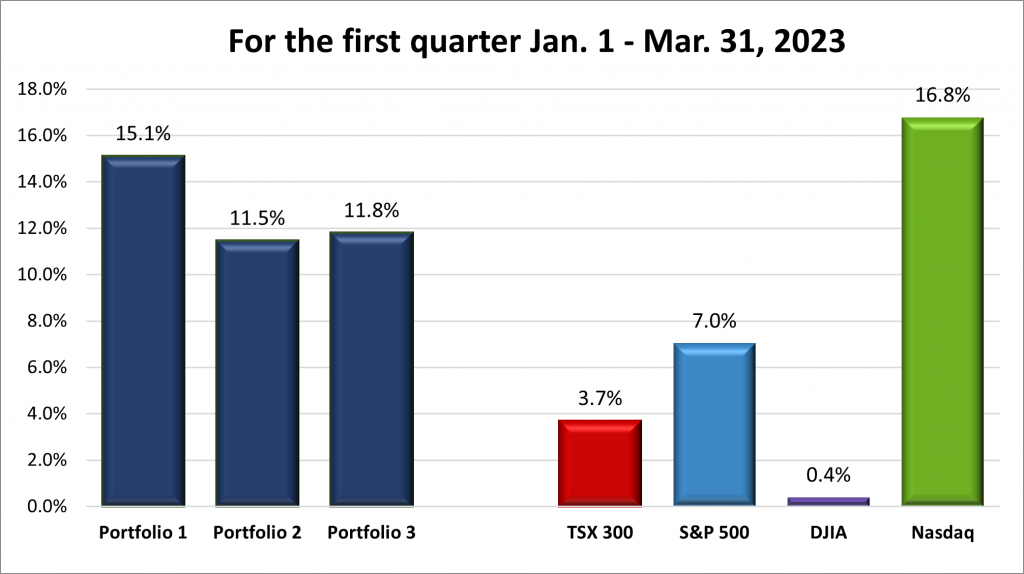
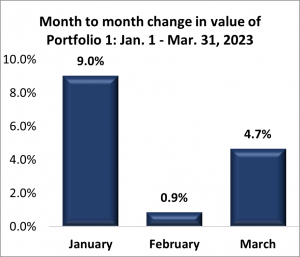
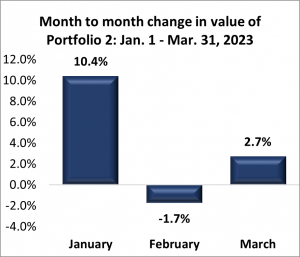
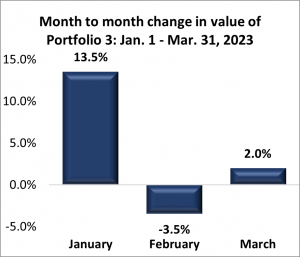
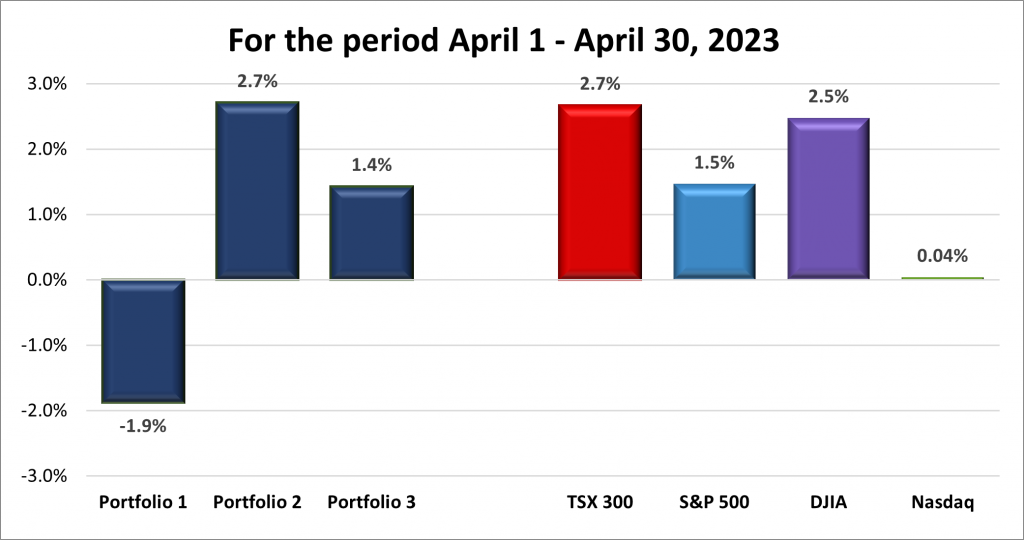
![]() As for the Portfolios, I do not remember the last time all three portfolios outperformed all four indexes, almost doubling the best performing Nasdaq, as seen below. I also do not remember the portfolios all within 0.1% of each other. All portfolios have a Technology sector bias and contain at least one of the mega cap technology companies. I am sure this is what lifted the portfolios this past week. Granted the gains were less than 1% but a gain is a gain, and I will take that every week. 😊
As for the Portfolios, I do not remember the last time all three portfolios outperformed all four indexes, almost doubling the best performing Nasdaq, as seen below. I also do not remember the portfolios all within 0.1% of each other. All portfolios have a Technology sector bias and contain at least one of the mega cap technology companies. I am sure this is what lifted the portfolios this past week. Granted the gains were less than 1% but a gain is a gain, and I will take that every week. 😊
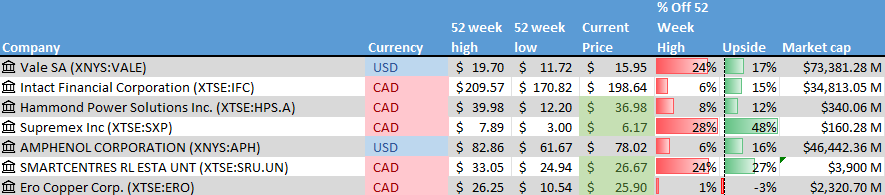
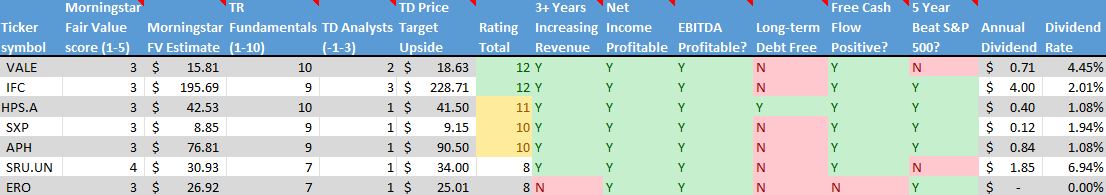
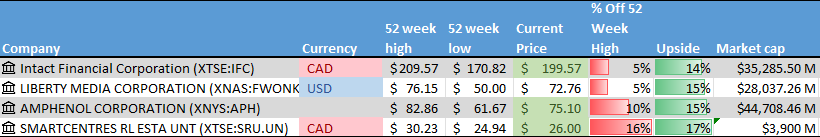
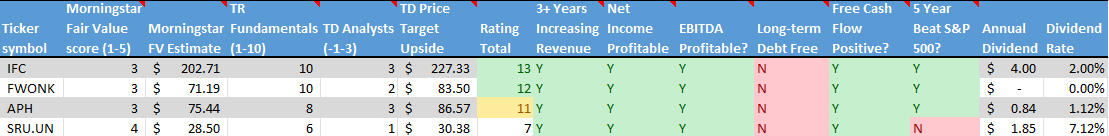
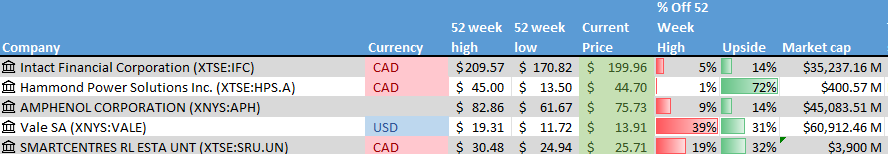
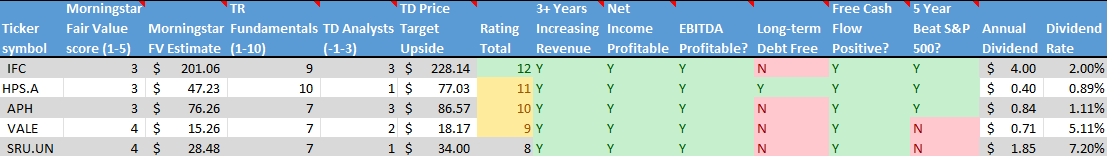
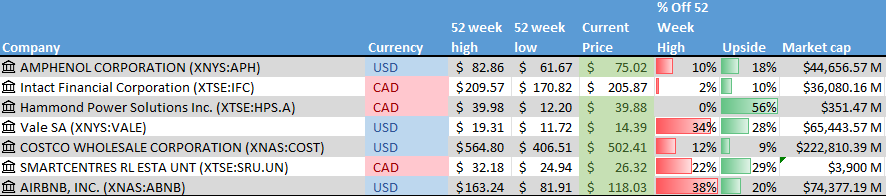
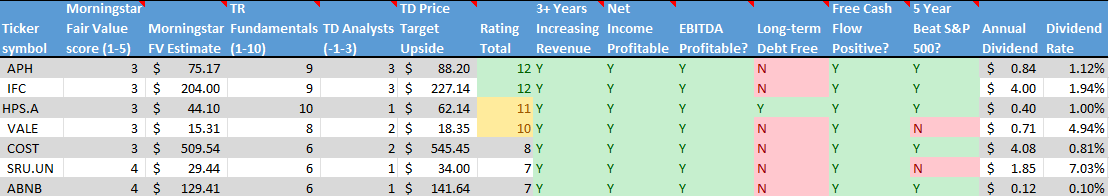
Companies on the Radar

This week Hammond Power Solutions (TSX: HPS.A) leaves the radar list for Portfolio 2. Vale (NYSE: VALE) has been dropped from the list for now because I don’t know enough about the mining industry. If I decide to invest in a mining company I would consider Vale, but it would be as a source of raw materials used in electric vehicles. Joining the Radar List is Liberty Media Corp’s Formula 1 tracking stock (NASD: FWONK). A tracking stock is a type of stock that is designed to track the performance of a particular business unit of a larger company. In this case, FWONK tracks the financial performance of Liberty Media’s ownership in the Formula One Group, which owns and operates the Formula One World Championship.
While watching the Miami F1 race I was thinking I should’ve bought more Ferrari (NYSE: RACE) shares. Then I wondered if it was possible to invest in the entire Formula 1 series. It is possible and when I ran it through my Radar Check it scored well enough to dig deeper.
Other companies on the list are:
- Intact Financial (TSX: IFC): A Canadian mid size insurance company supplying home, car and business insurance in Canada, the US, and the UK.
- Amphenol: (NYSE: APH) Producer of a high-tech interconnect, sensor, and antenna solutions for the automotive, aerospace, industrial and various technology industries.
- Smartcentres Real Estate Investment Trust (TSX: SRU.UN): Owns and manages a number of income producing malls and retails spaces throughout Canada.
The Radar Check was last updated May 12, 2023.
Portfolio Update
Portfolio 1
Portfolio 1 for the week ended May 12, 2023: UP ![]()
- Finally, some good news out of Rivian (NASD: RIVN). Rivian was able to trim its losses, beat quarterly revenue estimates and predicted it would meet its annual production targets.
Rivian said it will hold prices steady on its R1S and R1T electric vehicles, add higher priced versions loaded with additional features as well as lower priced versions. - Alphabet held its annual developer day this past week where it showcased its latest technologies. First up was an improved version of its AI chatbot, Bard. Google debuted its Google Pixel Fold, a foldable smartphone; its first Pixel Tablet; a new Pixel 7a smartphone; and a 3D “immersive View” to Google Maps that allows users to see a 3D view of their route, complete with traffic simulation, bike lanes and street parking.
- Tesla (NASD: TSLA) has been forced to ‘recall’ nearly every car it has sold in China, approximately 1.1 million vehicles. The reason is a braking and acceleration problem that may increase crash and safety risks. Fortunately for Tesla the issue can be fixed with a software update. Rather than owners bringing their cars in for the update, Tesla will be able to push the update ‘over the air’ to the affected vehicles. This will save Tesla and the car owners time and money.
Activity
No significant activity to report this week.
Dividends
Dividends Received this week for the following companies:
Companies followed by DRIP (Dividend Re-Investment Plan) indicate additional shares were purchased with the dividend. Any cash leftover was added to the cash balance.
Canadian $
No C$ dividends this past week.
US $
Ferrari N.V. (NYSE: RACE)
Quarterly Reports
Progeny, Inc.
All currency listed in thousands of US dollars, except earnings per share.
Selected highlights from their first quarter 2023 financial results on May 8, 2023
- Revenue of $258,394 for the three months ended March 31, compared to $172,217 for the same period in 2022. An increase of over 50%.
- Net income of $17,678 for the three months ended March 31, compared to net income of $4,971 in the same period in 2022.
- Diluted earnings per ordinary share of $0.18 for the three months ended March 31, compared to earnings of $0.05 per share for the same period in 2022.
Innovative Industrial Properties, Inc.
All currency listed in thousands of US dollars, except earnings per share.
Selected highlights from their first quarter 2023 financial results on May 8, 2023
- Revenue of $76,067 for the three months ended March 31, compared to $64,504 for the same period in 2022. An increase of almost 18%.
- Net income of $40,475 for the three months ended March 31, compared to net income of $34,712 in the same period in 2022.
- Diluted earnings per ordinary share of $1.43 for the three months ended March 31, compared to earnings of $1.32 per share for the same period in 2022.
PayPal Holdings, Inc.
All currency listed in millions of US dollars, except earnings per share.
Selected highlights from their first quarter 2023 financial results on May 8, 2023
- Revenue of $7,040 for the three months ended March 31, compared to $6,483 for the same period in 2022. An increase of over 8%.
- Net income of $795 for the three months ended March 31, compared to net income of $509 in the same period in 2022.
- Diluted earnings per ordinary share of $0.70 for the three months ended March 31, compared to earnings of $0.43 per share for the same period in 2022.
Skyworks Solutions, Inc.
All currency listed in millions of US dollars, except earnings per share.
Selected highlights from their second quarter 2023 financial results on May 8, 2023
- Revenue of $1,153.1 for the three months ended March 31, compared to $1,335.6 for the same period in 2022. A decrease of less than 14%.
- Net income of $232.8 for the three months ended March 31, compared to net income of $305.8 in the same period in 2022.
- Diluted earnings per ordinary share of $1.46 for the three months ended March 31, compared to earnings of $1.86 per share for the same period in 2022.
- Revenue of $2,482.4 for the six months ended June 30, compared to $2,846.0 for the same period in 2021. A decrease of almost 13%.
- Net earnings of $542.2 for the six months ended June 30, compared to net earnings of $705.7 in the same period in 2021.
- Diluted earnings per ordinary share of $3.39 for the six months ended June 30, compared to earnings of $4.27 per share for the same period in 2021.
Crew Energy Inc.
All currency listed in Canadian dollars, except earnings per share.
Selected highlights from their first quarter 2023 financial results on May 8, 2023
- Revenue of $112,812 for the three months ended March 31, compared to $53,688 for the same period in 2022. An increase of over 210%.
- Net income of $41,354 for the three months ended March 31, compared to a net loss of $1,377 in the same period in 2022.
- Diluted earnings per ordinary share of $0.26 for the three months ended March 31, compared to a loss of $0.01 per share for the same period in 2022.
kneat.com, inc.
All currency listed in thousands of Canadian dollars, except earnings per share.
Selected highlights from their first quarter 2023 financial results on May 9, 2023
- Revenue of $7,964,908 for the three months ended March 31, compared to $5,199,602 for the same period in 2022. An increase of over 53%.
- Net loss of $2,474,357 for the three months ended March 31, compared to a net loss of $3,426,260 in the same period in 2022.
- Diluted loss per ordinary share of $0.03 for the three months ended March 31, compared to a loss of $0.04 per share for the same period in 2022.
Marqueta, Inc.
All currency listed in thousands of US dollars, except earnings per share.
Selected highlights from their first quarter 2023 financial results on May 9, 2023
- Revenue of $217,343 for the three months ended March 31, compared to $166,102 for the same period in 2022. An increase of almost 31%.
- Net loss of $68,801 for the three months ended March 31, compared to a net loss of $60,598 in the same period in 2022.
- Diluted loss per ordinary share of $0.13 for the three months ended March 31, compared to a loss of $0.11 per share for the same period in 2022.
Celsius Holdings, Inc.
All currency listed in thousands of US dollars, except earnings per share.
Selected highlights from their first quarter 2023 financial results on May 9, 2023
- Revenue of $259,939 for the three months ended March 31, compared to $133,388 for the same period in 2022. An increase of almost 95%.
- Net income of $41,227 for the three months ended March 31, compared to net income of $6,679 in the same period in 2022.
- Diluted earnings per ordinary share of $0.40 for the three months ended March 31, compared to earnings of $0.09 per share for the same period in 2022.
Rivian Automotive, Inc.
All currency listed in millions of US dollars, except earnings per share.
Selected highlights from their first quarter 2023 financial results on May 9, 2023
- Revenue of $661 for the three months ended March 31, compared to $95 for the same period in 2022. An increase of over 695%.
- Net loss of $1,349 for the three months ended March 31, compared to a net loss of $1,593 in the same period in 2022.
- Diluted loss per ordinary share of $1.45 for the three months ended March 31, compared to a loss of $1.77 per share for the same period in 2022.
Nuvei Corporation
All currency listed in thousands of US dollars, except earnings per share.
Selected highlights from their first quarter 2023 financial results on May 10, 2023
- Revenue of $256,498 for the three months ended March 31, compared to $214,544 for the same period in 2022. An increase of over 4%.
- Net loss of $8,289 for the three months ended March 31, compared to net income of $4,514 in the same period in 2022.
- Diluted loss per ordinary share of $0.07 for the three months ended March 31, compared to earnings of $0.02 per share for the same period in 2022.
Magnite, Inc.
All currency listed in thousands of US dollars, except earnings per share.
Selected highlights from their first quarter 2023 financial results on May 10, 2023
- Revenue of $130,150 for the three months ended March 31, compared to $118,075 for the same period in 2022. An increase of over 10%.
- Net loss of $98,732 for the three months ended March 31, compared to a net loss of $44,593 in the same period in 2022.
- Diluted loss per ordinary share of $0.73 for the three months ended March 31, compared to a loss of $0.34 per share for the same period in 2022.
The Trade Desk, Inc.
All currency listed in thousands of US dollars, except earnings per share.
Selected highlights from their first quarter 2023 financial results on May 10, 2023
- Revenue of $382,803 for the three months ended March 31, compared to $315,323 for the same period in 2022. An increase of over 21%.
- Net income of $9,326 for the three months ended March 31, compared to a net loss of $14,598 in the same period in 2022.
- Diluted earnings per ordinary share of $0.02 for the three months ended March 31, compared to a loss of $0.03 per share for the same period in 2022.
Unity Software Inc.
All currency listed in thousands of US dollars, except earnings per share.
Selected highlights from their first quarter 2023 financial results on May 10, 2023
- Revenue of $500,361 for the three months ended March 31, compared to $320,126 for the same period in 2022. An increase of over 56%.
- Net loss of $253,703 for the three months ended March 31, compared to a net loss of $177,555 in the same period in 2022.
- Diluted loss per ordinary share of $0.67 for the three months ended March 31, compared to a loss of $0.60 per share for the same period in 2022.
Copperleaf Technologies Inc.
All currency listed in thousands of Canadian dollars, except earnings per share.
Selected highlights from their first quarter 2023 financial results on May 10, 2023
- Revenue of $19,966 for the three months ended March 31, compared to $15,569 for the same period in 2022. An increase of over 28%.
- Net loss of $11,790 for the three months ended March 31, compared to net loss of $10,906 in the same period in 2022.
- Diluted loss per ordinary share of $0.17 for the three months ended March 31, compared to a loss of $0.16 per share for the same period in 2022.
Algonquin Power & Utilities Corp.
All currency listed in thousands of US dollars, except earnings per share.
Selected highlights from their first quarter 2023 financial results on May 11, 2023
- Revenue of $778,627 for the three months ended March 31, compared to $733,237 for the same period in 2022. An increase of over 6%.
- Net income of $249,610 for the three months ended March 31, compared to net income of $52,598 in the same period in 2022.
- Diluted earnings per ordinary share of $0.39 for the three months ended March 31, compared to earnings of $0.13 per share for the same period in 2022.
Trisura Group Ltd.
All currency listed in thousands of Canadian dollars, except earnings per share.
Selected highlights from their first quarter 2023 financial results on May 11, 2023
- Revenue of $639,100 for the three months ended March 31, compared to $403,669 for the same period in 2022. An increase of over 58%.
- Net income of $13,976 for the three months ended March 31, compared to net income of $23,338 in the same period in 2022.
- Diluted earnings per ordinary share of $0.30 for the three months ended March 31, compared to earnings of $0.55 per share for the same period in 2022.
Docebo Inc.
All currency listed in thousands of US dollars, except earnings per share.
Selected highlights from their first quarter 2023 financial results on May 11, 2023
- Revenue of $41,549 for the three months ended March 31, compared to $32,055 for the same period in 2022. An increase of over 29%.
- Net income of $1,245 for the three months ended March 31, compared to a net loss of $3,747 in the same period in 2022.
- Diluted earnings per ordinary share of $0.04 for the three months ended March 31, compared to a loss of $0.21 per share for the same period in 2022.
GDI Integrated Facility Services Inc.
All currency listed in thousands of Canadian dollars, except earnings per share.
Selected highlights from their first quarter 2023 financial results on May 11, 2023
- Revenue of $591 for the three months ended March 31, compared to $495 for the same period in 2022. An increase of over 19%.
- Net income of $4 for the three months ended March 31, compared to net income of $7 in the same period in 2022.
- Diluted earnings per ordinary share of $0.15 for the three months ended March 31, compared to earnings of $0.30 per share for the same period in 2022.
WELL Health Technologies Corp.
All currency listed in thousands of US dollars, except earnings per share.
Selected highlights from their first quarter 2023 financial results on May 12, 2023
- Revenue of $169,425 for the three months ended March 31, compared to $126,508 for the same period in 2022. An increase of almost 34%.
- Net loss of $10,627 for the three months ended March 31, compared to a net loss of $2,776 in the same period in 2022.
- Diluted loss per ordinary share of $0.06 for the three months ended March 31, compared to a loss of $0.04 per share for the same period in 2022.
Portfolio 2
Portfolio 2 for the week ended May 12, 2023: UP ![]()
- Guardant Health (NASD: GH) filled out its executive team with the hiring of a new chief operating officer from outside the company and the promotion of another person into the role of chief technology officer.
- The House of the Mouse stumbled after Walt Disney (NYSE: DIS) missed its earnings per share estimate by a penny. The quarterly report also showed Disney lost over four million subscribers to its Disney+ streaming service after it raised the monthly fee. Despite the loss of subscribers, Disney+ did mange to shrink the losses thank to the higher prices. The company plans to raise the fee for the ad free service. I suspect this is to nudge people to their ad supported service where they may feel the can gain advertising fees.
Activity
Bought: Hammond Power Solutions – This small cap Canadian company manufactures electronic devices for diverse markets. I like that it is well established company (100+ years), and a descendant of the founding owner still runs the company. The company is riding a major tailwind of a global movement to electrify the world. On the financials side, the company has growing revenues, net income, earnings per share and free cash flow. It provides a small dividend put I bought it for the growth potential. There is lots of room for the company to grow and if the company goes from a small cap company to a large cap company, the share price will follow.
Bought: A cashable, 1-year GIC paying 3.35% through my TD Direct Investing account. The GIC will pay 3.35% on a small amount of cash sitting in a trading account. Once I figure out what to do with the cash, I can cash out the GIC without any penalties. Until then, at least the cash will be earning something which is a better than nothing. 😊
Dividends
Dividends Received this week for the following companies:
Companies followed by DRIP (Dividend Re-Investment Plan) indicate additional shares were purchased with the dividend. Any cash leftover was added to the cash balance.
No dividends this past week.
Quarterly Reports
Chorus Aviation Inc.
All currency listed in thousands of Canadian dollars, except earnings per share.
Selected highlights from their first quarter 2023 financial results on May 9, 2023
- Revenue of $415,252 for the three months ended March 31, compared to $342,380 for the same period in 2022. An increase of over 21%.
- Net income of $32,019 for the three months ended March 31, compared to net income of $22,907 in the same period in 2022.
- Diluted earnings per ordinary share of $0.11 for the three months ended March 31, compared to earnings of $0.13 per share for the same period in 2022.
Crew Energy Inc.
All currency listed in Canadian dollars, except earnings per share.
Selected highlights from their first quarter 2023 financial results on May 8, 2023
- Revenue of $112,812 for the three months ended March 31, compared to $53,688 for the same period in 2022. An increase of over 210%.
- Net income of $41,354 for the three months ended March 31, compared to a net loss of $1,377 in the same period in 2022.
- Diluted earnings per ordinary share of $0.26 for the three months ended March 31, compared to a loss of $0.01 per share for the same period in 2022.
kneat.com, inc.
All currency listed in thousands of Canadian dollars, except earnings per share.
Selected highlights from their first quarter 2023 financial results on May 9, 2023
- Revenue of $7,964,908 for the three months ended March 31, compared to $5,199,602 for the same period in 2022. An increase of over 53%.
- Net loss of $2,474,357 for the three months ended March 31, compared to a net loss of $3,426,260 in the same period in 2022.
- Diluted loss per ordinary share of $0.03 for the three months ended March 31, compared to a loss of $0.04 per share for the same period in 2022.
Guardant Health, Inc.
All currency listed in thousands of US dollars, except earnings per share.
Selected highlights from their first quarter 2023 financial results on May 9, 2023
- Revenue of $128,714 for the three months ended March 31, compared to $96,099 for the same period in 2022. An increase of almost 34%.
- Net loss of $133,533 for the three months ended March 31, compared to a net loss of $123,228 in the same period in 2022.
- Diluted loss per ordinary share of $1.30 for the three months ended March 31, compared to a loss of $1.21 per share for the same period in 2022.
Airbnb, Inc.
All currency listed in millions of US dollars, except earnings per share.
Selected highlights from their first quarter 2023 financial results on May 9, 2023
- Revenue of $1,818 for the three months ended March 31, compared to $1,509 for the same period in 2022. An increase of over 20%.
- Net income of $117 for the three months ended March 31, compared to a net loss of $19 in the same period in 2022.
- Diluted earnings per ordinary share of $0.18 for the three months ended March 31, compared to a loss of $0.03 per share for the same period in 2022.
The Walt Disney Company
All currency listed in millions of US dollars, except earnings per share.
Selected highlights from their second quarter 2023 financial results on May 10, 2023
- Revenue of $21,815 for the three months ended March 31, compared to $19,249 for the same period in 2022. An increase of over 13%.
- Net income of $1,271 for the three months ended March 31, compared to net income of $470 in the same period in 2022.
- Diluted earnings per ordinary share of $0.69 for the three months ended March 31, compared to earnings of $0.26 per share for the same period in 2022.
- Revenue of $45,327 for the six months ended March 31, compared to $41,068 for the same period in 2022. An increase of over 10%.
- Net earnings of $2,849 for the six months ended March 31, compared to net earnings of $1,797 in the same period in 2022.
- Diluted earnings per ordinary share of $1.39 for the six months ended March 31, compared to earnings of $0.86 per share for the same period in 2022.
iA Financial Group
All currency listed in millions of Canadian dollars, except earnings per share.
Selected highlights from their first quarter 2023 financial results on May 9, 2023
- Revenue of $1,359 for the three months ended March 31, compared to $1,230 for the same period in 2022. An increase of over 10%.
- Net income of $270 for the three months ended March 31, compared to a net loss of $25 in the same period in 2022.
- Diluted earnings per ordinary share of $2.58 for the three months ended March 31, compared to a loss of $0.23 per share for the same period in 2022.
Portfolio 3
Portfolio 3 for the week ended May 12, 2023: UP ![]()
- When I heard TD Bank (TSX: TD) was pulling out of the deal with First Horizon Bank (NASD: FHN) I thought it was because they viewed it as too risky given the issues in the US regional bank industry. It turns out the problem was TD’s anti-money laundering practises that caused US regulators to reject the deal. TD promised to tighten up its anti-money laundering policies, but promises were not good enough for the regulators to provide their stamp of approval to the deal. TD is now sitting on a pile of cash. What will they do with it?
Activity
No significant activity to report this week.
Dividends
Dividends Received this week for the following companies:
Companies followed by DRIP (Dividend Re-Investment Plan) indicate additional shares were purchased with the dividend. Any cash leftover was added to the cash balance.
No dividends this past week.
Quarterly Reports
goeasy Ltd.
All currency listed in thousands of Canadian dollars, except earnings per share.
Selected highlights from their first quarter 2023 financial results on May 9, 2023
- Revenue of $287,297 for the three months ended March 31, compared to $232,142 for the same period in 2022. An increase of almost 24%.
- Net income of $51,436 for the three months ended March 31, compared to net income of $26,096 in the same period in 2022.
- Diluted earnings per ordinary share of $3.01 for the three months ended March 31, compared to earnings of $1.55 per share for the same period in 2022.
kneat.com, inc.
All currency listed in thousands of Canadian dollars, except earnings per share.
Selected highlights from their first quarter 2023 financial results on May 9, 2023
- Revenue of $7,964,908 for the three months ended March 31, compared to $5,199,602 for the same period in 2022. An increase of over 53%.
- Net loss of $2,474,357 for the three months ended March 31, compared to a net loss of $3,426,260 in the same period in 2022.
- Diluted loss per ordinary share of $0.03 for the three months ended March 31, compared to a loss of $0.04 per share for the same period in 2022.
Alvopetro Energy Ltd.
All currency listed in thousands of US dollars, except earnings per share.
Selected highlights from their first quarter 2023 financial results on May 10, 2023
- Revenue of $18,005 for the three months ended March 31, compared to $13,134 for the same period in 2022. An increase of over 37%.
- Net income of $12,202 for the three months ended March 31, compared to net income of $11,115 in the same period in 2022.
- Diluted earnings per ordinary share of $0.33 for the three months ended March 31, compared to earnings of $0.30 per share for the same period in 2022.
Magnite, Inc.
All currency listed in thousands of US dollars, except earnings per share.
Selected highlights from their first quarter 2023 financial results on May 10, 2023
- Revenue of $130,150 for the three months ended March 31, compared to $118,075 for the same period in 2022. An increase of over 10%.
- Net loss of $98,732 for the three months ended March 31, compared to a net loss of $44,593 in the same period in 2022.
- Diluted loss per ordinary share of $0.73 for the three months ended March 31, compared to a loss of $0.34 per share for the same period in 2022.
Unity Software Inc.
All currency listed in thousands of US dollars, except earnings per share.
Selected highlights from their first quarter 2023 financial results on May 10, 2023
- Revenue of $500,361 for the three months ended March 31, compared to $320,126 for the same period in 2022. An increase of over 56%.
- Net loss of $253,703 for the three months ended March 31, compared to a net loss of $177,555 in the same period in 2022.
- Diluted loss per ordinary share of $0.67 for the three months ended March 31, compared to a loss of $0.60 per share for the same period in 2022.
Brookfield Corporation
All currency listed in millions of US dollars, except earnings per share.
Selected highlights from their first quarter 2023 financial results on May 11, 2023
- Revenue of $23,297 for the three months ended March 31, compared to $21,882 for the same period in 2022. An increase of over 6%.
- Net income of $424 for the three months ended March 31, compared to net income of $2,960 in the same period in 2022.
- Diluted earnings per ordinary share of $0.05 for the three months ended March 31, compared to earnings of $0.84 per share for the same period in 2022.
GDI Integrated Facility Services Inc.
All currency listed in thousands of Canadian dollars, except earnings per share.
Selected highlights from their first quarter 2023 financial results on May 11, 2023
- Revenue of $591 for the three months ended March 31, compared to $495 for the same period in 2022. An increase of over 19%.
- Net income of $4 for the three months ended March 31, compared to net income of $7 in the same period in 2022.
- Diluted earnings per ordinary share of $0.15 for the three months ended March 31, compared to earnings of $0.30 per share for the same period in 2022.
 Imagine you are out on the open ocean on a three-hour tour on the trusty yacht, let us call it the Minnow. Like the waves of the ocean, the stock market can be choppy and unpredictable at times. That is where the CBOE Volatility Index, or the VIX, comes in as your handy-dandy wave forecast!