
Weekly Update for the week ending July 11, 2025

What’s BRICS, and Why Is It Back in the Headlines?

I first heard the term BRIC – referring to Brazil, Russia, India, and China – back in the late 1990s when I was researching high-growth mutual funds. The pitch was that these were fast-growing economies, and investing in a BRIC-focused fund would add a boost to a long-term portfolio. I ended up passing on the fund… and promptly forgot about BRIC.

Fast forward to today, and the term is back in the spotlight – this time with an “S” on the end, as South Africa officially joined the group in 2010. With BRICS now grabbing headlines again, I thought it was a good time to revisit what the group is and why it’s suddenly become a target of President Trump’s latest trade threats.

The term BRICS refers to a group of five major emerging economies—Brazil, Russia, India, China, and South Africa—that have been working together since the late 2000s to increase their global economic and political influence. These countries share fast-growing markets, large populations, and a desire to reshape global institutions traditionally led by the US and its allies.

In 2023, the BRICS group announced plans to expand, inviting six new countries to join:
Egypt, Ethiopia, Iran, Saudi Arabia, the United Arab Emirates (UAE), and Argentina (though Argentina later declined after a change in government). The expansion signalled a push to build a broader coalition of countries exploring alternatives to the US-led global financial system – including reducing reliance on the US dollar and deepening trade ties within the group.

So why are BRICS back in the headlines?

President Trump recently threatened to impose an additional 10% tariff on goods from any country that aligns itself with BRICS. It’s part of his broader trade strategy aimed at reasserting US dominance and discouraging countries from joining or supporting global blocs seen as rivals to American influence. By using tariffs as a stick, Trump is trying to pressure potential BRICS partners and frame the group as a geopolitical threat.

For investors, this adds yet another layer of trade uncertainty, especially since BRICS includes major American trading partners like China and India, and fast-growing economies like Saudi Arabia and the UAE. As we’ve seen in past trade disputes, tariff threats can rattle markets, disrupt supply chains, and put pressure on everything from stock prices to commodity costs.

With that global backdrop in mind, let’s take a look at how the Canadian and American markets performed this past week and what drove the markets.


Items that may only interest or educate me ….

Nvidia #1, Liberation Day, 50% Tariff on Brazil, Canadian Economic news, US Economic news, .…

Nvidia Becomes World’s Most Valuable Public Company

This past week, artificial intelligence (AI) powerhouse Nvidia (NASD: NVDA) became the first publicly traded company to surpass a US$4 trillion market cap – making it the most valuable public company in the world. As of July 11, Nvidia’s share price is up around 22% year-to-date, and that’s even after a sharp drop in early April. Not bad for six months. 😊

To put that in perspective, Nvidia is now worth more than the entire Canadian economy.

What Is Liberation Day? A Key Moment in Trump’s Trade Agenda

“Liberation Day” refers to April 2, 2025, when President Trump announced sweeping new tariffs on all US trading partners – calling it a move to “liberate” American industry from what he described as unfair global trade practices. The name quickly stuck (at least in headlines), and the day became shorthand for a major escalation in US trade policy.

Just a week later, on April 9, following a sharp market sell-off, the US administration hit pause. It announced a 90-day delay on most of the new tariffs (while keeping a 10% baseline in place), saying the pause would allow time for countries to negotiate new bilateral deals with the US. The move calmed markets temporarily, but it also added a layer of uncertainty. Would the full tariffs still take effect? Would some countries get exemptions? Investors were left guessing.

Then, just before the pause was set to expire on July 9, Trump extended the deadline to August 1 and began rolling out country-specific tariffs—including 25% tariffs on Japan and South Korea. These were part of his “reciprocal” tariff approach, targeting countries the administration views as having unfair trade imbalances with the US. The higher rates likely serve as negotiating pressure, while the extension may have been designed to give a few pending deals more time to close.

For markets, this kind of unpredictability matters. Tariffs raise costs for businesses and disrupt global supply chains, while sudden shifts – like a sweeping announcement, followed by a pause, then a delay – rattle investor confidence and fuel volatility. It’s a reminder that policy risk is real, and when trade signals get murky, markets take notice.

Trump Slaps 50% Tariff on Brazil—But This One’s Personal

Trade tensions flared up again this past week as President Trump announced a 50% tariff on all Brazilian imports, set to begin on August 1. The hefty tariff was in response to Brazil’s ongoing trial of former president Jair Bolsonaro – who Trump called “a patriot.” He framed the move as retaliation against what he described as a political witch hunt, making this one of the most politically charged trade actions in recent history.

This isn’t just another tariff – it’s unprecedented. While past American tariffs have usually focused on trade deficits or national security concerns, this one is aimed directly at a foreign country’s legal system. It’s the steepest tariff Trump has announced so far in 2025, and it’s not tied to any specific industry – it covers all goods coming from Brazil.

For investors, this adds a new layer of unpredictability to global trade. Brazil is a major exporter of everything from coffee and orange juice to steel and aircraft, and a 50% tariff could mean higher prices on everyday items and more volatility in commodity and emerging markets. For those who rely on a morning cup of coffee to kickstart their day, that daily habit could soon cost a bit more. The Brazilian real dropped sharply on the news, and Brazilian exporters like Embraer and Petrobras took an immediate hit.

With tariffs now being used as tools of political pressure, the line between trade and diplomacy is getting blurry – and that could mean more market swings ahead.

Canadian Economic news

This past week’s key economic data that the Bank of Canada (BoC) considers when deciding whether to raise or lower the interest rate.

Labour Force Survey (LFS)

Canada’s economy added 83,100 jobs in June – its first net gain since January and a big upside surprise compared to expectations for a 3,000-job decline (and May’s modest 8,800 increase). That strength helped pull the unemployment rate down to 6.9%, better than the expected 7.1% and reversing a recent upward trend.

One yellow flag: most of the new jobs were part-time, accounting for about 84% of the total, which may temper some of the optimism.

Wage growth also cooled slightly. Average hourly wages for permanent employees rose 3.2% year-over-year, down from 3.4% in May, while the average hourly wage slipped to C$36.01 from C$36.14.

The strong hiring numbers, especially alongside slowing population growth, point to a more resilient economy than many had expected, raising the odds of stronger-than-expected second quarter economic growth. However, this labour market strength, combined with ongoing trade uncertainty, has dimmed hopes for a BoC rate cut in July. Analysts now see September as the earliest possibility, depending on the next inflation report.

Canadian Market Volatility

Canada’s volatility barometer, the S&P/TSX 60 Volatility Index (VIXC), opened the week at 10.31 and briefly spiked to 10.71 in early trading. But it quickly dropped below 9.0 after the US extended its tariff deadline to August 1, easing some market tension. The VIXC fell as low as 7.16 before bouncing back above 8.7 following President Trump’s threat of a 35% tariff on all Canadian goods not covered by the CUSMA trade agreement. It ended the week at 9.21 – suggesting that while investors remain cautious, many are taking Trump’s latest threat with a grain of salt.

Aside from the risk around potential 50% tariffs on copper, investors mostly remained optimistic that a Canada – US trade deal could come together in the coming weeks.

If you’re new to the VIXC, think of it as Canada’s version of a fear gauge. A reading below 10 suggests investors are feeling pretty calm. Between 10 and 20 signals a steady, business-as-usual market. But once it climbs above 20, that’s when nerves show up and volatility starts to pick up.

US Economic news

This past week’s key data points that the Federal Reserve (Fed) considers when deciding whether to raise or lower the interest rate.

Federal Open Market Committee minutes

The Fed released minutes this past week from its June 17–18 Federal Open Market Committee (FOMC) meeting, offering a glimpse into how members were thinking about interest rates and the economy. As expected, they left the benchmark rate unchanged at 4.25%–4.50%, sticking with a wait-and-see approach as they navigate mixed economic signals.

Inflation is still heading in the right direction (down), but only gradually. Fed officials described it as “somewhat elevated,” especially with the risk that new tariffs could push prices higher. The labour market is still strong overall, though there are early signs of softening.

What stood out in the minutes was a clear divide: seven officials don’t expect any rate cuts this year, while a few are open to easing – possibly as soon as September. But that’s far from guaranteed. The Fed made it clear they want more convincing evidence that inflation is cooling sustainably and that tariff-driven price pressures aren’t making a comeback.

Investors had been hoping for a July rate cut, but a strong labour report the previous week, coupled with lower weekly jobless numbers, pushed those hopes back to September at the earliest. Even that will depend on how upcoming data – like inflation, jobs, and trade – shape up.

Bottom line: the Fed is in no rush. And with tariffs now in the mix, the path to lower rates just got a little more complicated.

American Market Volatility

Wall Street’s “fear gauge,” the CBOE Volatility Index (VIX), started the week on relatively calm footing, opening at 17.47 and continuing the downward drift from the previous week. It briefly climbed to 18.50 on Monday after the US announced 25% tariffs on key trading partners Japan and South Korea, but then eased steadily lower, falling as far as 15.7. Late in the week, President Trump’s threat of 35% tariffs on Canadian imports sent the VIX back above 17, before it ultimately settled at 16.40 – still within the “normal” range, but a clear reminder that markets are still on edge as Trump continues to shake up the global trade landscape.

If you’re new to the VIX, think of it as a real-time pulse check on investor nerves. It tends to rise when markets get jittery – whether it’s due to geopolitical tensions, inflation surprises, or uncertainty around interest rates. When investors start pulling back from higher-risk stocks like tech, price swings get bumpier, and that’s when the VIX starts to climb.

A VIX reading between 12 and 20 generally signals a steady, normal market. But once it climbs above 20, it means investors are starting to brace for more volatility. The higher it goes, the more market turbulence is being priced in.


Weekly Market and Portfolio Review

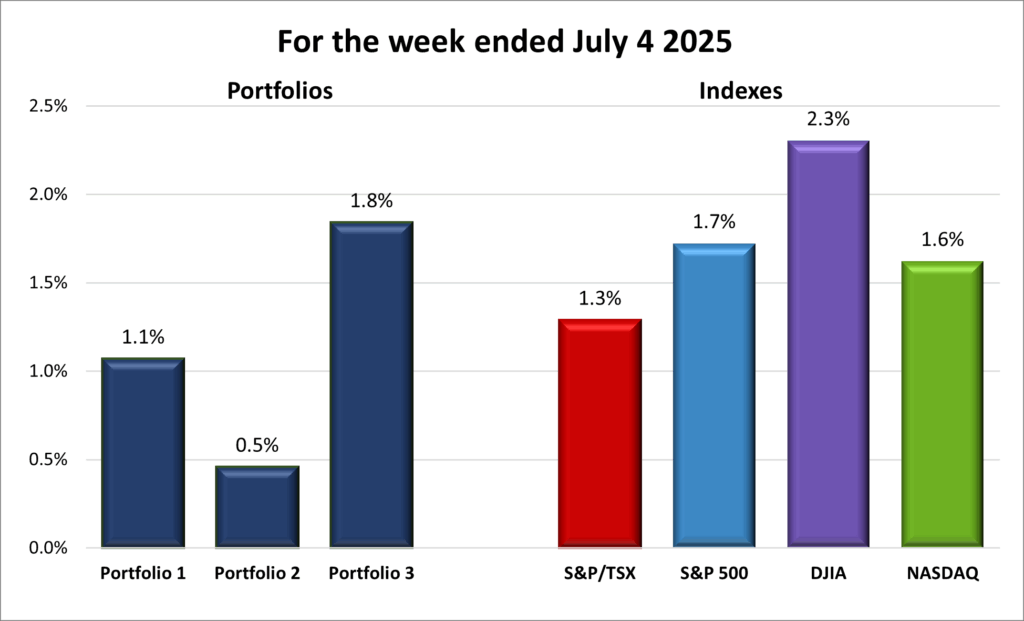
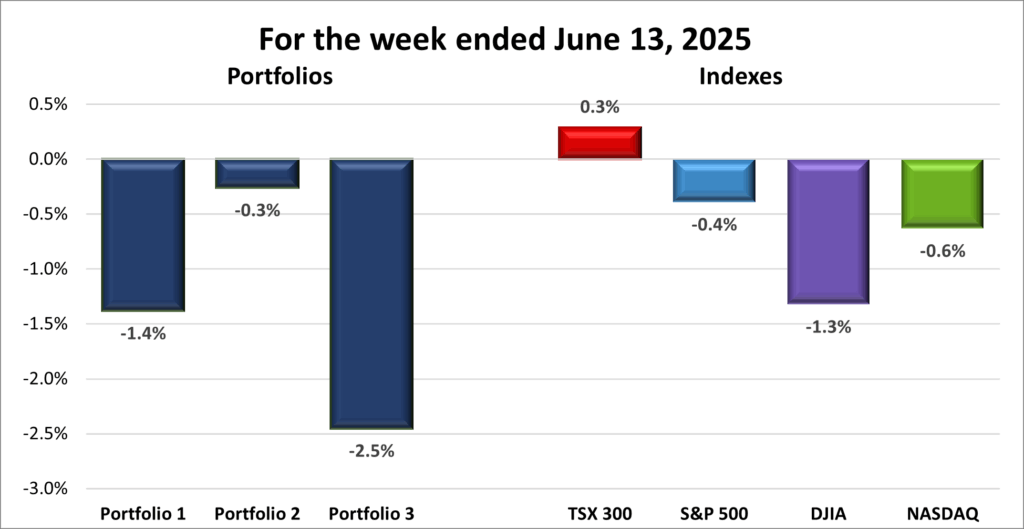
For the week, the TSX (SPTSX) was essentially flat, down 0.05%, the S&P 500 (SPX) lost 0.3%, the DJIA (INDU) fell 1.0% while the Nasdaq (CCMP) declined 0.1%.

Index Weekly Streak
TSX: 1 – week losing streak
S&P: 1 – week losing streak
DJIA: 1 – week losing streak
Nasdaq: 1 – week losing streak

Bearish market The week began with the Toronto Stock Exchange Composite Index (TSX), the S&P 500 Index (S&P), and the Nasdaq Composite Index (Nasdaq) all at record highs, with the Dow Jones Industrial Average (DJIA) not far behind. But markets stumbled early as President Trump reignited global trade tensions, injecting fresh uncertainty. Sentiment improved midweek, with the TSX, S&P and Nasdaq all hitting record highs, and all four indexes looked on track for another weekly gain – until a late-week barrage of new tariff threats halted the rally. By Friday’s close, all four had slipped into the red, as shown in the weekly progress chart above.

Trade concerns dominated the early part of the week. Trump announced 25% tariffs on imports from Japan and South Korea, plus 25%–40% tariffs on several other trading partners. He also floated an extra 10% levy on countries aligning with BRICS (Brazil, Russia, India, China, and South Africa). While the original July 9 deadline was pushed to August 1, offering temporary relief, it still left investors on edge. At week’s end, Trump escalated things further, threatening a 35% tariff on Canadian goods not covered by the CUSMA trade agreement and suggesting 15%–20% tariffs on all other US trading partners, up from the current 10% baseline.

He also added a 50% tariff on copper to the growing list of sector-specific levies, which already includes steel, aluminum, and auto parts. Pharmaceuticals could face tariffs of up to 200%, with semiconductors and other sectors still under investigation by the US Department of Commerce.

In a highly unusual move, Trump slapped a sweeping 50% tariff on all Brazilian imports, citing the trial of former president Jair Bolsonaro. It marked the first time a politically motivated, broad-based tariff has been imposed on a major US trade partner.

This steady stream of shifting deadlines, surprise announcements, and walk-backs has left investors on edge. Still, after Trump extended the deadline “one last time” and insisted there would be no further delays, markets regained some footing midweek. Many investors appear increasingly skeptical of Trump’s threats, having seen similar rhetoric softened in the past.

On the upside, markets got a lift from the long-awaited passage of Trump’s tax and spending bill, which includes several business-friendly provisions. A key campaign promise, its approval helped clear a major cloud of policy uncertainty.

Stronger-than-expected labour data also helped steady nerves. A robust June jobs report, coupled with another drop in weekly jobless claims, pointed to a labour market holding up well despite trade tensions.

Meanwhile, the Fed’s June meeting minutes revealed a split among policymakers. Some are now open to at least one rate cut this year, with several officials calling the inflationary effects of tariffs “temporary or modest.” Still, after two strong labour reports, a July cut now looks unlikely – pushing expectations to September at the earliest.

In Canada, looming American tariffs on key exports – like steel, aluminum, autos, and copper – pushed Ottawa to accelerate trade talks with other countries. The federal government is working to finalize a deal with the 10-member Association of Southeast Asian Nations bloc to reduce reliance on US trade. That pivot to new markets is both a defensive strategy and a long-term opportunity. That proactive tone helped lift investor sentiment and sent the TSX to a record high, before it pulled back following Trump’s latest threat.

Underscoring the urgency, Trump warned of a 35% tariff on all Canadian goods not made in the US, adding that any retaliation would be met with even higher tariffs. A move like that would hurt Canadian jobs – and Ottawa has made clear it’s ready to respond if talks break down.

Portfolio Weekly Streak
Portfolio 1: 1 – week losing streak
Portfolio 2: 1 – week losing streak
Portfolio 3: 1 – week losing streak`

Bearish market After three straight weeks of gains, my portfolios hit a speed bump, snapping their winning streaks, with all three ending the week lower – as shown in the chart below. Given how the major indexes performed, the pullback wasn’t all that surprising.

One notable move this week was transferring some Nvidia shares from Portfolio 1 to Portfolio 3. That helped rebalance Nvidia’s weight in Portfolio 1 – though it’s still the largest holding – and made it the new heavyweight in Portfolio 3, more than doubling the size of Shopify’s (TSE: SHOP) position, now the second-largest.

Portfolio 1 led the pack in a tough week, slipping 0.4%. That loss wasn’t too bad, considering only 39% of its holdings finished in the green. Nvidia’s all-time high, along with a 14% jump from Kraken Robotics (TSEV: PNG), helped cushion the drop. Another bright spot was Celestica (TSE: CLS), which hit a new record high. On the downside, Datadog (NASD: DDOG) fell 14%.

Portfolio 2 lost 0.6%, with just 29% of its holdings posting gains. A solid week for its oil stocks helped limit the damage, and Microsoft (NASD: MSFT) reaching a record high certainly didn’t hurt.

Portfolio 3 was the weakest of the three, down 0.8%. With only 22% of its holdings moving higher, the newly added Nvidia shares definitely softened the blow. Aside from Nvidia, Microsoft’s record high was the only other real standout.

It’s always a bit frustrating to see red across the indexes after a few solid weeks of green, but that’s investing—some weeks just don’t cooperate. Thankfully, a few bright spots (thank you, Nvidia!) helped limit the downside. The Nvidia transfer also gave Portfolio 3 a stronger growth engine and helped rebalance things overall. With earnings season approaching and President Trump still capable of rattling markets, I’m hopeful some great opportunities will appear. 😊

Weekly Portfolio & Index performance
Weekly Portfolio & Index performance for the week ended July 11, 2025.

Companies on the Radar

Stocks on my Radar With the start of a new week, three new companies made it onto my radar:

Mainstreet Equity Corp. (TSE: MEQ) is a Calgary-based real estate company focused on mid-market apartment buildings – typically under 100 units – across Western Canada. It acquires underperforming properties at below-market prices, renovates them, and increases rental income through improved operations. With strong demand for rental housing, a repeatable value-add strategy, and a solid balance sheet, Mainstreet offers a compelling mix of income and growth. Shares currently trade below net asset value, giving investors a margin of safety alongside steady cash flow and long-term upside.

Amer Sports (NYSE: AS) is a Finland-based sporting goods company that went public in February 2024. It owns premium global brands like Wilson, Salomon, Arc’teryx, Atomic, and Louisville Slugger, selling in over 100 countries. Revenue comes from both retail partners and a growing direct-to-consumer (DTC) segment through branded stores and online sales. With strong revenue growth, expanding DTC margins, and a valuation below peers, Amer offers an attractive mix of growth and value. As a consumer-focused company riding the health and outdoor trend, it’s definitely caught my eye.

Copart (NASD: CPRT) runs one of the world’s largest online vehicle auction platforms, specializing in salvage cars from accidents and natural disasters. It sells on behalf of insurers, dealerships, rental companies, and individuals. Copart earns revenue through transaction fees, storage, transportation, and listing services. Its digital model, global buyer network, and asset-light approach support strong margins and steady growth. With no long-term debt and rising tailwinds from vehicle values and insurance claims, it’s a steady growth story that’s earned a spot on my radar.

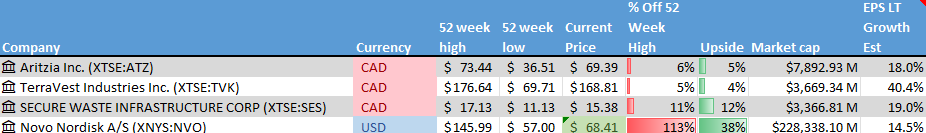
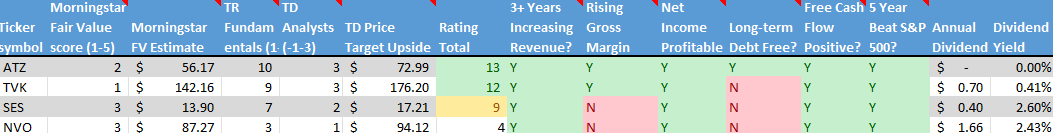
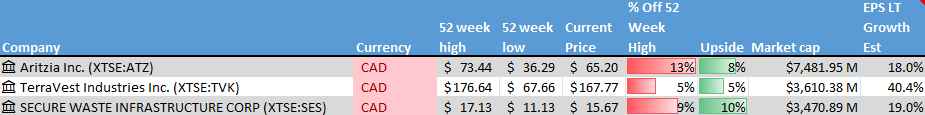
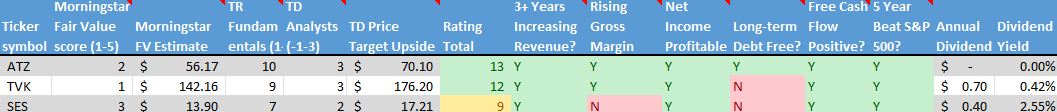
These three names join the four companies already on my radar last week: Aritzia, TerraVest, Secure Energy, and Novo Nordisk. Together, they span everything from real estate and retail to industrials, healthcare, and consumer goods – but they all share a few key traits: strong fundamentals, long-term demand drivers, and business models with long-term appeal. Here’s a quick recap of the four from the previous week:

  • Aritzia (TSE: ATZ): a fashion retailer and design house known for its upscale in-house brands of women’s clothing and accessories. It controls everything from design to distribution and sells through more than 130 boutiques across North America, along with a fast-growing online platform. Its main markets are Canada and the US, where it continues to expand.
  • TerraVest Industries (TSE: TVK): an industrial manufacturer serving the energy, agriculture, and transportation sectors across North America. Its products include propane tanks, ammonia storage vessels used in farming, natural gas transport vehicles, and various energy processing systems. It’s a solid operator in essential industries.
  • Secure Energy Services (TSE: SES): an industrial company that focuses on environmental and waste management services for energy and industrial clients. It offers recycling, disposal, and infrastructure support across North America. For anyone interested in sustainability and infrastructure, this one’s worth keeping an eye on.
  • Nordisk A/S (NYSE: NVO) Novo Nordisk is a global leader in diabetes and obesity care, thanks to products such as: Ozempic (for type 2 diabetes), Wegovy (for obesity), and Rybelsus (an oral version for diabetes). These products have pushed the company into the forefront of diabetes and medical weight loss solutions.

It’s a diverse group overall, but each company brings something compelling to the table – whether it’s steady income, breakout growth potential, or a strategic niche worth following.

As always, these are not buy recommendations. Make sure to do your own research and choose investments that fit your personal financial goals.

The Radar Check was last updated July 11, 2025.

Stock on the Radar List. 1 of 2.
Stock on the Radar List. 2 of 2.

Portfolio Updates

Portfolio 1

Transferred Out: Some Nvidia shares. Nvidia had grown to nearly 40% of Portfolio 1, so trimming it back has been on my to-do list for a while. At the same time, I was looking to add Nvidia to Portfolio 3. Instead of selling in one account and buying in the other – racking up two sets of transaction fees – I opted for a direct transfer. One move, two problems solved. 😊

And since the shares were held in a Tax-Free Savings Account (TFSA), there were no tax consequences on the transfer out of Portfolio 1.

Portfolio 3

Transferred In: Some Nvidia shares from Portfolio 1. These shares were originally in Portfolio 1’s TFSA, where gains are tax-free (hence the name “Tax-Free Savings Account” 😊). But to move them into Portfolio 3’s TFSA, they first had to pass through the regular cash account so the value at the time of entry into the TFSA could be recorded. That one-day stopover caused a small hiccup—Nvidia’s share price jumped a few bucks during the transfer window, triggering a capital gain. Since that gain happened in a taxable account, it’ll come with a small tax hit. ☹


That’s a wrap for this week, thanks for reading may your portfolio stay green and your dividends steady. See you next time!

Weekly Update for the week ending July 4, 2025

When Good News Is Bad News (and Vice Versa)

This week brought a steady stream of US labour market data, and you might’ve noticed something that feels a little backwards: sometimes good news about jobs or the economy makes stocks fall, while disappointing news sends markets higher. At first, this can be hard to wrap your head around. After all, if more people are working and businesses are hiring, that should be a positive sign, right? But markets don’t just react to the data itself – they react to what that data means for interest rates and the US Federal Reserve’s (Fed) next move.

This week’s lineup included the Job Openings and Labor Turnover Survey (JOLTS), the ADP Employment Report, and the Employment Situation Summary (ESS). On the surface, stronger numbers might look like a win for both the economy and the markets. But for us investors, it’s not just about how the economy is doing. It’s about how that strength could affect inflation and whether the Fed will keep interest rates higher for longer.

When the economy shows signs of strength – like the solid job gains in June’s ESS or stronger-than-expected wage growth – investors start to worry that the Fed might delay cutting rates to keep inflation under control. Higher rates make borrowing more expensive for both businesses and consumers, which can slow spending, reduce profit margins, and weigh on company earnings. So even though strong hiring suggests a healthy economy, the market may see it as a reason to be cautious.

On the other hand, when labour market data comes in softer than expected – such as the job losses in the ADP report or signs of easing wage growth – markets can actually rally. That’s because weaker data may suggest inflation is cooling, which increases the odds of a Fed rate cut. Lower interest rates are typically good for stocks, especially in sectors like technology and consumer discretionary, where companies benefit from cheaper borrowing and investors are more willing to take on risk.

This constant back-and-forth between economic strength and interest rate expectations is why you’ll often hear the phrase “good news is bad news” in financial headlines. It’s not that investors want people to lose jobs or see growth stall. It’s that markets are always trying to anticipate what comes next. For long-term investors, it’s a reminder that markets are driven as much by expectations as by current conditions. Reacting emotionally to every data release is rarely a winning strategy.

When I first started paying attention to what moved the markets, this kind of upside-down reaction felt confusing. But over time, it started to make more sense. The key is recognizing that the market isn’t always looking for the strongest data – it’s looking for the right balance: steady growth, falling inflation, and the potential for lower interest rates. That’s why this week’s labour reports have been under the microscope – not just for what they say about jobs, but for what they might hint about the Fed’s next move and where markets could be headed next.

With that context in mind, let’s take a look at how the markets responded to the latest labour data this past week and what it meant for the major indexes and my portfolios.


Items that may only interest or educate me ….

Markets Primed for a Strong July, Canadian Economic News, US Economic News, ….

Markets Primed for a Strong July

As we kick off July, it’s worth noting that this month has historically been one of the stronger ones for both American and Canadian markets.

In the US, July has typically been a strong performer. Over the past few decades, the S&P 500 (S&P) has averaged solid gains during the month, making it one of the top three for returns. More recently, over the past ten years, it’s delivered average returns of over 3%, second only to November. The Nasdaq Composite Index (Nasdaq), with its heavy tech weighting, also tends to do well, often lifted by positive momentum and investor optimism heading into second-quarter earnings season.

In Canada, the Toronto Stock Exchange Composite Index (TSX) shows a similar, though slightly more muted, seasonal trend. July has typically brought average gains of around 2%, with no significant summer slowdown. While not as flashy as US performance, it’s still a steady month for Canadian stocks.

Of course, seasonality is just one factor. This July, investors are keeping a close eye on trade developments – especially the July 9 deadline to complete US trade deals – as well as the upcoming wave of earnings reports. If markets can navigate those events without too much turbulence, history suggests July could offer some helpful tailwinds.

Past performance is never guaranteed, but July has earned its reputation as a strong seasonal month. And this year, the setup looks cautiously optimistic.

Canadian Economic News

This past week’s key economic data that the Bank of Canada (BoC) considers when deciding whether to raise or lower the interest rate.

Canadian Market Volatility

Canada’s volatility barometer, the S&P/TSX 60 Volatility Index (VIXC), opened the week at 10.37. It dipped below 9.5 and mostly stayed between 8.5 and 10.5 during what turned out to be a fairly calm stretch for Canadian markets. The shortened trading week – split by the Canada Day holiday on Tuesday – wrapped up with the VIXC closing at 9.53.

If you’re new to the VIXC, think of it as Canada’s version of a fear gauge. When it dips below 10, it’s a sign that investors are feeling relaxed. A range between 10 and 20 signals a steady, business-as-usual market. And once it climbs above 20, that’s when nerves start showing and volatility really starts to pick up.

US Economic news

This past week’s key data points that the Fed considers when deciding whether to raise or lower the interest rate.

Labour data

The latest updates from the JOLTS, the ADP Employment Report, and the ESS offer a snapshot of the US labour market. Together, they tell a story of a labour market that’s still holding up, but not without signs of softening beneath the surface.

JOLTS

The JOLTS report from the Bureau of Labor Statistics showed that job openings rose to 7.8 million in May, up from April’s revised 7.4 million and well above forecasts for a drop to 7.3 million. That’s the highest reading since November 2024, with most of the increase coming from the Leisure and Hospitality sector.

While that sounds great, the report also pointed to a slowdown in hiring, suggesting that companies are growing more cautious about bringing on new staff amid ongoing economic uncertainty – especially with the July 9 tariff deadline looming. In short, demand for workers is still there, but business confidence is looking shaky.

For investors, this kind of “Goldilocks” data – strong job openings but not overheating – can be just what the markets like. It supports the idea of a soft landing, where inflation cools and growth slows without tipping the economy into recession. That’s good news for equities, particularly rate-sensitive sectors like tech and growth.

ADP Employment Report

In contrast, the ADP Employment Report painted a weaker picture. Private-sector jobs fell by 33,000 in June, marking the first decline since March 2023 and far below expectations for a 99,000 gain. May’s figure was also revised down to just a 29,000 increase.

This wasn’t a wave of layoffs, but rather a sign that employers are hesitant to hire or replace departing workers. Concerns about slowing growth, sticky inflation, and global risks like trade tensions are making businesses cautious. While not alarming on its own, this report adds to the sense that the labour market is gradually losing momentum – and that could push the Fed closer to a rate cut if future data tells a similar story.

ESS

Finally, the US Bureau of Labor Statistics’ ESS report for June showed the US economy added 147,000 jobs, beating expectations and slightly ahead of May’s revised 144,000. That marks four straight months of solid gains, reinforcing the idea that the labour market remains surprisingly resilient.

The unemployment rate dipped to 4.1%, defying forecasts for a third straight month at 4.2%. Wage growth cooled slightly, with average hourly earnings up 3.7% year-over-year, below the expected 3.9%. On a monthly basis, wages rose 0.2%, down from May’s 0.4%.

This is something of a sweet spot for the Fed: strong job creation but easing wage pressures. It helps reduce inflation risks but probably isn’t soft enough yet to justify a rate cut in July. Unless upcoming inflation data comes in much lower than expected, even a September cut is starting to look less likely.

Summary

Taken together, these three reports show a resilient but cooling labour market. There’s no sign of a sharp downturn, but the momentum is clearly slowing. For now, it’s a mixed bag – positive for growth, but not quite the kind of softness that would prompt the Fed to cut rates soon. For us investors, that means markets may continue to grind higher, but expectations for summer rate relief just took another hit.

American Market Volatility

Wall Street’s “fear gauge,” the CBOE Volatility Index (VIX), started the week on relatively calm footing, opening at 17.19 – quieter than we’ve seen in recent weeks. Easing geopolitical tensions, optimism around trade negotiations, and the lead-up to the July 4th long weekend all contributed to the more relaxed tone. The VIX hovered mostly between 16.25 and 17.25 through the shortened week before closing at 16.38 on Thursday, as investors packed it in early for the holiday.

For those new to the VIX, it’s often referred to as Wall Street’s stress meter. When investors grow uneasy about global issues – like ongoing conflicts in the Middle East – or domestic concerns such as inflation or rate hikes, they tend to step back from riskier assets like technology and other growth stocks. That pullback can lead to sharper price swings in the market, which is when the VIX tends to climb.

Readings between 12 and 20 typically signal that markets are behaving normally. But once it rises above 20, it suggests that investors are starting to brace for more volatility. The higher the number, the more market turbulence is being priced in.


Weekly Market and Portfolio Review

For the week, the TSX (SPTSX) rose 1.3%, the S&P 500 (SPX) advanced 1.7%, the DJIA (INDU) jumped 2.3% and the Nasdaq (CCMP) climbed 1.6%.

 
Index Weekly Streak
TSX: 2 – week winning streak
S&P: 2 – week winning streak
DJIA: 3 – week winning streak
Nasdaq: 3 – week winning streak

Bull market. A good week for the North American stock markets. It may have been a holiday-shortened week, with Canada Day and Independence Day celebrations closing markets on both sides of the border, but that didn’t stop stocks from pushing higher. The S&P, the TSX, and the Nasdaq all set new record highs multiple times during the week. Even the Dow Jones Industrial Average (DJIA) came close, finishing just 0.6% below its all-time high.

Once again, tariffs were front and centre – though this time with a more upbeat tone that helped fuel investor optimism. The week kicked off on solid footing after the US and China agreed to a trade framework, and Canada scrapped its planned digital services tax restarting Canada-US trade negotiations. Those two moves signalled progress in trade talks with two of America’s biggest partners and helped ease concerns about escalating tensions.

President Trump added to the optimism by confirming he wouldn’t extend the July 9 deadline for countries to strike trade deals with the US, removing a layer of uncertainty. Instead, the US is narrowing the scope of negotiations in hopes of wrapping up more agreements quickly. One such deal came through with Vietnam this week, lifting market sentiment and raising hopes that more countries could reach agreements before Tuesday’s deadline.

But in typical fashion, Trump later changed course. Toward the end of the week, he said he preferred applying simple tariff rates instead of pursuing complex individual negotiations. Starting as early as July 4, the US will begin notifying countries of standardized tariff levels – ranging from 10% to as high as 70% – marking a sharp departure from earlier deal-by-deal plans.

On the economic front, Trump’s massive tax and spending bill narrowly passed the Senate, needing a tiebreaker from Vice President Vance. The bill cleared Congress and was signed into law, and while markets didn’t react much, analysts warned that ballooning deficits could put pressure on the bond market and long-term borrowing costs.

Meanwhile, a flurry of US labour reports offered mixed signals. Job growth remains solid, wage growth is cooling, and there’s no sign of a sharp downturn. That’s good news for the economy, but not soft enough for a July rate cut. Elsewhere, in a speech overseas, Fed Chair Jerome Powell said the Fed remains cautious, pointing to trade uncertainty and the unknown effects of tariffs as reasons to hold off. With the benchmark rate still at 4.25% to 4.5%, the Fed wants to see whether inflation flares up again before making its next move.

In Canada, the economic outlook showed some challenges, with manufacturing output falling back to levels last seen in 2020, suggesting US tariffs are starting to take a toll. Still, the TSX managed to close at record highs each day during the shortened trading week. Investor optimism was lifted by the revival of US –Canada trade talks, sparked by Canada’s decision to cancel its digital services tax. This move, along with the US-Vietnam trade deal, raised hopes that more trade agreements could be completed before the July 9 deadline, easing uncertainty in the markets. Coupled with strong US labour data, investors felt more confident buying stocks and taking on a bit more risk, pushing the TSX to record highs.

So far, July is off to a strong start. Here’s hoping it keeps up for the rest of the month and beyond. 😊

Portfolio Weekly Streak
Portfolio 1: 3 – week winning streak
Portfolio 2: 3 – week winning streak
Portfolio 3: 3 – week winning streak

Bull market. A good week for the North American stock markets. To paraphrase The Kings’ classic “This Beat Goes On/Switchin’ to Glide,” the gains go on… and on… and on. 😊 It was another upbeat week for all three portfolios, each extending their weekly winning streak to three. While none managed to top the DJIA, the week’s top-performing index, Portfolio 3 did beat the other three major indexes, as shown in the performance chart below.

Portfolio 1 climbed 1.1% for the week, with 79% of its holdings in the green. Standout performers included Pulse Seismic (TSE: PSD), which jumped 18%, Datadog (NASD: DDOG), on inclusion in the S&P index, and Magnite (NASD: MGNI), both up 17%, and Carnival Corp. (NYSE: CCL), which rose 13%. A few names also reached new all-time highs: Celestica (TSE: CLS), Magnite, and CrowdStrike (NASD: CRWD). And then there’s Nvidia (NASD: NVDA), which surged to a record high, pushing its market valuation to an eye-popping US$3.89 trillion – cementing its spot as the world’s most valuable company and the undisputed leader in AI chipmaking.

The only damper? Energy stocks – all of them finished lower, limiting the week’s gains.

Portfolio 2 was the slowest of the bunch but still nudged up 0.5%. There were no major moves in either direction, though iA Financial (TSE: IAG) did hit an all-time high. Like the other portfolios, energy holdings were a drag on the portfolio. However, this was the only portfolio where two energy stocks actually finished higher: South Bow Corp (TSE: SOBO) and Whitecap Resources (TSE: WCP) managed modest gains.

Portfolio 3 led the way with a 1.8% weekly gain, with 80% of its holdings ending in the green. Magnite 17% gain was partly offset by a 10% drop in Alvopetro Energy (TSEV: ALV). Still, the broad strength across the rest of the portfolio helped push it to the top spot among the three this week.

All in all, it was another solid week across the board. The portfolios seem to have found their groove, and with markets still moving to a positive beat, here’s hoping the gains go on… and on… and on as July rolls on. 😊

Weekly Portfolio & Index performance
Weekly Portfolio & Index performance for the week ended July 4, 2025.

Companies on the Radar

Stocks on my Radar With the holiday-shortened week, I didn’t have much time to scout for new investing ideas, so my radar list is holding steady. For now, my list is included of the same four companies from the previous week:

  • Aritzia (TSE: ATZ): a fashion retailer and design house known for its upscale in-house brands of women’s clothing and accessories. It controls everything from design to distribution and sells through more than 130 boutiques across North America, along with a fast-growing online platform. Its main markets are Canada and the US, where it continues to expand.
  • TerraVest Industries (TSE: TVK): an industrial manufacturer serving the energy, agriculture, and transportation sectors across North America. Its products include propane tanks, ammonia storage vessels used in farming, natural gas transport vehicles, and various energy processing systems. It’s a solid operator in essential industries.
  • Secure Energy Services (TSE: SES): an industrial company that focuses on environmental and waste management services for energy and industrial clients. It offers recycling, disposal, and infrastructure support across North America. For anyone interested in sustainability and infrastructure, this one’s worth keeping an eye on.
  • Nordisk A/S (NYSE: NVO) Novo Nordisk is a global leader in diabetes and obesity care, thanks to products such as: Ozempic (for type 2 diabetes), Wegovy (for obesity), and Rybelsus (an oral version for diabetes). These products have pushed the company into the forefront of diabetes and medical weight loss solutions.

As always, these are not buy recommendations. Make sure to do your own research and choose investments that fit your personal financial goals.

The Radar Check was last updated July 4, 2025.

Stock on the Radar List. 1 of 2.
Stock on the Radar List. 2 of 2.

Portfolio Update

Portfolio 1

Sold: Nvidia After Nvidia’s incredible run over the past few years, I decided to trim a few shares this past week.

Nvidia has become one of the most valuable companies in the world, riding first the cloud computing/data centre wave and now the artificial intelligence (AI) boom. It’s been a huge winner in Portfolio 1. I still think it’s a great company with a long runway ahead, but its massive success has caused it to grow into an outsized position – at one point making up nearly 40% of the portfolio’s total value. As Nvidia went, so did the portfolio.

Trimming helps reduce my exposure to any one stock and brings my allocation back into balance. I also saw this as a good opportunity to lock in a bit of profit while the share price was at an all-time high. Even the strongest companies can face pullbacks, especially when expectations get ahead of earnings.

This wasn’t a big move – I’m still holding onto the majority of my shares. But after such a strong run, taking a few chips off the table felt like the right way to manage risk while staying invested in a company I still believe in.


That’s a wrap for this week, thanks for reading may your portfolio stay green and your dividends steady. See you next time!

Monthly Portfolio Update June 2025

Monthly Market and Portfolio Review

Bull market. A good week for the North American stock markets. Markets kicked off June with a bang, dipped mid-month, then came roaring back to close with back-to-back gains. The Toronto Stock Exchange Composite Index (TSX) rose 2.6%, the S&P 500 (S&P) jumped 5.0%, and the Nasdaq Composite Index (Nasdaq) surged 6.6%, with all three hitting record highs. The Dow Jones Industrial Average (DJIA) advanced 4.3%, flirting with its own all-time peak.

Early in the month, cooling US–China trade tensions and fresh hopes for rate cuts lifted investor sentiment – especially after President Trump publicly pressured the US Federal Reserve (Fed) to lower rates following soft jobs data. Oil prices climbed on news of Alberta wildfires and falling US output, boosting energy stocks despite some market jitters.

Mid-month brought volatility. Israeli airstrikes on Iran sent oil and gold prices soaring as investors rushed into safe-haven assets. Meanwhile, the Fed kept rates steady, signaling cuts were still possible – but not imminent. That put a damper on the rate-cut crowd.

By month-end, markets bounced back. A cease-fire between Israel and Iran lowered geopolitical risk, oil prices stabilized, and consumer sentiment improved. Inflation came in a bit hotter than expected, which kept the Fed cautious, but investors shrugged it off. Growth stocks, especially in technology, once again started to drive the markets.

With fresh talk of a July rate cut and geopolitical fears easing, investors piled into artificial intelligence (AI) leaders like Nvidia (NASD: NVDA) and Microsoft (NASD: MSFT), both of which hit new all-time highs. That momentum helped push the S&P and Nasdaq to record closes.

In Canada, the TSX followed a similar path. Oil and gold gains lifted the index early on, while optimism around US–Canada and US–China trade talks helped it reach record highs. But sentiment wobbled after the US doubled tariffs on Canadian steel and aluminum. On the economic front, the Bank of Canada held rates at 2.75%, with core inflation still near 3%, reinforcing expectations for a hold through summer.

Late in the month, President Trump walked away from trade talks over Canada’s retroactive digital services tax – but the Canadian government dropped the tax, reopening negotiations. With that last-minute positive twist, the TSX closed June at a record high. Not bad—not bad at all!

In short: June brought oil shocks, geopolitical flare-ups, trade drama, and inflation uncertainty – but markets powered through, extending the monthly win streak across all four indexes. With three of them closing at record highs and growth stocks back in favour, this summer rally just might have legs. 😊

Portfolio Monthly Streak
Portfolio 1: 2 – month winning streak
Portfolio 2: 3 – month winning streak
Portfolio 3: 2 – month winning streak

Bull market. A good week for the North American stock markets. May was always going to be a tough act to follow, but June held its own, delivering weekly gains in three out of four weeks. Portfolio 1 once again led the pack, outperforming all the major indexes (as shown in the chart below), while Portfolio 2 quietly extended its monthly win streak to three in a row.

Energy stocks helped kick things off early in the month, but it was the surge in tech, especially AI-related names, that really gave portfolios 1 and 3 a strong lift. Otherwise, it was a fairly quiet month on the trading front. The only move I made was selling Andlauer Healthcare Group (TSE: AND) after it was acquired by UPS (NYSE: UPS), with plans to redeploy that capital elsewhere.

With geopolitical tensions easing, inflation steady, and the potential for new trade deals on the horizon, the stage looks set for a promising summer rally. Keep your fingers crossed the upward momentum holds. 🌞

Monthly Portfolio & Index performance
Monthly Portfolio & Index performance for June 2025.

What My Three Portfolios Did in June

Portfolio 1 for June 2025: UP Green Up Arrow, signifying a positive week

Activity

International Brokers (NASD: IBKR): IBKR recently became more affordable for everyday investors. On June 18, 2025, the company completed a 4-for-1 stock split – the first in its history. That means every existing share was split into four, increasing the total number of shares while lowering the price per share from around $172at the time, to roughly $43.

This doesn’t change the value of the company itself, but it does make each share easier to buy. Lower share prices can help open the door to a wider pool of investors, especially those just starting out. While stock splits don’t boost a company’s fundamentals, they’re often seen as a vote of confidence in future growth—and a signal that management believes demand for the stock will keep growing.

Sold: Andlauer Healthcare Group Company (TSE: AND) see June 6, 2025 Weekly Update

Dividends Received this month:

Companies followed by DRIP (Dividend Re-Investment Plan) indicate additional shares were purchased with the dividend. Any cash leftover was added to the cash balance.

Canadian $

TMX Group Ltd (TSE: X)

Yellow Pages Ltd (TSE: Y)

Decisive Dividends (TSE: DE) DRIP

Dream Industrial Real Estate Investment Trust (TSE: DIR.UN) DRIP

CN Rail (TSE: CN)

Hammond Power Solutions (TSE: HPS.A)

Tourmaline Oil (TSE: TOU)

US $

Visa Inc. (NYSE: V)

Interactive Brokers Group Inc (NASD: IBKR)

Alphabet Inc (NASD: GOOGL)

Skyworks Solutions Inc (NASD: SWKS)

Home Depot Inc (NYSE: HD)

Quarterly Reports

CrowdStrike Holdings, Inc.

First quarter 2026 financial results on June 3, 2026

Carnival Corporation & plc

Second quarter 2025 financial results on June 24, 2025

Portfolio 2 for June 2025: UP Green Up Arrow, signifying a positive week

Activity

No significant activity to report this month.

Dividends Received this month:

Canadian $

Fortis (TSE: FTS)

Whitecap Resources Inc (TSE: WCP) DRIP

SmartCentres Real Estate Investment Trust (TSE: SRU.UN) DRIP

Brookfield Infrastructure Partners LP (TSE: BIP.UN)

Dream Industrial Real Estate Investment Trust (TSE: DIR.UN) DRIP

Brookfield Infrastructure Corp (TSE: BIPC)

iA Financial Corporation (TSE: IAG)

Tourmaline Oil (TSE: TOU)

Hammond Power Solutions (TSE: HPS.A)

US $

Zoetis Inc (NYSE: ZTS)

Microsoft (NASD: MSFT)

Quarterly Reports

MongoDB, Inc.

First quarter 2026 financial results on June 4, 2026

Dollarama Inc.

First quarter 2025 financial results on June 11, 2025

Alimentation Couche-Tard Inc.

Fourth quarter 2025 financial results on June 25, 2025

Portfolio 3 for June 2025: UP Green Up Arrow, signifying a positive week

Activity

No significant activity to report this month.

Dividends Received this month:

Canadian $

Royal Bank of Canada (TSE: RY)

SmartCentres Real Estate Investment Trust (TSE: SRU.UN) DRIP

Brookfield Wealth Solutions (TSE: BNT)

Brookfield Renewable Corp (TSE: BEPC)

Brookfield Asset Management (TSE: BAM)

US $

Evolution AB (OTCM: EVVTY)

Microsoft (NASD: MSFT)

Vertiv Holdings (NYSE: VRT)

Quarterly Reports

Enghouse Systems Limited

Second quarter 2025 financial results on June 5, 2026

Weekly Update for the week ending June 27, 2025

Why a Ceasefire Between Israel and Iran Matters for the Markets

This week brought a rare dose of geopolitical relief as reports of a ceasefire between Israel and Iran signalled a potential cooling of tensions in the Middle East. For us investors, that kind of news matters more than you might think. While peace is always welcome from a humanitarian standpoint, it also tends to be good for the markets.

When tensions rise in the Middle East, especially between major regional powers like Israel and Iran, it adds a wave of uncertainty to global markets. Oil prices typically spike, safe-haven assets like gold and US Treasuries become more attractive, and stock markets often react with caution. That’s because the region plays a key role in the global energy supply, and any threat to that supply chain can ripple through industries and economies. Investors start to worry about rising fuel costs, supply disruptions, and the possibility of a wider military conflict.

In short, markets don’t like uncertainty (I know, I’ve said that before 😊). And few things create more uncertainty than the threat of war.

A ceasefire, on the other hand, brings a sense of stability, at least for now. It lowers the risk of further disruption to global energy supplies and offers investors a reason to feel more confident. That’s why markets rallied after the news. Oil prices edged down, the volatility index (VIX) fell, and sentiment improved. Even though the risks haven’t disappeared entirely, just the possibility that tensions are easing was enough to invite a bit of optimism back into the market.

From an investor’s perspective, reduced geopolitical risk gives companies more room to plan without hesitation. Business leaders are more likely to move ahead with hiring, capital spending, and expansion when they’re not facing added costs or global instability. A more predictable environment supports stronger corporate earnings, which helps drive stock prices higher.

The ceasefire also creates some space for central banks to stay focused on domestic conditions. Had the conflict escalated, we might have seen a sharp rise in oil prices and, in turn, a new wave of inflation. That would have made it harder for the Bank of Canada and the US Federal Reserve to begin lowering interest rates. With oil prices now more stable and a major geopolitical threat temporarily eased, central banks can take a steadier approach. For investors, this reduces the chance of monetary policy surprises, which can be a big driver of market volatility.

It’s also worth pointing out that a calmer global backdrop tends to draw investors back into riskier assets. When uncertainty is high, big institutional investors often park money in safer places or hold more cash. But when conditions start to look more stable, they tend to shift back into equities, including technology and other high-growth sectors. That rotation played out over the past few days, lifting the broader market and rewarding investors who stayed the course.

Of course, this doesn’t mean the situation is fully resolved. A ceasefire is different from lasting peace, and the situation could change again. But in the short term, this break in hostilities has been welcomed by the markets. It gives investors a chance to exhale and focus again on fundamentals like inflation, interest rates, and earnings.

This is a good reminder that global events, even those that don’t seem directly related to finance, can still affect your portfolio. Stability in one part of the world can ease pressure elsewhere, even if you don’t own energy or defence stocks. Everything is more connected than it might seem.

With that in mind, let’s take a look at what else moved the markets and the portfolios this past week.


Items that may only interest or educate me ….

Changing chairs, Canadian economic news, US economic news,

Changing Chairs: Trump Isn’t Happy with Powell

President Trump isn’t happy with US Federal Reserve (Fed) Chair Jerome Powell’s cautious ‘wait and see’ approach to interest rates. Rather than firing Powell outright – which could spook the markets – he’s suggested he might name Powell’s replacement well in advance. This way, markets have time to adjust, and the transition happens more smoothly.

The expectation is that the new Chair would be more in step with the president’s thinking and inclined to lower rates sooner than Powell has signaled. That could mean a quicker shift toward policies aimed at supporting economic growth and borrowing, rather than continuing with tighter conditions to fight inflation. Investors certainly viewed it this way, given Trump’s repeated criticism of the Fed chair for not lowering borrowing costs.

However, this raises an important concern. The Fed Chair is supposed to be an independent figure, making decisions based on data and economic conditions – not political pressure. If the successor is seen as too closely tied to the president’s wishes, especially if they’re expected to push for earlier rate cuts mainly to please political leaders, it could shake confidence in the Fed’s independence.

Markets generally don’t like the idea of political influence over the Fed because it can lead to decisions favouring short-term gains over long-term economic stability. If investors start worrying the Fed Chair is a “lackey” rather than an impartial policymaker, it could increase uncertainty and market volatility.

That said, the Fed’s structure and long Chair terms are designed to limit political interference. But perceptions matter a lot. If the new Chair is viewed as too close to the president, markets might react nervously until the Chair proves they can act independently.

For us investors, this situation means keeping a close eye on how the Fed’s messaging evolves and being prepared for some volatility as the Fed leadership transition approaches. The hope is for a smooth handoff that balances economic needs with Fed independence – but if anyone can turn a smooth transition into market drama, it’s President Trump.

Canadian Economic News

This past week’s key economic data that the Bank of Canada (BoC) considers when deciding whether to raise or lower the interest rate.

Consumer Price Index (CPI)

Statistics Canada reported that inflation held steady at 1.7% year-over-year in May, matching expectations and unchanged from April. On a monthly basis, the Consumer Price Index (CPI) rose 0.6%, slightly higher than April’s 0.5% increase.

The biggest driver of May’s monthly rise was a 1.9% jump in gasoline prices. Shelter costs were unchanged from April, making it the only major category that didn’t increase last month. Over the past year, food prices posted the largest gains, while gasoline had the biggest decline, falling 15.5%.

Shelter is still one of the biggest contributors to overall inflation, even as the pace has slowed. On an annual basis, housing-related costs rose 3.0% in May, down from 3.8% in April, signalling gradual cooling but ongoing pressure.

Core inflation, which strips out more volatile items like gas and food, provides a clearer picture of where prices are heading. It rose 0.6% in May and now sits at 2.6% year-over-year. That’s still above the BoC’s 2% target and suggests inflationary pressure is lingering in everyday goods and services.

While headline inflation appears stable, the underlying numbers tell a different story – and that’s likely what the BoC is watching most closely. For us investors, and for anyone borrowing money, this means the Bank is unlikely to cut interest rates at its next decision on July 30. With core inflation still above target, BoC policymakers are more likely to stay cautious and wait for clearer signs of sustained progress before easing up.

Gross Domestic Product (GDP)

Canada’s economy hit a bit of a speed bump in April. According to Statistics Canada, real GDP slipped by 0.1% compared to March, marking the first monthly decline since October. That dip followed a modest 0.2% gain in March and came after a solid first quarter, when the economy grew at a 2.2% annualized pace.

The pullback came mostly from the goods-producing side of the economy, which contracted by 0.6%. Manufacturing saw the sharpest drop, falling 1.9%, its biggest monthly decline in four years. The steep US tariffs on Canadian steel and aluminum, specifically the 25% tariff on steel and 10% on aluminum introduced earlier this year, are beginning to take a noticeable toll on Canada’s manufacturing sector. On the upside, the services sector managed a modest 0.1% gain, supported by finance, insurance, public administration, and recreation. These industries helped cushion the blow but not enough to keep GDP in positive territory.

Early estimates from StatsCan suggest the economy contracted again by 0.1% in May. If confirmed, that would make two consecutive months of economic decline and could pull second-quarter GDP into negative territory, stalling the momentum built in the first quarter.

Year over year, the economy expanded by 1.3% in April, down from 1.7% in March. While that still marks growth, the pace is slowing, weighed down by high interest rates, rising trade barriers, and softer global demand. One bright spot was the mining, quarrying, and oil and gas extraction sector, which grew 4.4% over the past year. Manufacturing, on the other hand, fell 2.4% compared to April 2024, highlighting the mounting pressure on Canadian exporters.

So while the economy is still growing on an annual basis, momentum is clearly fading. The slowdown reflects a combination of domestic headwinds, such as elevated borrowing costs, and external challenges, including trade friction and global economic uncertainty.

For us investors, this report brings a few key takeaways. Softer growth increases the likelihood that the BoC could cut interest rates at its July 30 meeting, especially with inflation easing. At the same time, signs of strain in certain parts of the economy could mean more volatility for sectors tied to consumer spending and exports. On the other hand, more stable, defensive sectors, like utilities, consumer staples, and steady dividend payers, could look increasingly appealing in a slower-growth environment.

Canadian Market Volatility

Canada’s volatility barometer, the S&P/TSX 60 Volatility Index (VIXC), opened the week at 10.31, a slight uptick from the previous Friday’s close of 9.86. That initial bump followed rising geopolitical tensions after a US airstrike on Iranian nuclear facilities. But the spike didn’t hold. The VIXC quickly dipped back below 10 and stayed in a narrow range between 8 and 10 for most of the week, reflecting a relatively calm Canadian market. It wasn’t until Friday that volatility edged higher again, climbing to 10.15 after President Trump abruptly ended trade talks with Canada over the digital services tax.

While the VIXC stayed calm, its US counterpart, the VIX, was above 20 at the start of the week, reflecting much higher anxiety south of the border. The Canadian market simply hasn’t been under the same pressure. Investors here don’t seem too concerned about a major market drop, and they haven’t been rushing to buy portfolio protection. That lack of demand for insurance-like strategies keeps volatility low.

It’s unusual to see this wide a gap between the two indexes, but not unheard of. It usually just means US investors are reacting to something Canada hasn’t been pulled into – at least not yet.

If you’re new to the VIXC, think of it as Canada’s version of a fear gauge. When it dips below 10, it’s a sign that investors are feeling relaxed. A range between 10 and 20 signals a steady, business-as-usual market. And once it climbs above 20, that’s when nerves start showing and volatility really starts to pick up.

US Economic News

This past week’s key data points that the Federal Reserve (Fed) considers when deciding whether to raise or lower the interest rate.

Consumer Confidence Index (CCI)

The Conference Board reported that American consumer confidence unexpectedly fell in June, dropping 5.4 points to 93.0, down from 98.4 in May and well below the expected rebound to 100. The decline came as a surprise to many analysts who had anticipated a continued rise in confidence. The pullback was broad-based, with people feeling more pessimistic about both current economic conditions and the outlook ahead.

The Present Situation Index, which reflects how people feel about current business and job conditions, fell to 129.1 from 135.9. The Expectations Index, which measures how consumers feel about the next six months, also reversed course, dropping to 69.0 from 72.8. That’s significant because readings below 80 on this index have historically signaled a heightened risk of recession.

Consumer morale slipped more than expected, mainly due to growing concerns about shrinking job opportunities, ongoing tariff tensions, and the impact of inflation on household budgets. For investors, falling consumer confidence is worth watching, as it often leads to reduced spending — a key driver of economic growth. If sentiment remains weak, it may be a sign that consumers are starting to pull back. Since consumer spending fuels the majority of the US economy, both the markets and the Fed will be keeping a close eye on where confidence goes from here.

Gross Domestic Product (GDP)

The US economy shrank more than expected in the first quarter of 2025, according to the final estimate from the Commerce Department. GDP fell at an annualized rate of 0.5%, worse than both the earlier 0.2% estimate and what analysts had been expecting. For comparison, the economy had grown at a healthy 2.4% pace in the fourth quarter of 2024.

The weaker result was mostly due to slower consumer spending, particularly on big-ticket items like vehicles, and a sharp surge in imports. Many businesses rushed to bring in goods ahead of new tariffs, and that spike dragged down GDP. Since imports subtract from GDP in the official calculation, the timing of those purchases made the economy appear softer than it actually may have been.

Most analysts see this Q1 dip as a temporary stumble rather than a sign of something more serious. The Atlanta Fed, for example, is currently forecasting a solid rebound in the second quarter, thanks in part to the drop in imports, with growth estimated around 3.4%.

For us investors, this is a good reminder that the economy can hit a few bumps without sliding into a recession. If the second quarter shows strong growth, the Fed is likely to stay cautious but steady on interest rates. But if momentum doesn’t return, rate cuts could be pushed further down the road.

Either way, it’s worth keeping an eye on the advance estimate for second-quarter GDP, set to be released on July 30. Economic surprises can shift the market’s mood quickly (and as I’ve said before, markets don’t like surprises). But for long-term investors, those shifts can also create new buying opportunities. 😊

Personal Consumption Expenditures (PCE)

In May, US inflation stayed relatively quiet, according to the latest numbers from the Commerce Department. The headline PCE price index, which measures price changes across the economy, rose 0.1%, matching April’s pace. On a year-over-year basis, headline PCE was up 2.3%, slightly higher than April’s 2.1%, and right in line with forecasts.

The real spotlight, though, was on core PCE, the Fed’s preferred inflation measure that strips out food and energy. It rose 0.2% in May after a milder 0.1% increase in April. On an annual basis, core PCE climbed to 2.7%, just above April’s 2.6%. While the increase wasn’t dramatic, it’s still above the Fed’s 2% target and enough to keep them cautious.

With core inflation running at 2.7%, the case for an immediate rate cut isn’t particularly strong. Still, the Fed is facing mounting political pressure. President Trump has been vocal about wanting lower rates, and a few Fed officials have hinted that cuts could be warranted if economic momentum continues to fade. That puts the central bank in a tight spot, trying to balance its inflation mandate with signs of slowing consumer demand, softening job data, and a political environment that’s heating up fast. While a July cut remains unlikely, the odds of a move later this summer are starting to climb.

Consumer Sentiment Index (CSI)

American consumer sentiment improved in June for the first time in six months. The University of Michigan’s final Consumer Sentiment Index rose to 60.7 from 52.2 in May, a strong jump but still well below recent highs. Sentiment remains 11% lower than in June 2024 and 18% below the post-election peak in December.

The rebound came from both major components of the index. The Current Conditions Index, which reflects how people feel about their personal finances and current economic conditions, climbed to 64.8 from 58.9 – a 10% gain from last month, though still slightly below year-ago levels. Rising prices and stagnant wages continue to weigh on household confidence.

The bigger leap came from the Expectations Index, which looks ahead to the next six months. It jumped to 58.1 from 47.9, up more than 21%. While that’s a significant recovery, it’s still well below the levels typically associated with strong economic optimism.

Analysts suggest the uptick is partly due to “tariff fatigue.” Consumers are adjusting to ongoing trade headlines, and recent easing of tensions with China and the delay of planned European Union tariffs helped ease anxiety. Still, concerns remain. Inflation expectations have dipped slightly but are still elevated, and many Americans remain cautious about job security and the cost of living.

This rebound in sentiment is welcome news after months of gloom. It’s a modest sign that consumers are regaining some confidence, even amid uncertainty. That’s good for the economy and for the markets, since consumer spending drives a substantial portion of US economic activity.

It also matters to the Fed. Stronger sentiment makes it easier for them to consider cutting rates later this year – especially if inflation continues to trend lower. But with overall confidence still below pre-election levels and economic risks still in play, the Fed is likely to move carefully.

American Market Volatility

Wall Street’s “fear gauge,” the CBOE Volatility Index (VIX), started the week on edge, opening at an elevated 21.15 after the previous weekend’s US bombing of Iranian nuclear facilities. That was a step up from last week’s close of 20.62 and reflected heightened geopolitical risk. But as tensions in the Middle East eased over the course of the week, investor anxiety followed suit. The VIX gradually moved lower, moving in the 16 to 18 range for most of the week. By Friday, it had settled at 16.32 – a clear sign that markets were breathing a little easier.

For those new to the VIX, it’s basically Wall Street’s stress meter. When investors grow uneasy about global events like the current hostilities in the Middle East, or economic concerns such as inflation, they tend to move away from riskier assets like tech stocks. That pullback can lead to sharper price swings, which is when the VIX tends to spike. Readings between 12 and 20 usually suggest markets are operating normally, but once it climbs above 20, it’s a signal that investors are bracing for rougher conditions. The higher it goes, the more turbulence the market is pricing in.


Weekly Market and Portfolio Review

For the week, the TSX (SPTSX) moved up 0.7%, the S&P 500 (SPX) gained 3.4%, the DJIA (INDU) jumped 3.8% and the Nasdaq (CCMP) surged 4.2%.

Index Weekly Streak
TSX: 1 – week winning streak
S&P: 1 – week winning streak
DJIA: 2 – week winning streak
Nasdaq: 2 – week winning streak

Bull market. A good week for the North American stock markets. It was a big week in the markets, with investors brushing off geopolitical risks and pushing indexes to fresh highs. Despite opening on shaky ground after the US bombing of Iranian nuclear facilities, markets quickly regained their footing. The S&P 500 (S&P) and the Nasdaq Composite Index (Nasdaq) closed at record highs, with the Nasdaq officially entering a bull market from its April 8 “Liberation Day” low. The Toronto Stock Exchange Composite Index (TSX) also joined the rally, logging multiple all-time high closes. The Dow Jones Industrial Average (DJIA) lagged behind but edged closer to its own record high.

Geopolitics took centre stage early in the week. After the US struck Iran, I expected markets to pull back – sharply. But once again, I proved to myself that trying to predict the market is a fool’s game. 😊 Iran’s retaliation was limited to missile strikes on a US base in Qatar, reportedly telegraphed in advance. President Trump even thanked Iran for the heads-up. Both the target and the warning were seen by investors as a signal that tensions were easing.

By Monday night, a ceasefire between Israel and Iran was in place and held through the week, bringing a rare moment of calm to the region. With fears of escalation fading, investor optimism returned, and heavyweight tech stocks led the charge.

Midweek, attention turned to the Fed as Chair Jerome Powell testified before Congress. Markets initially jumped when Powell said the Fed could act “sooner rather than later,” but those gains faded after he reiterated the need for more data, especially on tariffs and inflation, before making any decisions.

Before Powell’s testimony, two Trump-appointed Fed members came out in favour of a July rate cut, possibly angling for the top job to replace Powell. With President Trump openly calling for lower rates and suggesting he might name Powell’s successor early, the Fed now finds itself in a political squeeze. Meanwhile, other Fed governors have urged caution, arguing for more time and data. It’s shaping up to be a lively FOMC meeting in July. 😊

The economic data leaned dovish. Core PCE, the Fed’s preferred inflation gauge, ticked up to 2.7%—still above target, but not running away. First-quarter GDP shrank more than expected, and consumer spending cooled. Add in a surprise drop in consumer confidence, and the picture is of an economy that’s softening, not stalling.

Late in the week, tariffs grabbed back the spotlight. A breakthrough in US – China trade talks lifted tech stocks, especially artificial intelligence names like Nvidia (NASD: NVDA). Even Trump’s abrupt move to end trade talks with Canada over its new digital services tax didn’t rattle US markets. Investors seemed more focused on progress with China than friction with Canada.

In Canada, sentiment was more cautious. The TSX had benefited earlier from safe-haven demand, thanks to its gold and resource exposure, but that unwound as global tensions cooled. Still, the index closed at new highs. A slowing domestic economy and growing expectations for a BoC rate cut could shift investor focus toward more defensive sectors like utilities, consumer staples, and dividend payers.

One late-week wrinkle: President Trump said he was ending trade talks with Canada and He said he would set a new tariff rate on Canadian goods within the next week. Prime Minister Carney downplayed the tension, saying talks were ongoing, but the headlines rattled Canadian markets.

Overall, the ceasefire lit a fire under stocks – like a bull rider spurring the bull into action. 😊 The speed of the rebound is another reminder of why market timing is so tough. When uncertainty clears, markets tend to move fast.

Portfolio Weekly Streak
Portfolio 1: 2 – week winning streak
Portfolio 2: 2 – week winning streak
Portfolio 3: 2 – week winning streak

Bull market. A good week for the North American stock markets. They say a rising tide lifts all boats, and this week, all three of my portfolios rode the wave of market optimism. Each gained at least 1%, extending their win streaks to two weeks. 😊

Midweek, when Nvidia became the world’s most valuable company, I figured Portfolio 1 was in for a strong showing – barring another Liberation Day-style plunge. And it delivered. The portfolio surged 5.4% for the week, topping the other portfolios and all the major indexes. A big reason for the strong showing was that 79% of its holdings posted gains, including standout performances from indie Semiconductor (NASD: INDI) up 19%, Carnival Corp (NYSE: CCL) up 16%, Magnite (NASD: MGNI) up 15%, and Celestica (TSE: CLS) up 14%. Adding to the momentum were fresh all-time highs for Cameco (TSE: CCO), CrowdStrike (NASD: CRWD), Cloudflare (NYSE: NET), and Celestica.

Portfolio 2 trailed the others with a more modest 1.0% gain. Only 64% of its holdings finished in the green. Over the past few months, energy stocks helped this portfolio avoid the drops expereinced by the other two portfolios – but with markets heating up and energy names stumbling, they were more of a drag this week. One bright spot: Take-Two Interactive (NASD: TTWO), which hit a new all-time high.

Portfolio 3 also had a strong week, climbing 3.8% as 90% of its holdings finished in the green. Magnite led the way with a 15% gain, and Lithium Americas (TSE: LAC) bounced back with an 11% rise. A handful of others chipped in with steady gains, helping the portfolio quietly rack up another solid win.

It’s always nice when the market tailwinds are at your back – and this week delivered just that. With all three portfolios gaining ground and a solid mix of breakout performers and steady risers, it was a good week. Sure, the road ahead will have its bumps, especially with this President, but weeks like this are why I stay invested through the noise. Now let’s see if we can make it three in a row! 😊

Weekly Portfolio & Index performance
Weekly Portfolio & Index performance for the week ended June 27, 2025.

Companies on the Radar

Stocks on my Radar One new company made it onto my radar list this past week: the large-cap Danish pharmaceutical firm Novo Nordisk B A/S (CPH: NOVO-B), which trades on the Nasdaq Copenhagen Exchange (also known as OMX Copenhagen or CPH). Novo Nordisk is a global leader in diabetes and obesity care, thanks to its breakthrough treatments that continue to make headlines. You’ve probably heard of some of their products: Ozempic (for type 2 diabetes), Wegovy (for obesity), and Rybelsus (an oral version for diabetes). Ozempic and Wegovy, in particular, have pushed the company into the spotlight as demand for medical weight loss solutions continues to grow.

The question for me is whether the stock will keep sliding or start to rebound toward the highs it reached a year ago. Some due diligence is needed to figure out whether recent developments are signs of deeper issues or just a short-term stumble that presents an opportunity. 😊

If I do decide to invest, I’ll most likely go with the American Depositary Receipt (ADR), Novo Nordisk A/S (NYSE: NVO). It represents one ordinary share of NOVO-B, offering the same exposure to the company and its 2.19% dividend, but in a format that’s easier to buy and hold through a North American brokerage.

Novo Nordisk now joins the three companies listed below:

  • Aritzia (TSE: ATZ): a fashion retailer and design house known for its upscale in-house brands of women’s clothing and accessories. It controls everything from design to distribution and sells through more than 130 boutiques across North America, along with a fast-growing online platform. Its main markets are Canada and the US, where it continues to expand.
  • TerraVest Industries (TSE: TVK): an industrial manufacturer serving the energy, agriculture, and transportation sectors across North America. Its products include propane tanks, ammonia storage vessels used in farming, natural gas transport vehicles, and various energy processing systems. It’s a solid operator in essential industries.
  • Secure Energy Services (TSE: SES): an industrial company that focuses on environmental and waste management services for energy and industrial clients. It offers recycling, disposal, and infrastructure support across North America. For anyone interested in sustainability and infrastructure, this one’s worth keeping an eye on.

As always, these are not buy recommendations. Make sure to do your own research and choose investments that fit your personal financial goals.

The Radar Check was last updated June 27, 2025.

Stock on the Radar List. 1 of 2.
Stock on the Radar List. 2 of 2.


That’s a wrap for this week, thanks for reading may your portfolio stay green and your dividends steady. See you next time!


Weekly Update for the week ending June 20, 2025

When Giants Talk Trade, Canada Feels the Impact

Last week, I discussed the build-up to the China – US trade war and what each side is hoping to get from a deal. After tensions flared this spring, complete with sweeping tariffs and tech restrictions that rattled global markets, the two countries agreed to a temporary truce and resumed negotiations. There’s now a draft framework deal on the table, but it’s more of a ceasefire than a peace treaty. Still, even a partial deal could shift the global economic outlook – and that matters a lot to Canada.

A US – China trade deal would be good news for Canada – not because we’re directly involved, but because we’re deeply connected to both countries through trade, supply chains, and the broader global economy. When the world’s two largest economies stop fighting, everyone breathes a little easier.

First off, de-escalation means less global uncertainty. When tariffs fly, they disrupt everything from commodity prices to shipping routes. A more stable backdrop could boost demand for Canadian exports like oil, lumber, and minerals – all of which depend on global growth.

Second, Canadian companies that supply US manufacturers stand to benefit. If US firms can once again source materials from China more reliably, it smooths out the entire North American supply chain. That’s a win for Canadian producers of auto parts, tech components, and energy equipment.

Third, China is a major buyer of raw materials. When trade tensions slow its economy, demand for Canadian oil, potash, grain, and natural gas tends to drop. A deal that helps China’s economy rebound could send more of those Canadian exports out the door, providing a much-needed boost to the Canadian economy.

And finally, like I’ve said many times before, markets don’t like surprises. They love clarity. A trade agreement would ease market jitters, support investor confidence, and reduce volatility. That’s good news for Canadian investors, pension funds, and anyone with savings in RRSPs or TFSAs.

In short, Canada may not have a seat at the table, but we’re very much in the splash zone. A smoother relationship between the US and China could strengthen demand for Canadian exports, reduce supply chain friction, and give both global and domestic markets a lift. And when the global economy is growing, Canada usually rides the wave too. 😊

With all that in mind, it’s no surprise that investors have been keeping an eye on these negotiations. For us investors, understanding the ripple effects of major geopolitical developments, like a potential US –China trade deal or a Middle East ceasefire, is just part of staying in the loop. So, with geopolitics once again shaking things up, let’s take a look at how the markets reacted to the headlines and economic data this past week—and how my portfolios handled the ride.


Items that may only interest or educate me ….

Canadian economic news, US economic news

Canadian Economic News

This past week’s key economic data that the Bank of Canada (BoC) considers when deciding whether to raise or lower the interest rate.

BoC Meeting Minutes

The Bank of Canada’s minutes from its June 4 meeting revealed that members once again chose to hold the benchmark interest rate steady at 2.75%, pausing for a second consecutive time as they try to balance easing inflation with growing concerns about the broader economy. While headline inflation dipped to 1.7% in April, much of that drop was due to temporary factors like the suspension of the carbon tax. Under the surface, core inflation, which excludes more volatile items like energy, was still running at 2.3%, a sign that underlying price pressures remain.

One of the key concerns raised in the meeting was rising global trade tension, especially the new US tariffs of 50% on Canadian steel and aluminum. While the US imposed these tariffs, the impact is felt on both sides of the border. Higher import costs in the US tend to reduce demand for Canadian goods, which can weigh on Canadian exports and slow growth here at home. On top of that, trade disruptions like these often lead to supply chain uncertainty and rising input costs for Canadian businesses. That combination can feed into higher prices for consumers and add to inflation pressures even as the economy softens.

Canada’s economy expanded by 2.2% in the first quarter, but the Bank suspects much of that strength came from businesses rushing to stockpile inventory ahead of the tariffs. Beneath that headline figure, domestic demand was soft, and unemployment ticked up to 6.9%. Looking ahead, the Bank expects economic growth to cool significantly in the second quarter.

For now, the Bank is still in wait-and-see mode. A rate cut at the next meeting on July 30 is still on the table, but policymakers are in no rush. If inflation proves stubborn or global trade issues keep driving up costs, they may hold off. At this stage, they’re focused on keeping everything in balance, carefully watching how both inflation and growth unfold.

Retail Sales

Statistics Canada reported that retail sales rose 0.3% in April, falling short of the expected 0.5% gain and slowing from March’s 0.8% increase. On a year-over-year basis, total sales were up 5.0%, also down from March’s 5.6% pace. The biggest boost came from ‘New car dealers,’ with a 2.9% jump in April, while ‘Automotive parts, accessories, and tire retailers’ saw sales drop by 4.7%. Looking at year-over-year trends, ‘Used car dealers’ stood out with a 16.6% gain, while ‘other motor vehicle dealers’ posted the steepest drop, down 4.1%.

Core retail sales, which strip out vehicles, gas, and fuel, edged up just 0.1% in April, a slight dip from the 0.2% gain in March. Compared to a year ago, core sales were still up 3.7%, though that too was softer than March’s 5.5% increase. With both headline and core numbers losing steam from the month before, it’s a signal that consumer momentum may be cooling.

Looking ahead, the early estimate for May is more concerning: a sharp 1.1% drop. That likely reflects a pause after a spring spending spree, as consumers rushed to make purchases before possible tariff-related price hikes. Combined with signs of a softening labour market, this raises red flags about Canada’s economic momentum heading into the summer.

For us investors, the retail data adds weight to expectations that the BoC will need to cut rates again. Inflation continues to cool, and now retail spending is starting to show fatigue. That could open the door to lower borrowing costs in the months ahead. For the markets, this kind of backdrop puts more focus on interest-rate-sensitive sectors like housing and financials, while consumer discretionary stocks might feel the squeeze if spending keeps slowing.

Canadian Market Volatility

Canada’s market mood ring, the S&P/TSX 60 Volatility Index (VIXC), opened at 9.61 and stayed between 8.5 and 10 for most of the week, finishing at 9.86 – almost right where it started. Brief spikes above 10 were triggered by renewed concerns over Middle East tensions and the Fed’s decision to hold its benchmark rate steady.

If you’re new to the VIXC, it’s basically Canada’s version of a “fear gauge.” When it dips below 10, it usually means investors are feeling confident. A range between 10 and 20 signals a business-as-usual environment, while anything above 20 suggests market anxiety is starting to build.

US Economic News

This past week’s key data points that the Federal Reserve (Fed) considers when deciding whether to raise or lower the interest rate.

Fed Rate Decision

This past week, the Fed’s Federal Open Market Committee (FOMC) decided to hold interest rates steady at 4.75%, marking the fourth straight meeting without a change. That part was widely expected. What stood out was the Fed’s updated forecast – it now expects just two rate cuts later this year, down from the three cuts many analysts and markets had been hoping for heading into the meeting.

Although inflation has eased since last year, it’s still running above the Fed’s 2% target. Meanwhile, the job market is still strong, and newly announced US tariffs are adding more uncertainty to the economic outlook. Because of that, the Fed is taking a cautious approach and says it will wait for more data before deciding when, or even if, to start cutting rates.

For consumers, that likely means borrowing costs on mortgages, credit cards, and other loans will stay higher for a while longer. For us investors, the fact that rate cuts are still on the table is a sign the Fed is watching closely for any signs that the economy is losing steam. In short, the Fed is trying to walk a fine line – cool inflation without tripping up growth.

So while the pause wasn’t a surprise, the slightly more conservative rate cut outlook was a reminder that the path to lower rates won’t be quick, or guaranteed, even if political pressure, including from President Trump, continues to mount. In the meantime, markets will likely stay choppy as investors digest each new piece of economic data.

Retail Sales

According to the Commerce Department, retail sales fell by 0.9% in May. It was the second straight month sales dropped and the biggest monthly drop since January. That decline was larger than the expected 0.7% drop and suggests American consumers are finally easing up after a burst of spring spending. Some of that earlier strength came from people making big purchases, like cars, before potential tariffs took effect. Now that the rush is over, it’s no surprise that spending has cooled a bit.

A closer look at core retail sales, which exclude autos, auto parts, and gas stations, and are often seen as a better gauge of everyday consumer spending, shows a small dip of 0.1% in May, after a modest 0.1% gain in April. It’s not a dramatic pullback, but it does hint that shoppers are becoming a bit more cautious. Still, compared to this time last year, core sales are up 4.6%, which shows that underlying demand is holding up better than the monthly numbers might suggest.

Overall, the May retail sales report points to a slowdown, not a slump. Consumers are still opening their wallets, just not with the same enthusiasm as earlier in the year. For the Fed, it’s another mixed signal, growth may be softening even as inflation continues to cool, so any decisions around interest rate cuts could be delayed. For investors, that means markets may stay choppy as everyone tries to figure out what comes next.

American Market Volatility

Wall Street’s “fear gauge,” the CBOE Volatility Index (VIX), began the week at 19.78, a bit below last week’s close of 20.82. But it didn’t stay there for long. As hostilities in the Middle East escalated, investor nerves kicked in, pushing the VIX back above the 20 mark. It stayed mostly between 19.0 and 22.5 throughout the week, reflecting heightened uncertainty. By week’s end, it had settled at 20.62, a clear sign that anxiety was rising across the markets.

For those new to the VIX, it’s basically Wall Street’s stress meter. When investors grow uneasy about global events like the current hostilities in the Middle East, or economic concerns such as inflation, they tend to move away from riskier assets like tech stocks. That pullback can lead to sharper price swings, which is when the VIX tends to spike. Readings between 12 and 20 usually suggest markets are operating normally, but once it climbs above 20, it’s a signal that investors are bracing for rougher conditions. The higher it goes, the more turbulence the market is pricing in.


Weekly Market and Portfolio Review

For the week, the TSX (SPTSX) was essentially flat, although technically down 0.03% the S&P 500 (SPX) fell 0.2%, the DJIA (INDU) was also basically flat but technically gained 0.02% and the Nasdaq (CCMP) rose 0.2%.

Index Weekly Streak
TSX: 1 – week losing streak
S&P: 2 – week losing streak
DJIA: 1 – week winning streak
Nasdaq: 1 – week winning streak

Bull market. A good week for the North American stock markets.Bearish market The markets started the week on a strong footing, with all four major indexes – the Toronto Stock Exchange Composite Index (TSX), the S&P 500 Index (S&P), the Dow Jones Industrial Average (DJIA), and the Nasdaq Composite Index (Nasdaq) – climbing early on. But that rally quickly ran out of steam, as you can see in the weekly progress chart above. Renewed trade tensions, rising geopolitical risks, and fresh signals from the Fed weighed on investor sentiment, causing the momentum to fade. By week’s end, the DJIA and Nasdaq squeaked out modest gains, while the S&P and TSX slipped, snapping the TSX’s three-week winning streak.

Trade once again took centre stage. At the Group of 7 (Canada, the US, France, Japan, Germany, the United Kingdom (UK), and Italy) summit, the US signed a new deal with the UK and made some headway with Canada, with President Trump and Prime Minister Carney pledging to reach a broader trade and security agreement within 30 days. But progress with the European Union and Japan stalled, fuelling fears that the US might pivot to one-sided trade terms rather than negotiated deals – something that kept markets on edge.

Geopolitical tension added to the mix. Early in the week, hopes of a de-escalation between Israel and Iran helped lift markets. But those hopes faded fast. By midweek, investors were watching for any signs the US might get pulled into the conflict, a scenario that could send oil prices soaring and trigger broader market volatility. Fortunately, President Trump said he would wait another two weeks before making a decision. Crude oil has been climbing since the fighting began, and another jump in prices could further rattle markets.

On the economic front, American retail sales came in softer than expected, hinting that American consumers may be slowing down after a spring spending spree to beat tariff-related price hikes. Then came the Fed. As expected, rates were held steady at 4.75%, but Chair Jerome Powell made headlines by warning that inflation could tick higher this summer as tariffs begin to hit consumers. He even noted that if it weren’t for those added pressures, rate cuts might already be underway.

That comment likely didn’t sit well with Trump. Still, there was a silver lining: the Fed’s latest projections included two potential rate cuts before the end of the year, and Fed Governor Christopher Waller added that a cut could come as soon as their July 29 – 30 meeting. That gave rate-sensitive sectors and borrowers a sliver of hope.

Here in Canada, all eyes were on the G7 summit, where investors hoped Canada and the US might finally land a trade deal. While no agreement was reached, Carney’s warning that Canada could impose counter-tariffs if progress stalls within 30 days underscored just how high the stakes are. Meanwhile, rising oil prices, spurred by Middle East unrest, helped support energy stocks and gave the TSX a bit of a lift, even as broader uncertainty loomed.

All in all, early optimism gave way to familiar headwinds – trade, inflation, and geopolitics – reminding us that while markets may find pockets of strength, the road ahead is still anything but smooth. 😊

Portfolio Weekly Streak
Portfolio 1: 1 – week winning streak
Portfolio 2: 1 – week winning streak
Portfolio 3: 1 – week winning streak

Bull market. A good week for the North American stock markets. Given how markets mostly moved sideways this week, it was a pleasant surprise to see all three of my portfolios finish in the green. To make it even better, Portfolio 2, the laggard this past week, matched the weekly gain of the Nasdaq, this week’s top-performing index, as shown in the performance chart below.

Portfolio 1 got back in the win column, rising 1.8% thanks to 52% of its holdings posting gains. With just over half the companies moving up, it was especially helpful that one of those winners was Nvidia (NASD: NVDA), the portfolio’s largest holding at nearly 40% of its value. While there weren’t any major gains, both Cameco (TSE: CCO) and Formula One Group (NASD: FWONK) hit new all-time highs, helping the portfolio into positive territory.

Portfolio 2 posted the smallest gain of the three, inching up by 0.2%. Not exactly a blowout, but a gain is better than a loss. 😊 It was the only portfolio where fewer than half the holdings rose last week, with just 48% recording gains.

Portfolio 3 was the bright light, jumping 2.2% for the week, with 62% of its holdings in the green. The biggest driver was Alvopetro Energy (TSXV: ALV), which surged 11% and helped power the portfolio into top spot for the week.

Overall, a solid week across the board, even in a choppy market that mostly moved sideways. When the indexes tread water but the portfolios still push ahead, I’ll take that as a quiet win. With more economic data on the way and the conflict in the Middle East still unfolding, uncertainty isn’t going anywhere. For now, though, it’s nice to end the week in the green. 😊

Weekly Portfolio & Index performance
Weekly Portfolio & Index performance for the week ended June 20, 2025.

Companies on the Radar

Stocks on my Radar After a busy stretch the previous week, this one was much quieter on the investing front. No new companies made it onto my radar, so I’m still watching the same three names. All are Canadian, which avoids any foreign exchange impact, and they sit in that mid-cap space, offering growth potential without the early-stage volatility. 😊.

  • Aritzia (TSE: ATZ): a fashion retailer and design house known for its upscale in-house brands of women’s clothing and accessories. It controls everything from design to distribution and sells through more than 130 boutiques across North America, along with a fast-growing online platform. Its main markets are Canada and the US, where it continues to expand.
  • TerraVest Industries (TSE: TVK): an industrial manufacturer serving the energy, agriculture, and transportation sectors across North America. Its products include propane tanks, ammonia storage vessels used in farming, natural gas transport vehicles, and various energy processing systems. It’s a solid operator in essential industries.
  • Secure Energy Services (TSE: SES): an industrial company that focuses on environmental and waste management services for energy and industrial clients. It offers recycling, disposal, and infrastructure support across North America. For anyone interested in sustainability and infrastructure, this one’s worth keeping an eye on.

As always, these are not buy recommendations. Make sure to do your own research and choose investments that fit your personal financial goals.

The Radar Check was last updated June 20, 2025.

Stock on the Radar List. 1 of 2.
Stock on the Radar List. 2 of 2.


That’s a wrap for this week, thanks for reading may your portfolio stay green and your dividends steady. See you next time!

Weekly Update for the week ending June 13, 2025

Why You Should Care About US –China Trade Talks

Since April, tensions between the world’s two largest economies – China and the US – have escalated into a bruising trade war once again. But this isn’t new. The trade war between the two originally kicked off back in July 2018, after years of growing friction over trade imbalances, intellectual property, and market access. The first Trump administration imposed a 25% tariff on US$34 billion worth of Chinese goods, and China retaliated with tariffs on US exports like soybeans and autos. That tit-for-tat quickly spiralled into a full-scale economic standoff, with hundreds of billions in tariffs and tech restrictions shaking global supply chains. While there were brief truces and ongoing negotiations over the years, the rivalry never really cooled.

Fast forward to April 2025, and tensions ratcheted up fast. The US reignited the trade war with a wave of new “reciprocal” tariffs – including an effective rate of 54% on a wide range of Chinese imports. China hit back hard, launching tariffs as high as 125% and tightening export controls on rare earth minerals – the essential ingredients in everything from smartphones to fighter jets. The US quickly responded with tariffs that climbed to a staggering 145%. Markets were rattled, and fears of a full-blown trade war came roaring back. By May, both sides agreed to a 90-day tariff truce in Geneva to cool things off and restart talks – but the damage was already done. The April flare-up marked a turning point: the trade war was no longer simmering in the background – it was front and centre again.

Talks resumed in earnest this past week. At the heart of these negotiations is a shared goal: avoid another costly trade war while protecting national interests. The US wants guaranteed access to rare earths, which China dominates, and in exchange, it’s offering to ease some restrictions on advanced chips and AI-related tech. The US also wants greater market access for its companies – especially in energy, agriculture, and digital services – and more balanced trade rules. On the flip side, China is pushing for the US to roll back tech export controls that have crippled its semiconductor sector, and to lock in the Geneva tariff truce for longer-term stability.

Here’s the crux of it:

US Wants China Wants
Reliable rare earth supply Eased US chip export restrictions
Market access for US companies A stable, formalized tariff truce
Reciprocity on trade rules Space to protect strategic industries

Both sides recently announced a draft “framework deal”: China would ease rare earth export restrictions, and the US would reduce some of its tech restrictions. But it’s not a done deal – both leaders still need to sign off. Even if they do, this would be more of a ceasefire than a peace treaty. Big-picture tensions around China’s industrial policy and America’s tech leadership are still very much alive.

For us investors, this matters. Whether you’re looking at semiconductors, electric vehicles (EVs), or global logistics, the path of US – China relations can shape everything from supply chains to pricing power. Even the price of oil moves with trade tensions – a deal could boost global economic growth and, in turn, drive up demand for oil and energy products. It’s another reminder that geopolitics can move markets, and why keeping an eye on headlines isn’t just about politics – it’s about smart investing.

With all that geopolitical drama setting the stage, it’s no surprise that markets have been feeling the ripple effects. Let’s take a look at some recent economic data, how the major indexes performed, and how my portfolios are navigating the ups and downs.


Items that may only interest or educate me ….

Canadian economic news, US economic news, .…

Canadian Economic News

This past week’s key economic data that the Bank of Canada (BoC) considers when deciding whether to raise or lower the interest rate.

Canadian market volatility

Canada’s market mood ring – the S&P/TSX 60 Volatility Index (VIXC) – kicked off the week at 10.33 and barely moved, drifting between 9.8 and 11.4 before dropping sharply to 9.61 late Friday. That’s a clear sign investors were feeling pretty relaxed. Solid jobs data from both Canada and the US, and growing optimism about a potential Canada–US trade deal – possibly as soon as next week – helped keep the mood steady and the volatility low.

If you’re new to the VIXC, think of it as Canada’s version of a “fear gauge.” When it’s below 10, it usually means investors are feeling confident. A range of 10 to 20 signals a steady, business-as-usual environment, while readings above 20 suggest anxiety is creeping in.

US Economic News

This past week’s key data points that the Federal Reserve (Fed) considers when deciding whether to raise or lower the interest rate.

Consumer price Index (CPI)

US inflation cooled more than expected in May, giving investors, and the Fed, some welcome breathing room. The CPI rose just 0.1% on the month, down from April’s 0.3%, and below what analysts were expecting. Although that 0.1% is technically a slight increase from the previous month’s base level, it actually points to slowing inflation, as the month-over-month jump is smaller than in earlier reports. On a year-over-year basis, inflation came in at 2.4% – a touch higher than April’s 2.3%, but still better than the forecasted 2.5%.

Digging into the details, fuel oil – also known as heating oil – saw the biggest monthly jump, climbing 0.9%. On the flip side, gasoline prices dropped 2.6%, offering some relief at the pump. Over the past year, utility (piped) gas service – natural gas delivered directly to homes – has surged 15.3%, while gasoline prices are down 12.0%.

Shelter costs, which include rent, mortgages, and homeowner expenses, continued to be one of the biggest contributors to overall inflation. They rose 0.3% in May and are up 3.9% year over year – the smallest increase since November 2021, but still stubbornly high.

Core inflation, which strips out food and energy, also rose just 0.1% on the month – below expectations – and held steady at 2.8% annually, slightly under the 2.9% forecast.

For the Fed, this report is an encouraging sign. Inflation isn’t flaring up again, which opens the door a little wider for a rate cut later this year – potentially as early as September. That said, Fed members will probably stay cautious, especially with trade tensions and tariffs looming in the background. But for now, inflation is easing without dragging down the broader economy, and that’s welcome news for markets, businesses, and consumers alike. 😊

Consumer Sentiment Index (CSI)

Consumer confidence got a lift in June. The University of Michigan’s preliminary CSI came in at 60.5, marking the first increase in six months and beating expectations of 53.5. That’s a 15.9% jump from May’s 52.2 – but still 11.3% below where it was a year ago and about 18% lower than in December 2024, when sentiment spiked following the election of President Trump.

The Current Conditions Index, which reflects how people feel about their personal finances right now, rose to 63.7 from 58.9 – a healthy monthly bump, but still down from last year. And the Expectations Index, which looks ahead six months, saw an even bigger rebound – climbing nearly 22% to 58.4. That said, both measures are still well below pre-pandemic norms, showing that while confidence is improving, consumers are still cautious.

Analysts pointed to April’s tariff shock as a major reason for the earlier drop in sentiment, and June’s bounce suggests that anxiety is starting to ease. Even so, the index is far from signaling all-clear – with uncertainty around inflation, trade policy, and global tensions still lingering.

For us investors, this kind of shift matters. When consumers feel better, they’re more likely to spend, which fuels growth in sectors like retail, housing, and travel. But with confidence still on the low side, we should be watching closely – especially if we’re investing in companies that rely on strong consumer demand.

American market volatility

Wall Street’s “fear gauge” – the CBOE Volatility Index (VIX) – started the week at 17.69 and held within a relatively tight range, fluctuating between 16.25 and 18.90. But at week’s end, it spiked to 20.82 after Iran retaliated against an earlier Israeli air strike, shaking investor confidence. Up until that point, markets had stayed fairly calm, supported by strong labour and inflation data and renewed US–China trade talks. The sudden jump in the VIX was a reminder that geopolitical flare-ups can quickly overshadow economic fundamentals – and that investor sentiment can shift in an instant.

For anyone new to the VIX: it’s basically Wall Street’s stress meter. When investors start getting uneasy, they often pull back from riskier bets like technology stocks, which can lead to sharper swings in prices. That’s when the VIX tends to spike – capturing the rise in market volatility and fear. Readings between 12 and 20 mean things are fairly normal, but when it climbs above 20, it usually signals that investors are bracing for choppier waters ahead. The higher it goes, the more turbulence the market is pricing in.


Weekly Market and Portfolio Review

For the week, the TSX (SPTSX) advanced 0.3%, the S&P 500 (SPX) lost 0.4%, the DJIA (INDU) fell 1.3% and the Nasdaq (CCMP) declined 0.6%.

 
Index Weekly Streak
TSX: 3 – week winning streak
S&P: 1 – week losing streak
DJIA: 1 – week losing streak
Nasdaq: 1 – week losing streak

Bearish market As of Thursday, all four major indexes – the Toronto Stock Exchange Composite Index (TSX), the S&P 500 Index (S&P), the Dow Jones Industrial Average (DJIA), and the Nasdaq Composite Index (Nasdaq) – were on track for weekly gains, lifted by strong earnings, easing inflation, and optimism around trade. The S&P even climbed back above 6,000 for the first time since February 2024, and the TSX, S&P, and Nasdaq all hit record closing highs during the week.

But Thursday night brought a jolt: Israel launched a pre-emptive airstrike on Iran to halt its nuclear weapons program. The escalation rattled global markets. Oil prices surged as much as 7%, and investor sentiment quickly turned. By Friday, US indexes had flipped into the red, the S&P was back under 6,000, and the market’s tone had clearly shifted.

Before that, markets were calm. Volatility was low, and investors seemed to grow more comfortable with Trump’s shifting tariff threats. Midweek, optimism got a boost when the US and China agreed on a framework to restart trade talks. As part of the deal, China would ease restrictions on rare earth exports – crucial for everything from smartphones to EVs – and the US would ease limits on Chinese student visas. Tariffs would stay for now, with the US holding at 55% and China at 10%, but investors took this as progress.

Trump also warned that countries not striking a deal by the end of the 90-day pause on July 8 would face new tariffs. But Treasury Secretary Scott Bessent offered reassurance, saying extensions were “highly likely” for those negotiating in good faith. Separately, Trump floated the idea of hiking auto tariffs (already at 25%) to spur more US production – despite automakers pushing for cuts, not hikes.

On the economic front, May’s US inflation data gave investors more to optimism for a rate cut. Headline CPI rose just 0.1%, and core inflation came in below forecasts – a sign that inflation is slowing without stalling growth. Markets are now betting on one or even two Fed rate cuts this year, possibly starting in September. Trump also weighed in, calling for a “jumbo” 0.5% cut, though analysts expect the Fed to stay cautious. Consumer sentiment even ticked up for the first time in six months, rounding out a solid backdrop.

In Canada, the TSX hit record highs on Wednesday and Thursday, helped by rising oil and gold prices and optimism that a Canada–US trade deal could be announced at next week’s G7. A potential trade-off I’d like to see: Canada drops its digital services tax in exchange for the US dropping Section 899 of Trump’s ‘big, beautiful’ tax cut and spending bill, which penalizes foreign investors (like us Canadians).

The TSX dipped Friday as Middle East tensions escalated, but surging oil and gold prices cushioned the blow, helping the index post a third straight weekly gain. Oil jumped on fears of supply disruption through the Strait of Hormuz (off the south coast of Iran) – a chokepoint for nearly 20% of global oil exports. Gold rose as investors sought safety. It’s long been viewed as a safe haven because it tends to hold – or even gain – value during times of uncertainty, exactly what we saw as the week wrapped up.

Portfolio Weekly Streak
Portfolio 1: 1 – week losing streak
Portfolio 2: 1 – week losing streak
Portfolio 3: 1 – week losing streak

Bearish market Much like the major indexes, all three of my portfolios were on track for a third straight weekly gain – until Israel’s pre-emptive strike on Iran and Iran’s retaliatory missile attack rattled global markets. By Friday, all three had slipped into the red as geopolitical tensions shook investor confidence.

Portfolio 1 ended the week down 1.4%. It was actually in the green heading into Friday, but the broad market selloff pulled it lower. Only 35% of holdings finished higher on the week, so in that context, a 1.4% dip doesn’t feel too bad. Fortunately, a solid 10% surge from International Petroleum Corp (TSE: IPCO) riding the wave of surging oil prices and another strong week from Cameco (TSE: CCO), which hit a new all-time high, cushioned the fall.

Portfolio 2 held up the best — or put another way, it lost the least — dipping just 0.3% for the week. A solid 55% of its holdings finished higher, including fresh record highs from Dollarama (TSE: DOL) and Microsoft (NASD: MSFT). Energy stocks also played defence, benefiting from the oil price surge and helping show, once again, the value of diversification when markets take a hit.

Portfolio 3 took the biggest hit this week, falling 2.5%. With just 23% of its holdings moving higher, there wasn’t much to lean on. Its two energy companies — Alvopetro Energy (TSEV: ALV) and Brookfield Renewable Partners LP (TSE: BEP.UN) — did their part to cushion the drop, but it wasn’t nearly enough to counter the broader pullback.

Despite the pullback at week’s end, the broader trend is still upward. Friday’s events were a sharp reminder that geopolitics can rattle markets in an instant – but volatility isn’t always a setback; sometimes, it’s a setup for opportunity. With solid earnings, cooling inflation, and renewed trade talks in the mix, there’s still plenty of reason to feel optimistic heading into next week.

Weekly Portfolio & Index performance
Weekly Portfolio & Index performance for the week ended June 13, 2025.

Companies on the Radar

Stocks on my Radar There was a fair bit of activity on my radar list this past week as I made a few adjustments to sharpen my focus. I trimmed Unity Bancorp (NASD: UNTY) and Amphenol Corporation (NYSE: APH). With Unity, I figured if I wanted more exposure to banks, I’d likely stick with a Canadian one – something I’m more familiar with, and it would also save me from any foreign exchange headaches. As for Amphenol, it’s a solid company, but I see better opportunities elsewhere right now.

One new name made its way onto the list: Aritzia (TSE: ATZ). Aritzia is a Canadian mid-cap fashion retailer and design house, known for its in-house brands of upscale women’s clothing and accessories. The company runs a vertically integrated model – meaning it controls everything from design to distribution – and sells through more than 130 boutiques across North America, along with a fast-growing ecommerce platform. Its biggest markets are Canada and the US, where it continues to expand its footprint both online and in stores.

With these moves, plus the two companies I held over from the previous week, my radar list is now down to a tight three names – giving me a more focused set of ideas to keep an eye on.

  • TerraVest Industries (TSE: TVK): a Canadian mid-cap industrial company that manufactures equipment for the energy, agriculture, and transportation sectors across North America. Its product lineup includes propane tanks, specialized tanks used to store and transport ammonia gas commonly used as fertilizer (anhydrous ammonia vessels), natural gas liquids transport vehicles, and a range of energy processing equipment.
  • Secure Energy Services (TSE: SES): a Canadian mid-cap industrial company focused on waste management and energy infrastructure. They serve clients across North America with recycling, disposal, and environmental solutions – a solid pick in the sustainability and infrastructure space.

As always, these are not buy recommendations. Make sure to do your own research and choose investments that fit your personal financial goals.

The Radar Check was last updated June 13, 2025.

Stock on the Radar List. 1 of 2.

Stock on the Radar List. 2 of 2.


That’s a wrap for this week, thanks for reading may your portfolio stay green and your dividends steady. See you next time!