Thinking of Buying Foreign Stocks? Here’s How Canadians Can Do It
Last week I talked about Berkshire Hathaway’s (NYSE: BRK.B) investment in five big Japanese trading companies. Doing deep due diligence on them turned out to be too complicated for me – but that doesn’t mean you can’t explore investing in them yourself.
If you’re thinking about picking up shares of one of the Japanese companies Buffett invested in – nice! 😊 But you’ll quickly notice something odd: they’re listed on the Tokyo Stock Exchange (TSE), and also on something called the OTC Markets (OTCM) in the US. (For this section, TSE refers to the Tokyo Stock Exchange – not Toronto.)
So, what’s the difference? And what makes the most sense for investors like us in Canada (or the US)?
Let’s walk through the pros and cons of buying shares directly from a company’s home stock exchange vs. buying through the OTCM. I’ll use these Japanese firms as examples, but the setup is similar for many foreign companies also listed on the OTC Markets.
Option 1: Tokyo Stock Exchange (TSE)
This is where the actual, original shares are traded – in Japanese yen.
Pros:
- You’re getting the actual shares.
- Often better liquidity and tighter pricing.
- Full shareholder rights (voting, etc.).
Cons:
- Not all brokers let you trade on foreign exchanges.
- You’ll need to convert your CAD or USD to yen.
- Tokyo market hours are overnight for us in North America.
Unless you already have international trading access set up, this route can be a bit of a hassle. If you’re planning to go this way, you’ll need a broker that supports foreign exchange access. A lot of investors I follow use and recommend Interactive Brokers (NASD: IBKR). I recently became a (very small) shareholder myself 😊, and when I eventually buy a foreign-listed company, I plan to do it through IBKR.
Option 2: OTC Markets (OTCM)
This is where you’ll find ADRs – American Depositary Receipts – which are basically certificates that represent shares of foreign companies. They trade in US dollars and are available through most Canadian and US brokerages.
Think of them as a convenient way for North American investors to own international stocks without dealing with foreign exchanges or currencies. (For more info, check out my write up on ADRs.
For example:
Pros:
- Easy to buy in registered accounts like RRSPs, TFSAs, or regular unregistered brokerage accounts.
- No need to convert currency – they trade in USD.
- Regular North American trading hours.
Cons:
- Sometimes lower trading volume.
- Slightly wider price spreads than on the Tokyo Exchange.
- These aren’t the “real” shares, just economic equivalents (but for most of us, that’s totally fine).
So, what’s the best option?
For most Canadian investors, and probably American investors, buying the OTC shares is the way to go. They’re simple to access, no currency conversion is needed, and they’re available through most online brokers like TD Direct Investing, Wealthsimple, or Questrade.
However, many serious retail investors prefer direct access to foreign exchanges like the Tokyo Stock Exchange – and use a platform like Interactive Brokers to do so. If you already use IBKR, you probably know about its global reach and low fees. But if you’re considering it, IBKR lets you buy the actual shares instead of ADRs – often with better pricing and lower currency conversion costs compared to big bank brokerages. Plus, it offers access to dozens of international markets, making it a great option if you’re planning to invest in foreign-listed companies more regularly.
With that foreign investing detour complete, 😊 let’s take a look at this past week’s market action and what moved the markets, and how it affected the portfolios.
Items that may only interest or educate me ….
The Bromance Is Over, Triple whammy, Canadian Economic news, US Economic news, ….
The Bromance Is Over
It was only a matter of time. The once-curious bromance between President Trump and his so-called “First Buddy” Elon Musk has spectacularly imploded, ending in a very public and very messy feud. Here’s a quick look at how it all went down.
A New Alliance
Though initially wary of Trump in 2016, Musk joined his economic advisory councils – only to walk away in 2017 after the US ditched the Paris climate agreement. But by the 2024 campaign, the two had reunited. Musk donated over US$200 million and became a key advisor after Trump’s re-election, landing a figurehead role as head of the Department of Government Efficiency (DOGE).
Trump Strikes Back
In 2025, cracks formed when Musk blasted Trump’s flagship spending bill – the so-called “Big Beautiful Bill” – as a “disgusting abomination,” distancing himself from its creation. Trump hit back with threats to cancel federal contracts with Tesla (NASD: TSLA) and SpaceX. Musk countered by threatening to decommission SpaceX’s Dragon spacecraft, jeopardizing NASA operations.
Things got uglier when Musk publicly accused Trump of showing up in Jeffrey Epstein’s files and called for his impeachment. Tesla shares tanked, wiping out $150 billion in value, and regulators began circling.
The Fallout Awakens
This once-unlikely alliance has now gone supernova. Musk is floating the idea of launching a new centrist political party and says he’ll scale back his political donations across the board. The clash has cast a shadow over US space ambitions and strained major public-private partnerships.
In the end, it’s a dramatic reminder of how quickly power alliances can shift – especially when billionaires and presidents mix politics with personal ego.
Triple Whammy
Once again, President Trump rattled his tariff sabre heading into the weekend. After markets had closed on May 30, he announced plans to double tariffs on imported steel and aluminum to 50%, effective June 4.
A move like that would send shockwaves through supply chains and pricing. With around 23% of steel used in the US coming from abroad, the impact would likely be felt across a wide range of goods – from cars and appliances to construction materials and heavy machinery. Higher input costs could squeeze manufacturers and ultimately hit consumers in the form of higher prices, adding more fuel to the inflation fire.
For foreign steel producers, the tariff hike would act like a wall – making their products far more expensive and less competitive in the US market. That could lead to lost sales, reduced production, and even layoffs in key exporting countries.
Canada, in particular, would feel the pinch. As the largest single supplier of steel to the US, Canada accounted for about 23% of total US steel imports in 2024. And with nearly 90% of Canadian steel exports heading south of the border, this trade link is critical for Canadian steelmakers.
So, while the goal of higher tariffs may be to boost domestic steel production, the ripple effects could be far-reaching. US manufacturers would face steeper costs, consumers would likely pay more, and key trading partners like Canada could take a major hit. A triple whammy: rising costs for American producers, pricier goods for American consumers, and economic pain for Canada.
Canadian Economic News
This past week’s key economic data that the Bank of Canada (BoC) considers when deciding whether to raise or lower the interest rate.
Bank of Canada interest rate decision
This week, the BoC held its key interest rate steady at 2.75%, keeping it unchanged for the second meeting in a row. Earlier this year, the Bank had made two quarter-point cuts (in January and March) to support the economy, but it’s now taking a more cautious approach as economic uncertainty grows.
The decision to pause further cuts comes as core inflation shows signs of picking back up, and trade tensions – especially with the US – create added risk. Governor Tiff Macklem highlighted that the outlook is still uncertain, with tariffs and shifting global trade patterns weighing on the Bank’s thinking.
While there are signs that the Canadian economy is feeling some strain – like slower job growth and weaker consumer spending – the Bank’s main focus remains on keeping inflation under control. More rate cuts later this year are still on the table, but only if inflation cools and the economy stays on track. For now, the message is one of patience and caution.
Labour Force Survey
Canada’s job market showed only a modest rebound in May, offering little relief for an economy feeling the strain of rising trade tensions. Statistics Canada’s latest Labour Force Survey (LFS) reported 8,800 new jobs last month – essentially flat, after an equally small gain of 7,400 in April. That leaves year-over-year job growth at just 1.4%.
Meanwhile, the unemployment rate inched up for the third straight month, reaching 7% – its highest level since September 2016 (setting aside the COVID-era spikes of 2020 and 2021). The steady climb reflects not just the impact of US tariffs and trade uncertainty on Canada’s export-driven economy, but also the effect of a growing population. More people are entering the labour force, but the pace of job creation isn’t keeping up.
Wage growth, meanwhile, is going nowhere fast. Average hourly earnings crept up just a penny to $36.14, keeping the annual growth rate at 3.4%.
This latest data suggests Canada’s labour market is holding up – but only just. With trade headwinds and softening demand hitting key industries like manufacturing, that rising unemployment rate is something us investors will want to keep an eye on. If job growth keeps stalling, it could start to weigh on consumer spending and the broader economy – and that’s something the BoC will be watching closely as it decides whether to cut, hold, or raise interest rates in the months ahead.
Canadian market volatility
Canada’s market mood ring – the S&P/TSX 60 Volatility Index (VIXC) – started the week at 10.72 and hovered mostly in the 10.00 to 10.50 range, helped by strength in oil and uranium prices boosting the TSX. Volatility briefly ticked higher, climbing above 11 late in the week after Canada’s trade deficit hit a record high due to new US tariffs on Canadian goods. (The US is Canada’s largest export market.) But investors remained calm, and the VIXC eased back down to 10.42 by Friday’s close.
For those unfamiliar with the VIXC, it’s essentially Canada’s version of a fear gauge. Readings under 10 show strong investor confidence, 10–20 is business as usual, and anything above 20 suggests investors are getting uneasy.
US Economic News
This past week’s key data points that the Federal Reserve (Fed) considers when deciding whether to raise or lower the interest rate.
Labour data
The latest updates from the Job Openings and Labor Turnover Survey (JOLTS), the ADP Employment Report, and the Employment Situation Summary (ESS) offer a snapshot of the US labour market –showing resilience, but with some stress cracks starting to appear.
JOLTS
The latest JOLTS report showed job openings rising to 7.4 million in April – up from 7.2 million in March and well above expectations. Even with all the economic uncertainty, employers are still hiring.
Professional and business services, along with healthcare, led the way. But more tariff-sensitive industries like manufacturing and construction saw a bit of a pullback. So, while the labour market is gradually cooling, it’s not breaking.
That’s good news for the Fed. The economy is slowing just enough to keep inflation in check, but not so much that the Fed needs to slam the brakes harder. For us investors, it helps keep the door open for possible rate cuts later this year – without stoking fresh inflation fears.
ADP
The ADP report for May showed US private-sector employers adding just 37,000 jobs – well below expectations and the weakest gain since March 2023. It’s not a full-on slump, but businesses clearly are growing more cautious.
Tariffs and high interest rates are likely slowing hiring, especially in sectors like manufacturing and construction. Companies aren’t laying people off en masse – but they’re definitely putting expansion plans on hold.
ESS
In May, the American economy added 139,000 jobs – slightly better than expected, but a slowdown from April’s 147,000. The unemployment rate held steady at 4.2% for the third straight month, still near historic lows.
Wages edged up again – with average hourly earnings rising 3.9% year-over-year, a touch higher than expected. So, while the labour market is cooling, inflation pressures haven’t fully gone away.
What this means for us investors
The US job market is holding up – but the cracks are starting to show. The ESS report showed steady job gains, but the ADP data pointed to a big slowdown in private hiring. Fewer people are looking for work, and workers seem less confident about switching jobs – both signs that the labour market is cooling.
For us investors, this matters. A weaker job market could weigh on consumer spending, which powers the US economy. But with wages still rising and unemployment low, the Fed may not be in a rush to cut rates just yet.
In short, the job market isn’t falling apart – but it is flashing some warning lights.
American market volatility
Wall Street’s “fear gauge,” the CBOE Volatility Index (VIX), kicked off the trading week near the top of its usual 12–20 range at 19.81. Early in the week, it briefly spiked to 20.45 after tensions flared between the US and China, with both sides accusing each other of violating terms of the trade war truce. Despite the headlines, markets quickly shook off the jitters. The VIX slid back below 20 and drifted lower as the week progressed, hitting a low of 16.58 before ticking back up slightly to close at 16.77. That’s the lowest the VIX has been since this past February.
The move suggests that while trade concerns raised the anxiety level, investors overall remained relatively calm – especially with US economic data pointing to softening inflation and a slightly cooling labour market, which could keep the Fed on track for potential rate cuts later this year.
For anyone new to the VIX: it’s basically Wall Street’s stress meter. When investors grow uneasy, they tend to pull back from riskier assets, such as technology stocks, which can lead to sharper price swings and more unpredictable markets. That’s when the VIX tends to rise – capturing the surge in volatility and fear. A reading between 12 and 20 signals business as usual, while anything above 20 suggests growing anxiety. The higher it climbs, the more turbulence investors are expecting.
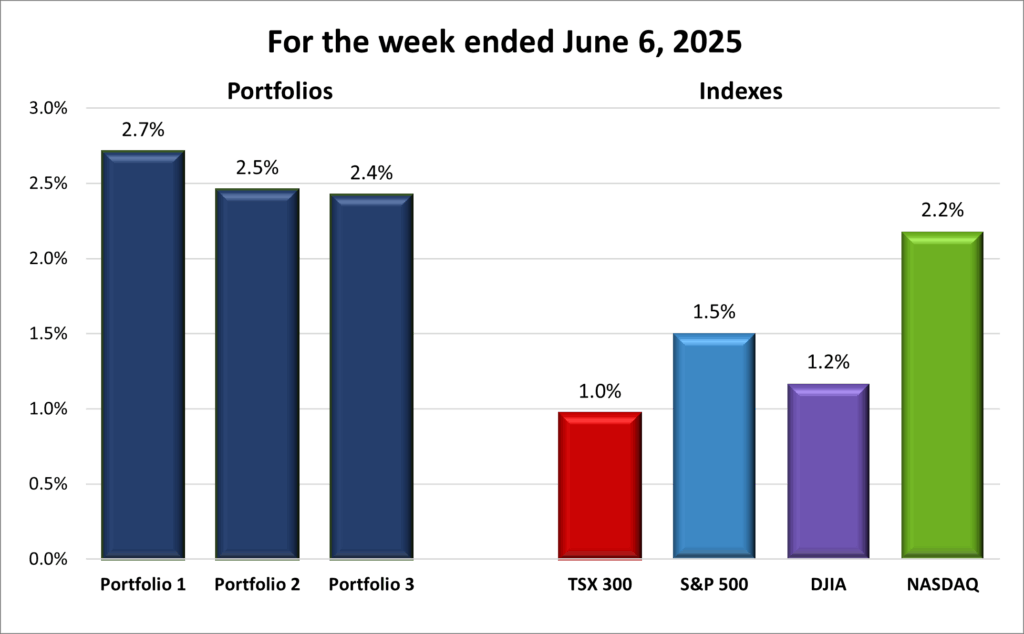
Weekly Market and Portfolio Review
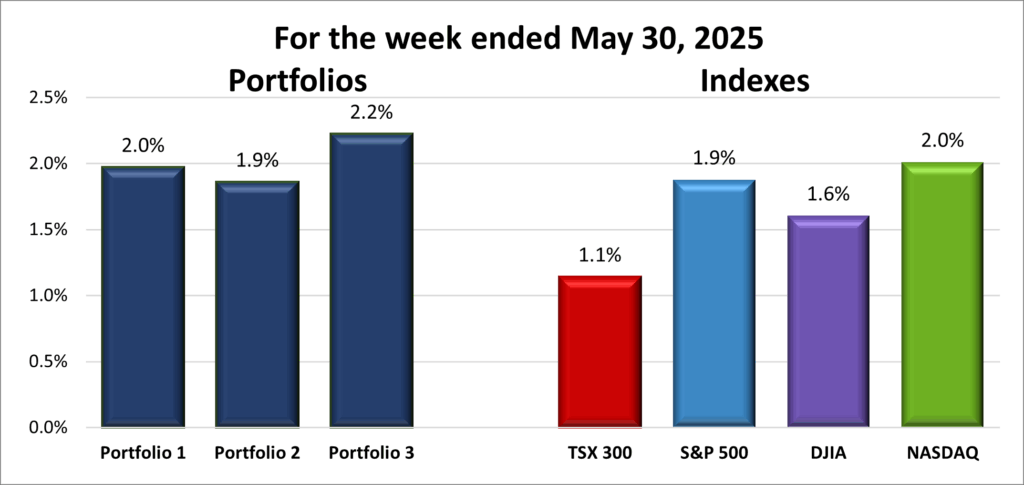
For the week, the TSX (SPTSX) grew 1.0%, the S&P 500 (SPX) rose 1.5%, the DJIA (INDU) added 1.2% and the Nasdaq (CCMP) advanced 2.2%.
| Index | Weekly Streak |
| TSX: | 2 – week winning streak |
| S&P: | 2 – week winning streak |
| DJIA: | 2 – week winning streak |
| Nasdaq: | 2 – week winning streak |
![]() Another solid week in the markets – but not without bumps along the way. While gains weren’t as strong as the previous week, the major North American indexes – the Toronto Stock Exchange Composite Index (TSX), the S&P 500 (S&P), the Dow Jones Industrial Average (DJIA), and the Nasdaq Composite (Nasdaq) – all posted a second straight week of gains. The Nasdaq clawed back into positive territory year-to-date for the first time since February, powered by gains in the Magnificent 7 companies. Nvidia had a standout week, overtaking Microsoft as the world’s most valuable company at US$3.45 trillion. Tesla tumbled 14% after CEO Elon Musk’s public feud with President Trump (see earlier in this post), only to recover some of the loss as ‘buy the dip’ investors swooped in to seize the opportunity.
Another solid week in the markets – but not without bumps along the way. While gains weren’t as strong as the previous week, the major North American indexes – the Toronto Stock Exchange Composite Index (TSX), the S&P 500 (S&P), the Dow Jones Industrial Average (DJIA), and the Nasdaq Composite (Nasdaq) – all posted a second straight week of gains. The Nasdaq clawed back into positive territory year-to-date for the first time since February, powered by gains in the Magnificent 7 companies. Nvidia had a standout week, overtaking Microsoft as the world’s most valuable company at US$3.45 trillion. Tesla tumbled 14% after CEO Elon Musk’s public feud with President Trump (see earlier in this post), only to recover some of the loss as ‘buy the dip’ investors swooped in to seize the opportunity.
After two positive weeks, the VIX dropped to its lowest level since February 2025, signaling reduced investor anxiety and improved market sentiment – helped by Friday’s solid US jobs report. A lower VIX often sets the stage for stronger equities, and that was on display late in the week as the S&P cracked 6,000 – its highest since February 2025.
Trade tensions once again stole the spotlight. The week opened with President Trump announcing that tariffs on all foreign steel and aluminum imports would double to 50% starting June 4. The US then accused China of violating the trade truce by “slow walking” rare earth mineral exports – a move seen as a threat to critical US industries. China fired back, accusing the US of breaking the truce by restricting sales of AI chips and advanced chip design software. The tit-for-tat accusations rattled investors and raised fears of a deeper trade conflict. After a direct call between the two leaders, Trump claimed the conversation “resulted in a positive conclusion for both countries.” By week’s end, Trump announced the US would begin high-level trade talks with China in London – giving investors a glimmer of hope.
On the economic front, US jobless claims rose to an eight-month high and hiring slowed, but the number of new jobs still came in better than expected. The weakness, partly driven by tariff-related uncertainty, is starting to weigh on the economy. However, the better-than-expected jobs data gives the Fed room to stay patient on rate cuts.
Meanwhile, the Organization for Economic Co-operation and Development (OECD) warned of a significant global slowdown, citing the surge in protectionism and its ripple effects on inflation and supply chains.
In Canada, the BoC held rates at 2.75%, citing uncertainty from new US tariffs. Ottawa is holding off on retaliating for now, but the impact is clear – Canada’s trade deficit jumped to a record C$7.1 billion in April as US demand for Canadian goods plunged. Even so, the TSX hit back-to-back record highs early in the week and closed the week with a new record high, boosted by strong energy (oil) and basic materials (gold and other metals) stocks.
Oil had its own rollercoaster. Prices spiked early on due to Alberta wildfires and a smaller-than-expected OPEC+ production boost, then dipped midweek on rising US gasoline and diesel inventories, before rebounding again as tensions with Iran raised fears of supply disruptions. The swings pushed energy stocks around but didn’t derail the broader market – just added more noise to an already eventful week.
After a second straight week of gains for the broader markets, it’s time to check in on how my three portfolios performed – and this week, there was plenty to smile about.
| Portfolio | Weekly Streak |
| Portfolio 1: | 2 – week winning streak |
| Portfolio 2: | 2 – week winning streak |
| Portfolio 3: | 2 – week winning streak |
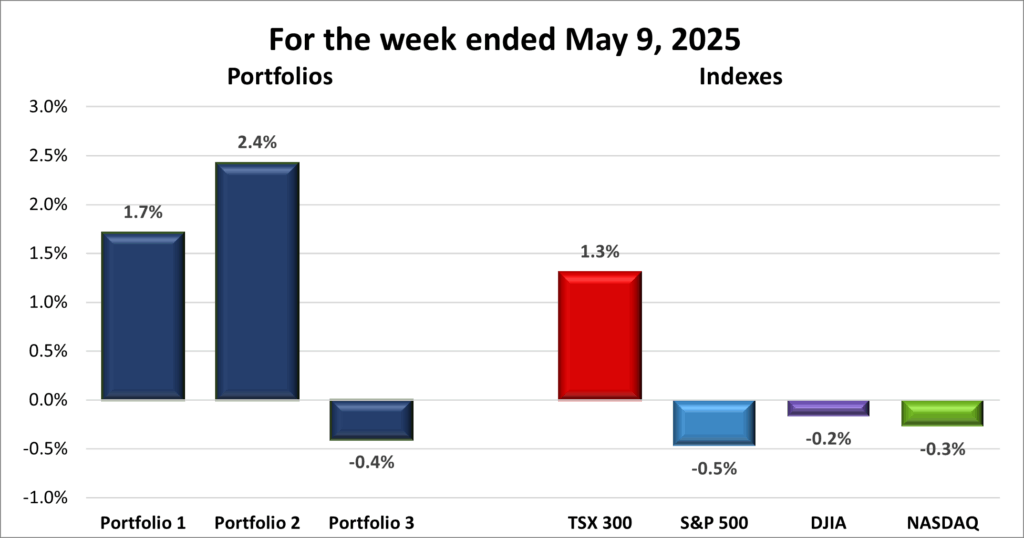
![]() The three portfolios rode the tailwinds of another good week in the markets, with all ending higher than the Nasdaq, the best performing index, as you can see in the chart below. But it wasn’t until Friday that Portfolio 3 finally joined the other two in positive territory – better late than never. 😊
The three portfolios rode the tailwinds of another good week in the markets, with all ending higher than the Nasdaq, the best performing index, as you can see in the chart below. But it wasn’t until Friday that Portfolio 3 finally joined the other two in positive territory – better late than never. 😊
Portfolio 1 was the top performer this week, powered by the resurgence of the Magnificent 7 stocks in the broader market. The portfolio gained 2.7% on the week, with 77% of its holdings in the green. Leading the charge were Kraken Robotics (TSE: PNG), up 20%, Navitas Semiconductor (NASD: NVTS), up 17%, and Hammond Power Solutions (TSE: HPS.A), up 11%. CrowdStrike (NASD: CRWD) hit an all-time high during the week before pulling back after providing a softer-than-expected second quarter outlook, as it continues to manage the fallout from last summer’s software upgrade that caused a global network outage.
Portfolio 2 with its more conservative profile surprised with a 2.5% gain – second best among the three portfolios, just a hair ahead of Portfolio 3. This time, 81% of its holdings posted weekly gains. Standouts included MongoDB (NASD: MDB), up 16%, Guardant Health (NASD: GH), up 15%, and Hammond Power Solutions, again up 11%.
Portfolio 3 spent most of the week in the red but staged a strong comeback on Friday, finishing up 2.4%. Overall, 71% of its holdings ended the week higher, though this portfolio didn’t feature any big individual winners this time around.
I’ll gladly take another week of green across the board. With markets showing some upward momentum again, here’s hoping those gains continue and help me keep building my wealth through investing. 😊
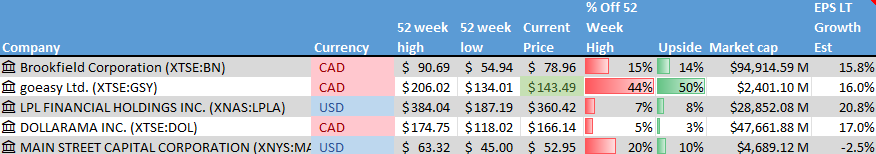
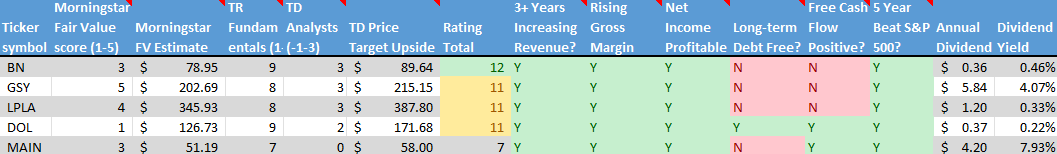
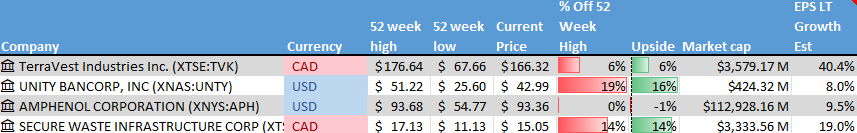
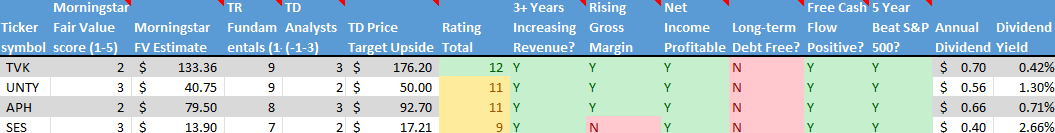
Companies on the Radar
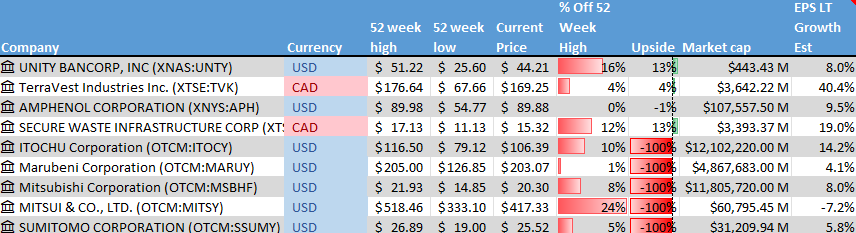
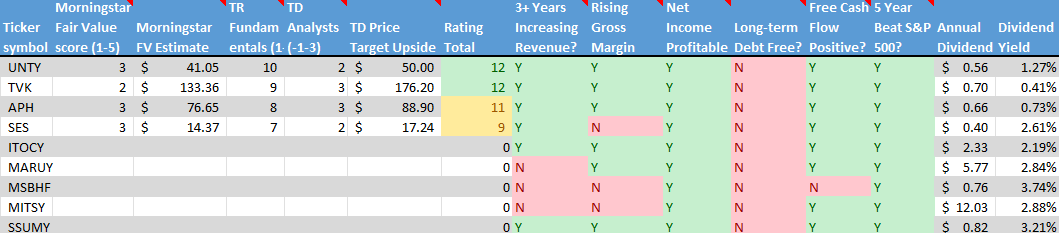
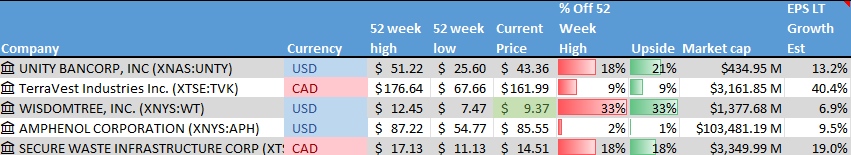
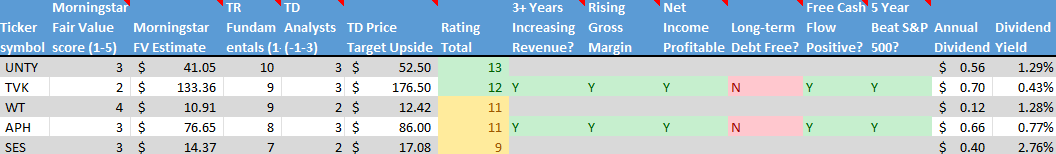
 Last week, I had my eye on the five Japanese trading houses that Warren Buffett’s Berkshire Hathaway has invested in – Itochu, Marubeni, Mitsubishi, Mitsui, and Sumitomo. But this week, I decided to part ways with them. As interesting as they are, they fall outside my circle of competence, and digging into the details of foreign companies proved tougher than expected. With those five off the list, my radar now includes these four holdovers from last week:
- Unity Bancorp (NASD: UNTY) is a small-cap regional bank based in the US, serving parts of New Jersey and Pennsylvania. It’s showing strong fundamentals, including solid revenue growth, efficient capital use, and double-digit earnings expansion. Earnings per share is expected to climb nearly 13% this year – matching industry averages – and it has a steady history of dividend increases.
- TerraVest Industries (TSE: TVK) is a Canadian mid-cap industrial company that manufactures equipment for the energy, agriculture, and transportation sectors across North America. Its product lineup includes propane tanks, specialized tanks used to store and transport ammonia gas commonly used as fertilizer (anhydrous ammonia vessels), natural gas liquids transport vehicles, and a range of energy processing equipment.
- Amphenol Corporation (NYSE: APH), a global giant in the connector and cable business, supporting a wide range of industries with electrical, electronic, and fiber optic solutions.
- Secure Energy Services (TSE: SES) is a Canadian mid-cap industrial company focused on waste management and energy infrastructure. They serve clients across North America with recycling, disposal, and environmental solutions – a solid pick in the sustainability and infrastructure space.
As always, these are not buy recommendations. Make sure to do your own research and choose investments that fit your personal financial goals. That goes double when it comes to foreign-listed companies. 😊
The Radar Check was last updated June 6, 2025.
Portfolio Update
Portfolio 1
Sold: Andlauer Healthcare Group Company (TSE: AND) I added Andlauer to the portfolio back in February 2020 as part of a strategy to diversify with a stable Canadian company that offered both growth potential and a modest dividend. Fast forward to today: the stock has more than doubled in value – and it’s now being acquired by United Parcel Service (NYSE: UPS).
UPS is buying Andlauer in an all-cash deal worth around C$ 2.2 billion, offering shareholders $55.00 per share, which is a 31% premium to where the stock was trading before the news broke.
Rather than wait several months for the deal to close, I decided to sell the shares now and lock in the gain. The upside from here is minimal – it’s unlikely another buyer will outbid UPS – and the share price will probably hover near the $55 mark until the transaction is finalized. Selling now frees up cash I can put to work in other opportunities, where I might even outperform the last few cents I’d get by holding out.
All in all, Andlauer was a strong performer, more than doubling during its time in the portfolio. That’s a big win – and a great reminder of what can happen when you invest instead of leaving cash to sit in a savings account earning 1% or 2%. Now I get to redeploy that cash and continue building my wealth through investing. 😊
That’s a wrap for this week, thanks for reading – may your portfolio stay green and your dividends steady. See you next time!