
Stagflation: What It Is and Why Markets Are Paying Attention Right Now
The last few weeks, I’ve been seeing the term “stagflation” pop up more and more to describe the situation Canada – and to a lesser extent the US – may find themselves in over the coming months. At a basic level, inflation is when the overall cost of living rises over time, meaning your money doesn’t go as far as it used to. Most central banks, including the Bank of Canada (BoC) and the Federal Reserve (Fed), aim for around 2% inflation per year, which is considered healthy for a growing economy. A recession, on the other hand, is when economic activity slows down – businesses earn less, hiring weakens, and unemployment begins to rise. But what exactly is stagflation? This week, I thought I’d take a closer look.
Stagflation is one of those economic terms that sounds complicated, but the idea is actually pretty simple – and a bit uncomfortable.
At its core, stagflation is when three things happen at the same time: slow economic growth, rising unemployment, and high inflation. Normally, these don’t show up together. When the economy slows, inflation usually cools. And when inflation is high, it’s often because the economy is running hot. Stagflation breaks that usual pattern, which is what makes it so tricky.
A helpful way to think about it is this: imagine prices for everyday things like groceries, gas, and rent are rising quickly, but businesses aren’t growing much and hiring slows down. So, people are paying more but not earning more – and some are even losing jobs. That combination can really squeeze households and make it harder for the economy to recover.
So, what causes stagflation? There’s no single trigger, but it usually comes from a mix of supply shocks and policy mistakes. A classic example is a sudden spike in the cost of key resources like oil. When energy prices jump, it becomes more expensive for businesses to produce and transport goods, which pushes prices higher (inflation). At the same time, those higher costs can slow down production and hiring (stagnation). If governments or central banks respond poorly – like keeping interest rates too low for too long or overstimulating the economy – it can make the inflation side even worse without fixing the slowdown.
Getting out of stagflation is where things get difficult. Policymakers are essentially stuck choosing between two tough options. To fight inflation, central banks (like the BoC or the Fed) may raise interest rates. That can help cool prices, but it can also slow the economy further in the short term. On the other hand, trying to boost growth – through lower rates or government spending – can risk making inflation worse. In most cases, the path out involves tightening monetary policy to bring inflation under control first, even if it means a period of economic pain, followed by gradual recovery as stability returns.
Canada experienced a period of stagflation in the 1970s, largely tied to the global oil shocks of that era. After the 1973 oil crisis, oil prices surged, driving up costs across the economy. Inflation in Canada climbed into the double digits at times, while economic growth slowed and unemployment rose. It was a difficult stretch that took years – and much higher interest rates – to bring back under control.
The United States went through a very similar experience during the same decade. Throughout the 1970s, and into the early 1980s, the US dealt with high inflation alongside weak growth and rising unemployment. The turning point came under Paul Volcker, who led the Fed and aggressively raised interest rates to break inflation – even though it triggered a recession in the short term. That painful reset ultimately helped stabilize the economy and end the stagflation cycle.
When you step back, stagflation is really a reminder that the economy doesn’t always follow the “normal” rules. And for investors, it can be a challenging environment, since both economic growth and purchasing power are under pressure at the same time.
With stagflation back in the conversation, it adds another layer of uncertainty to an already choppy market environment. With that in mind, let’s take a look at what drove the markets this week and the impact on my three portfolios.
Items that may only interest or educate me ….
Canadian Economic news, US Economic news, ….
Canadian Economic news
This past week’s key economic data that the BoC considers when deciding whether to raise or lower the interest rate.
Consumer Price Index (CPI)
Statistics Canada reported that headline inflation – the overall rise in prices – came in at 1.8% in February, a nine-month low and just below the Bank of Canada’s 2% target. That’s better than analysts’ expectations of 1.9% and down from January’s 2.3%. On a monthly basis, prices rose only 0.1%, far below the 0.7% expected and following a flat reading in January.
Looking closer, Food prices jumped 5.4% year-over-year, while gasoline fell 14.2% over the same period. Month to month, gas rose 3.6%, while household operations, furnishings, and equipment costs fell 1.4%. Shelter costs, including rent and mortgage interest, were up 1.5% over the year but edged down 0.1% in February.
The BoC’s preferred measure, core CPI, which strips out volatile items like food and energy to show underlying trends, has been slowing on an annual basis for the fourth straight month. Year-over-year, core inflation eased to 2.0% from 2.4% in January, showing that prices are rising more slowly compared to last year. On a monthly basis, however, core CPI still ticked up 0.5% in February after a 0.2% increase in January, meaning prices are slowly ticking up even as the overall pace of inflation eases.
On the surface, this looks like good news – but much of the slowdown is due to temporary factors, like last year’s sales tax relief and falling energy prices. Core areas such as food and restaurant costs are still elevated, so inflation isn’t fully under control. For investors, it’s a mixed signal: the BoC might have room to stay patient or even consider rate cuts, but persistent pressures – including rising oil prices from the US/Israel–Iran conflict – mean any changes will likely be cautious.
The slowdown in price increases is likely temporary, since higher oil costs from the conflict, which began on February 28, are expected to show up in future inflation reports, keeping the outlook uncertain.
Bank of Canada Rate Decision
As expected, the Bank of Canada held its benchmark interest rate steady at 2.25%, marking the third straight meeting with no change. The Bank is taking a wait-and-see approach as it watches how rising oil prices – driven by the Iran conflict – impact inflation in the months ahead.
While recent data shows inflation has dipped below the BoC’s 2% target, Governor Tiff Macklem cautioned that higher energy costs are likely to push inflation back up. At the same time, ongoing trade uncertainty with Canada’s largest trading partner and broader geopolitical tensions are weighing on economic growth.
This leaves the Bank in a tough spot. If inflation rises again, it may need to raise interest rates, even as the economy slows. But if the conflict eases and oil prices fall, it could instead cut rates to support growth. In other words, the BoC is walking a fine line – trying to control inflation without putting too much pressure on an already slowing economy.
Retail Sales
According to Statistics Canada, retail sales in Canada came in stronger than expected, rising 1.1% month over month in January. That’s a solid rebound from December’s 0.4% decline and a sharp contrast to expectations for another drop. On a year-over-year basis, sales rose 1.5% after being flat the previous month, suggesting the Canadian consumer is still holding up despite higher interest rates.
A closer look shows the strength wasn’t evenly spread and was driven by stronger sales at motor vehicles and parts dealers. On a percentage basis, gains were driven more by specific categories rather than broad-based spending, pointing to a more selective consumer. Miscellaneous retailers led the way with a 3.0% monthly increase and a strong 13.2% annual gain compared to last year. Meanwhile, spending in discretionary areas like clothing and accessories fell 1.1%, and gasoline sales dropped 5.7% year over year, reflecting both softer demand and lower prices.
Core retail sales, which exclude autos and gasoline to better capture underlying trends, rose 0.9% in January after a downward revised 0.4% decline in December. On an annual basis, core sales grew 3.9%, showing that while spending is still expanding, the pace remains uneven.
Stepping back, the story hasn’t really changed. The Canadian consumer is still spending, but with less consistency and confidence than before. For the BoC, that likely reinforces their cautious, wait-and-see approach. As long as spending holds up and inflation risks linger, there’s little urgency to move quickly on rate cuts.
Looking ahead, Statistics Canada’s advance estimate points to another 0.9% increase in February. If that holds, it would mark the first back-to-back monthly gains in nearly a year, a small but encouraging sign after a choppy stretch for retailers through 2025.
Canadian Market Volatility
Canada’s version of the market “fear gauge” is the S&P/TSX Volatility Index, often shown on trading platforms as VIXI.TO. Like the CBOE Volatility Index in the US, it measures how much volatility investors expect in the Canadian stock market over the next 30 days.
The index opened the week at 20.10 and quickly climbed to just under 21 as concerns around the Iran conflict and rising inflation picked up. It then drifted between 19 and 20 for much of the week before pushing back above 21 toward the end, following reports of tit for tat strikes on oil infrastructure in the Middle East. That raised concerns that oil prices could stay elevated, potentially putting upward pressure on inflation. By the close, however, volatility had eased slightly, with the index finishing at 20.14.
In general, readings in the high teens suggest a more cautious market, while levels above 20 signal rising investor unease. Canadian volatility also tends to run lower than in the US, largely because the TSX is more heavily weighted toward sectors like financials, energy, and materials – industries that typically see steadier price movements than the high-growth technology stocks that dominate American markets.
US Economic news
This past week’s key data points that the Fed considers when deciding whether to raise or lower the interest rate.
Federal Open Market Committee (FOMC) Interest Rate Decision
As expected, the Fed’s FOMC held interest rates steady at its latest meeting, keeping the benchmark rate in the 3.5%–3.75% range while assessing inflation and the strength of the American economy. The decision wasn’t unanimous, with two officials voting in favour of a rate cut, though the majority opted to stay patient for now.
Headline inflation has been trending lower, but underlying price pressures remain persistent, particularly in core measures that strip out volatile food and energy costs. This slower progress complicates the Fed’s decisions, especially as the economy shows signs of slowing with softer hiring and cooling consumer demand.
Fed Chair Jerome Powell reiterated that the central bank is in no rush to cut rates, noting that more evidence is needed to confirm inflation is sustainably under control. He said the Fed expects one rate cut in 2026 while projecting stronger growth and higher inflation than previously anticipated, but risks are becoming more balanced, meaning Fed officials could pivot if conditions weaken. In his post-decision press conference, Powell also acknowledged that the Iran-US conflict and higher energy prices are adding uncertainty and could push inflation higher in the near term, though it’s still too early to know the full scope or duration of the impact.
For now, the Fed is staying patient. If inflation continues to ease, rate cuts could come into view later this year – but if inflation proves stubborn – or rises due to factors like higher energy costs – the Fed may keep rates elevated longer.
American Market Volatility
The CBOE Volatility Index – often called the market’s “fear gauge” – measures how much volatility investors expect in the stock market over the next 30 days. Think of it as the market’s pulse: readings above 20, as was the case this week, typically signal rising caution among investors.
The index opened the week at 25.88 amid heightened tensions in the Middle East, then drifted toward the 21.5 level in the days leading up to the Fed’s rate decision before climbing back above 27. Following the announcement, the fear gauge eased to around 23.50. While the Fed held rates steady, it noted that the Iran conflict is adding uncertainty to the inflation outlook. Ongoing strikes on energy infrastructure raised concerns about supply disruptions, pushing oil prices higher and increasing the chances of reigniting inflation.
Adding to the swings, roughly US$5.7 trillion in options expired at the end of the week, injecting another dose of volatility on top of the geopolitical and inflation concerns, briefly sending the VIX above 29. By week’s end, however, it had cooled slightly to 26.78.
Weekly Market and Portfolio Review
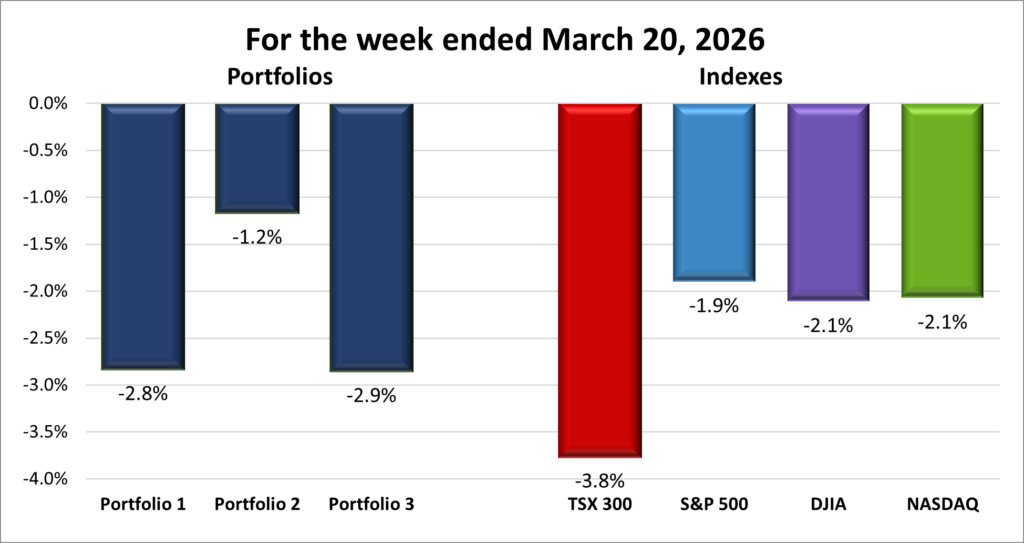
For the week, the TSX (SPTSX) plunged 3.8%, the S&P 500 (SPX) slipped 1.9%, the DJIA (INDU) and the Nasdaq (CCMP) both declined 2.1%.
| Index | Weekly Streak |
| TSX: | 3 – week losing streak |
| S&P: | 4 – week losing streak |
| DJIA: | 4 – week losing streak |
| Nasdaq: | 4 – week losing streak |
![]() Last week, it was the Middle East conflict that unnerved investors. This week, uncertainty joined geopolitical tensions at centre stage. Concerns over how long the Iran conflict could last—and its impact on energy prices, now more than 40% higher since hostilities began – combined with unclear signals from central banks on when rates might come down, left investors on edge.
Last week, it was the Middle East conflict that unnerved investors. This week, uncertainty joined geopolitical tensions at centre stage. Concerns over how long the Iran conflict could last—and its impact on energy prices, now more than 40% higher since hostilities began – combined with unclear signals from central banks on when rates might come down, left investors on edge.
Markets started the week on a positive note, with the Toronto Stock Exchange Composite Index (TSX), S&P 500 Index (S&P), Dow Jones Industrial Average (DJIA), and Nasdaq Composite Index (Nasdaq) posting back-to-back gains. That early optimism quickly faded. By midweek, selling pressure pushed the TSX and S&P to their lowest levels since September, the DJIA to its lowest since November, and left the Nasdaq down nearly 10% from its October 29 record high.
The broader pullback has been building since the conflict began three weeks ago. Over that stretch, the TSX is down nearly 9%, the DJIA is lower by almost 7%, the S&P has lost 5.4%, and the Nasdaq has slipped 4.5%. By Thursday, those early gains had fully evaporated, with all four indexes ending the week on a three-session losing streak.
Adding to the cautious tone, all three major American indexes fell below their 200-day moving averages – a widely watched signal that long-term momentum may be weakening. When multiple indexes break this level simultaneously, it often points to broad-based weakness and fading investor confidence.
Energy markets were once again at the centre of it all. Ongoing strikes involving the US, Israel, and retaliatory strikes by Iran raised fears of supply disruptions and pushed oil prices higher, with tensions further escalating after Israel targeted Iran’s South Pars gas field and retaliatory strikes followed.
There were some signs of de-escalation. Reports that the US urged Israel to avoid further attacks on Iranian energy infrastructure, along with efforts to reopen the Strait of Hormuz, helped calm markets slightly. Even so, none of the combatants appear ready to back down. Iran continued targeting regional energy infrastructure, while the US is reportedly considering using troops to take control of Kharg Island, Iran’s main oil export hub, to pressure Iran to reopen the Strait.
The renewed tension pushed oil prices back above US$100 per barrel, with inflation expectations creeping higher. Even if tanker traffic resumes, damage to production infrastructure could take years to repair, leaving a lasting impact on global supply.
The Fed’s latest rate decision came against this backdrop. As expected, it held rates steady but now projects just one rate cut this year. With energy prices rising again, the Fed faces a more complicated path, raising concerns that higher oil costs could keep inflation and interest rates elevated for longer.
In Canada, energy stocks helped support the TSX early in the week. With the index heavily weighted toward energy and financials, rising crude prices lifted the index, while steady bank stocks helped cushion broader weakness. Being a net oil exporter also helped Canada absorb some of the shock, even as higher prices added to inflation concerns.
As the week progressed, that initial support faded. Rising oil prices fuelled concerns that inflation could reaccelerate, while BoC commentary that signalled they were in no rush to cut rates added to the cautious tone. By midweek, those pressures outweighed energy’s benefits, dragging the TSX to a three-month low and shifting sentiment from easing inflation to a more uncertain outlook.
By week’s end, markets on both sides of the border were caught between easing inflation trends and a renewed surge in energy-driven inflation, along with uncertainty around interest rates. That push and pull kept volatility elevated as investors tried to figure out whether this is a temporary shock or the start of another inflationary wave.
| Portfolio | Weekly Streak |
| Portfolio 1: | 1 – week losing streak |
| Portfolio 2: | 4 – week losing streak |
| Portfolio 3: | 2 – week losing streak |
![]() With this backdrop, it was no surprise the portfolios once again lost ground. It’s starting to feel a bit like 2022, when inflation pushed every major American index temporarily into full bear markets (20%+ declines), with the Nasdaq falling as much as 35% at one point. That year, Portfolio 2 did the best—or maybe more accurately, lost the least – declining 27% for the year.
With this backdrop, it was no surprise the portfolios once again lost ground. It’s starting to feel a bit like 2022, when inflation pushed every major American index temporarily into full bear markets (20%+ declines), with the Nasdaq falling as much as 35% at one point. That year, Portfolio 2 did the best—or maybe more accurately, lost the least – declining 27% for the year.
We’re nowhere near that level of damage today, even with the Canadian market sliding for three straight weeks and the American indexes logging four consecutive weekly losses. Still, I’d feel a lot better if markets could string together a few winning weeks. 😊
Portfolio 1 had a tough week, slipping 2.8%, which wasn’t surprising given just 17% of holdings finished in the green. Ouch! Falling gold prices weighed heavily, with the iShares S&P/TSX Global Gold Index ETF (TSE: XGD) dropping 13% as gold pulled back from recent all-time highs. Technology names also dragged on performance, including Navitas Semiconductor (NASD: NVTS), down 15%, The Trade Desk (NASD: TTD), which fell 12%, and the largest holding, Nvidia (NASD: NVDA), down 5%.
Portfolio 2 held up the best, falling “only” 1.2%. It also had the highest percentage of winners, with 43% of holdings ending the week higher. Strength in oil prices helped support the portfolio’s energy names and limit broader downside, though that was partly offset by a 12% drop in Brookfield Infrastructure Corporation (TSE: BIPC).
Portfolio 3 had the toughest week, falling 2.9%. With only 23% of holdings advancing – including its two largest positions, Nvidia and Shopify (TSE: SHOP) – the result wasn’t all that surprising. Losses were broad-based, with Lithium Americas Corp. (TSE: LAC) standing out after a 17% drop. On a more positive note, Rocket Lab (NASD: RKLB), despite a weekly loss, announced a US$190 million, four-year contract with the US Department of Defense – the largest launch contract in the company’s history.
It wasn’t an easy week, and there could be more like it if the Iran conflict continues to push oil prices higher and keep inflation concerns front and centre. While it’s never fun seeing red across the board, I still try to look at pullbacks like this as opportunities to become an owner of some of the world’s best companies at better prices – glass half full, I guess. 😊 For now, it’s a matter of grinding through it.
Companies on the Radar
 After a few weeks of companies moving on and off my radar, things were relatively quiet on the investing front this past week, and my list remains unchanged with the five companies below.
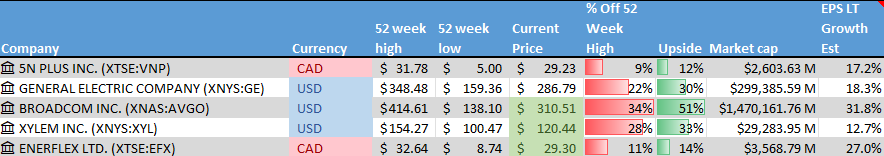
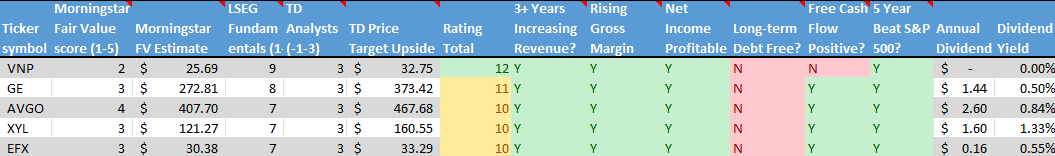
Currently, my primary focus is on 5N Plus Inc. (TSX: VNP), GE Aerospace (NYSE: GE), and Broadcom (NASD: AVGO), which scored the highest on my Quick Test – my second step for separating great businesses from merely good ones. These companies earned scores of 89%, 84%, and 86%, respectively.
In the Radar List charts below, companies are ranked based on their total score from my initial radar test. Think of it as a quick, high-level filter that separates the most promising opportunities from the rest, so I can focus my time on the companies that deserve a closer look. That closer look comes with my Quick Test, a checklist I created to assess a company’s quality more thoroughly. By combining hard financial data with key indicators of strong business fundamentals, the Quick Test helps me quickly identify high-quality opportunities versus potential value traps – before I spend time doing a full deep dive.
- 5N Plus Inc.: a small-cap Canadian company that produces high-purity specialty metals and semiconductor materials used in space solar power, renewable energy, medical imaging, and electronics. Many of its products are mission-critical, requiring consistent quality and long-term supply. With exposure to space programs, clean energy, and strategic materials, 5N Plus operates in several niche but expanding markets where technical expertise creates competitive advantages.
- GE Aerospace: This is the large American aviation and defence business that remained after General Electric split into three separate companies in 2024. It has been on a strong run thanks to high demand for commercial jet engines as global air travel continues to recover. The company focuses on aircraft propulsion systems and services for both commercial and military customers, and it’s also moving into drones. As a global leader in jet engines and aircraft systems, GE Aerospace offers exposure to long-term trends in travel, defence spending, and emerging aviation technology.
- Broadcom: A large cap American company that sells semiconductors and software globally. It designs critical chips used in data centres, networking equipment, and broadband infrastructure, playing a behind-the-scenes role in cloud computing and AI. Broadcom also owns a growing enterprise software business following its acquisition of VMware, giving it exposure to both hardware and software spending tied to artificial intelligence (AI) and cloud growth.
- Xylem Inc. (NYSE: XYL): This is a large American company that develops water technology focused on moving, treating, and managing water. Its products and services are used by utilities, industrial customers, and municipalities for everything from clean drinking water and wastewater treatment to flood control and leak detection. With aging water infrastructure and more frequent climate challenges like droughts and flooding, demand for Xylem’s solutions is still strong. The business offers exposure to long-term, essential infrastructure spending tied to water scarcity, sustainability, and smarter cities.
- Enerflex Ltd. (TSE: EFX): a Calgary-based industrial company that provides engineered energy infrastructure and transition solutions for the global natural gas and power markets. Enerflex designs, manufactures, installs and services equipment and modular facilities – including gas compression, processing systems, power generation and treated water solutions – that are critical to natural gas midstream and industrial operations. With a global footprint and expertise spanning engineering, fabrication and after-market support, Enerflex operates in markets where reliable energy handling and infrastructure are essential, and where long-term contracts and technical integration create competitive advantages.
As always, these are not buy recommendations. Make sure to do your own research and choose investments that fit your personal financial goals.
The Radar Check was last updated March 20, 2026.
That’s a wrap for this week, thanks for reading – may your portfolio stay green and your dividends steady. See you next time!