
The past six months have been a rollercoaster ride for investors as expectations regarding the Federal Reserve’s (Fed) interest rate policy shifted gears. Initially, investors and analysts were talking about the Fed maintaining the rate at 5.5% for a while, only to switch towards discussions of potential rate cuts early in 2024. However, recent inflation numbers have brought us back to the “higher for longer” sentiment. The consensus now leans towards the Fed holding steady at the current 5.5% rate for a bit longer than anticipated. Investors are now reconsidering their expectations, eyeing June as the potential window for when the Fed might begin to lower rates.
Let’s take a look at the economic news of the past week and see how it impacted the Canadian and American stock markets as well as the three portfolios ….
Items that may only interest or educate me ….
Canadian Economic news, US Economic news, Bad breath….
Canadian Economic news
This past week’s key economic data that the Bank of Canada (BoC) considers when deciding whether to raise or lower the interest rate.
Canadian market volatility
In Canada, the TSX 60 VIX, also known as Canada’s volatility index (VIXC) or ‘fear gauge,’ reflects the mood of Canadian stock markets. This week, the VIXC experienced a midweek spike to 13.33 following the release of American inflation data, before tapering off to end the week at 10.46, a slight decrease from the previous week’s 11.05.
The VIXC gauges volatility within the Canadian stock markets, with readings above 20 generally viewed as ‘high’ and those below 20 as ‘low.’ The current reading of 10.46 sits on the lower end of the spectrum, indicating a prevailing sense of confidence among investors in the Canadian markets.
US Economic news
This past week’s key data points that the Federal Reserve (Fed) considers when deciding whether to raise or lower the interest rate.
Consumer Price Index (CPI)
The Labor Department’s January CPI report revealed that inflation increased by 0.3% in January, following a 0.2% rise in December. Annually, the CPI rose by 3.1%, a slight deceleration from the 3.4% increase observed in December. Despite the January monthly inflation rate being the lowest since June 2023, they both exceeded analysts’ predictions of a 0.2% monthly and a 2.9% yearly increase.
Taking a closer look, the core CPI, which strips out the volatile costs of food and energy, climbed by 0.4% in January, up slightly from a 0.3% increase from December. On an annual basis, core CPI rose by 3.9% in January. Both numbers exceeded analyst predictions for a 0.3% monthly and 3.7% yearly increase.
Breaking down the details, the most significant monthly price hike was observed in the ‘Utility gas services’ subsector, which jumped by 2.0%. Conversely, ‘Fuel oil’ prices saw the biggest decline, dropping by 4.5%. Excluding the food and energy sectors, the ‘Transportation services’ subsector experienced the highest price increase at 1.0%, while ‘Used cars and trucks’ saw the largest drop, falling by 3.4%.
Looking at the year-over-year changes, ‘Transportation services’ prices surged by 9.5%, making it the subsector with the highest increase, whereas ‘Utility gas service’ prices plummeted by 17.8%. In the core CPI category, ‘Transportation services’ also led the annual price increases, and ‘Used cars and trucks’ recorded the most notable decrease at 3.5%.
The higher-than-anticipated inflation data all but eliminates the chances of the Fed lowering interest rates in their upcoming March meeting, contrary to investors’ hopes for easing inflation figures. This unexpected development led to all four indexes ending sharply lower the day of the news release.
In the days following the report, investors digested the inflation data and were buoyed by a Fed official’s reassurance that the recent data does not disrupt the overall downward inflation trend or the prospect of a soft landing for the US economy. This perspective, suggesting rate cuts are on the horizon—albeit later than hoped—revived investor confidence, propelling stock indexes upward once more.
With a March rate cut now seeming improbable, attention shifts to the Fed’s meeting on April 30 – May 1. Analysts and investors are uncertain about a rate cut in this session unless data between now and then indicates a significant drop in inflation. Expectations are now set on the possibility of the Fed commencing rate reductions at their June 11 – 12 meeting.
However, the question remains: Is this recent inflation data merely a hiccup on the path to lower inflation, or a sign of persistently high inflation? Hopefully, the February CPI report will provide some clarity.
Retail Sales
The Commerce Department’s advanced retail sales data for January indicated a 0.8% decline, marking the most significant month-over-month decrease since March 2023. This downturn comes after a revised 0.4% increase in December. When automobiles are excluded, retail sales dropped by 0.6% in January, a reversal from the 0.4% rise in the preceding month. These figures fell short of analyst expectations, which predicted a modest 0.1% decrease in overall retail sales and a 0.2% increase when excluding automobiles. On an annual basis, retail sales saw a modest increase of 0.6% since January 2023, with a 1.2% rise when vehicle sales are excluded.
The decline in sales could indicate a weakening in the resilience of American consumers, traditionally a cornerstone of the US economy’s strength. This slowdown in consumer spending supports the Fed’s inflation control efforts, as reduced spending can ease inflationary pressures. Consequently, the lower-than-expected retail sales figures may alleviate some of the concerns of the previously reported higher-than-expected CPI data (see the CPI summary above), suggesting higher prices which put upward pressure on inflation. With consumer spending on the decline, the Fed might be less concerned about economic activity reigniting inflation, which is encouraging news for those anticipating a decrease in interest rates.
American market volatility
Following the release of the CPI data this past Tuesday, Wall Street’s ‘fear gauge,’ the CBOE Volatility Index (VIX), spiked to 17.90 – its highest level since November – before settling at 14.24 at week’s end. This increase from last week’s 12.93 reflects investors concerns about the higher inflation data reported in January. However, the current reading remains well below its long-term average of 20, indicating that investors anticipate significantly less volatility in the weeks ahead compared to historical trends. This week is a good example of how the VIX can fluctuate wildly, even on a daily basis.
Consumer Sentiment Index (CSI)
The University of Michigan’s preliminary consumer sentiment index for February edged up to 79.6, a slight increase from January’s figure of 79.0 but below analysts’ expectations of 80. Year-over-year, the index has surged 19.0%, reflecting a significant rebound in consumer confidence since February 2023.
This preliminary reading is the highest level of consumer sentiment since July 2021. Several factors contribute to this boost in consumer confidence: a deceleration in the pace of inflation, and despite higher interest rates the economy continued to grow and the labour market remains strong. Further bolstering consumer optimism are the rising stock markets, falling gas prices, and the anticipation of lower interest rates later this year. However, despite these positive developments, the CSI remains below its pre-pandemic levels, which often hovered around the 100 mark.
The final CSI reading for February will come at the end of the month.
Bad breath
Last week, while talking about the ‘Magnificent 7,’ I stumbled upon an intriguing investing term: ‘bad breath.’ This term is used to describe a market scenario where a narrow rally occurs, meaning the indexes are driven higher by a small number of companies. This phenomenon has been particularly evident in 2024, as the ‘Magnificent 7‘ has shrunk to the ‘Fantastic 4,’ exacerbating the ‘bad breadth’ condition in the US market. The main American indexes are reaching new heights, propelled almost exclusively by these few tech giants.
In investment circles, ‘bad breath’ signifies a market condition where the gains of major stock indexes are disproportionately due to the performance of a select few stocks, rather than a broad-based advance across many sectors. This narrow rally can obscure underlying weaknesses in the broader market, creating a misleading appearance of overall health. Such conditions are scrutinized for their potential to indicate less robust market strength and suggest that without broader participation, the rally’s sustainability is in question.
Weekly Market Review
Monday: the momentum from last week that saw the S&P 500 Index (S&P) close over 5000 for the first time did not carry over to the start of this week. The markets ended the day split, with the more value-oriented Toronto Stock Exchange Composite Index (TSX) and the Dow Jones Industrial Average (DJIA) ending higher, while the more growth-oriented S&P and the Nasdaq Composite Index (Nasdaq) ended lower. On tap this week are more quarterly reports and tomorrow’s US CPI report to see if inflation continued to fall in January. Investors will be looking for clues to when the Fed may start lowering the interest rate.
In Canada, the TSX rose to a 10 day high as investors await the latest US inflation report and signs of future rate cuts. In trading, Energy and Consumer Cyclicals posted the biggest gains, while Technology, Healthcare, and Industrials were the only Canadian sectors to end lower.
In the US, the DJIA set another record close while the Nasdaq briefly surpassed its highest point since November 2021 before sliding back down. In trading in the American sectors, it was a day of broad-based gains, led by the Utilities and Energy sectors. Technology was the only sector to slip.
Tuesday: the indexes stumbled following the latest American CPI report that showed inflation for January was higher than expected. The markets do not like surprises, especially when its bad news like this. As a result, all four indexes ended deeply in the red. Oil prices continued to climb due to supply uncertainties in the Middel East.
In Canada, the TSX had its biggest single day decline since September 2022 because of the inflation news out of the US. In trading, no sector escaped ending in the red. Industrials and Consumer Staples slipped the least while Technology and Basic Materials (miners and fertilizer manufacturers) dropped the most.
In the USA, it was not a good day for the American indexes as all three dropped by more than 1%. The S&P dropped back below the 5,000 mark, while the DJIA had its worst day since March 2022. No sector was safe from the sell off today. Telecommunications Services and Consumer Staples declined the least, while Basic Materials and Financials sank the farthest.
Wednesday: following yesterday’s plunge, the markets rebounded after a Fed official said a few high inflation readings would not shake his belief that inflation is still heading downward towards the Fed’s 2% target. Oil prices sunk as American inventories of crude oil piled up.
In Canada, the TSX was able to recoup much of yesterday’s losses as all Canadian sectors finished in the green. Leading the way were the Technology and Industrials sectors, with Energy and Telecommunications Services bringing up the rear.
In the US, the three American indexes bounced back as well, led by the Technology and Industrials sectors, while Energy and Consumer Staples were the only sectors to end in the red.
Thursday: the markets continued yesterday’s upward momentum with all four indexes ending firmly higher. The latest US retail sales data came in lower than expected, giving investors hope US interest rates might drop sooner than later.
In Canada, the TSX posted its highest gain in over two months thanks to higher commodity prices. The TSX closed today higher than it was before Tuesday’s plunge. All Canadian sectors ended higher with Energy and Technology recording the biggest increase, while Consumer Cyclicals and Telecommunications Services posted the smallest increases.
In the US, preliminary retail sales numbers came in lower than expected raising questions about a slowing economy. The S&P hit a new record high, recovering the losses incurred by the market plunge on Tuesday. In trading, all American sectors ended the day in the green, led by Energy and Financials, with Technology and Consumer Staples trailing the pack.
Friday: It was a mixed day for the indexes with the TSX the only index to end higher. The latest report on US wholesale prices came in higher than expected. The combination of higher consumer prices in the earlier CPI report and now higher wholesale prices has investors worried the Fed will delay lowering the US interest rate. Oil prices rose, after the International Energy Agency warned of slowing demand.
In Canada, higher commodity prices helped push the TSX to its highest point in almost two years. In trading on Bay Street, Telecommunications Services and Basic Materials posted the biggest gains, while the growth-oriented sectors Technology and Consumer Cyclicals were the only sectors in the red.
In the US, the PPI report indicated wholesale prices rose 0.3%, the highest rate of increase in five months. Core wholesale prices, which exclude the volatile food, energy, and trade margins, rose 0.6%, the fastest growth since January 2023. As well, two Fed officials said they wanted to see more evidence inflation was falling but were open to lowering rates at some point this year. In trading on Wall Street, Basic Materials, Healthcare and Energy were the only sectors to end higher. The Technology and Industrials sectors suffered the biggest declines.
Weekly Market and Portfolio Review
For the week, the TSX (SPTSX) rose 1.2%, the S&P 500 (SPX) slipped 0.4%, the DJIA (INDU) declined 0.1% and the Nasdaq (CCMP) fell 1.3%.
| Index | Weekly Streak |
| TSX: | 1-week winning streak |
| S&P: | 1-week losing streak |
| DJIA: | 1-week losing streak |
| Nasdaq: | 1-week losing streak |
![]()
It was quite the rollercoaster ride for major North American stock indexes this past week, particularly after two key inflation reports in the US—the Consumer Price Index (CPI) and the Producer Price Index (PPI)—came in higher than expected. Investors, who had been hopeful that falling inflation might pave the way for interest rate cuts, received a reality check. Higher-than-anticipated inflation figures, coupled with hawkish comments from Fed officials indicating there was “more work to do” on inflation, dampened hopes for an imminent easing of interest rates. This led to a weekly decline in the three American indexes, as shown in the chart above.
After a steady buildup in the markets leading up to the CPI announcement, a sharp sell-off occurred on Tuesday. However, markets began their uphill climb the next day, with the DJIA and the S&P setting new all-time highs, only to retreat again following the PPI report Friday morning. The Nasdaq was hit hardest, as the prospect of higher interest rates raises borrowing costs, particularly affecting technology companies that depend on external financing for growth.
In contrast, the TSX outperformed its American counterparts, buoyed by rising energy (oil and natural gas) and commodity (gold and minerals) prices, sectors in which the TSX is heavily invested.
Despite the setbacks from higher inflation data and Fed officials’ hawkish coments, the overall market rally remained relatively resilient. However, we wont know if the markets will rebound or continue to pullback until next week. Looking ahead, I am hopeful that a strong earnings report from Nvidia could reignite the market’s upward trajectory. 😊
| Portfolio | Weekly Streak |
| Portfolio 1: | 7-week winning streak |
| Portfolio 2: | 1-week losing streak |
| Portfolio 3: | 1-week losing streak |
![]() With three of the four indexes down for the week, I was pleasantly surprised to see one of the three portfolios managed to buck the trend and post gains, as illustrated in the chart below. Under the circumstances, Portfolio 1 saw an impressive uptick, thanks primarily to substantial gains in The Trade Desk (NASD: TTD), which surged by 24%, and Nano-X Imaging (NASD: NNOX), which skyrocketed by an astonishing 123%. This leap came on the heels of Nvidia (NASD: NVDA) disclosing its investment in Nano-X. While most holdings in this portfolio experienced slight increases or decreases this past week, Roku (NASD: ROKU) suffered a sharp 25% decline. The company’s warning of “weak” future growth amidst rising competition in the streaming sector led to this significant drop.
With three of the four indexes down for the week, I was pleasantly surprised to see one of the three portfolios managed to buck the trend and post gains, as illustrated in the chart below. Under the circumstances, Portfolio 1 saw an impressive uptick, thanks primarily to substantial gains in The Trade Desk (NASD: TTD), which surged by 24%, and Nano-X Imaging (NASD: NNOX), which skyrocketed by an astonishing 123%. This leap came on the heels of Nvidia (NASD: NVDA) disclosing its investment in Nano-X. While most holdings in this portfolio experienced slight increases or decreases this past week, Roku (NASD: ROKU) suffered a sharp 25% decline. The company’s warning of “weak” future growth amidst rising competition in the streaming sector led to this significant drop.
Portfolio 2 presented a bit of a puzzle. Despite the lack of major losses, the portfolio didn’t fare as well overall. This could be attributed to smaller declines across a broader range of stocks, overshadowing the notable gains in MongoDB (NASD: MDB) and Disney (NYSE: DIS), which were up 16% and 23%, respectively.
Finally, Portfolio 3’s decline was more straightforward to pinpoint. Shopify (TSE: SHOP), which comprises 22% of the portfolio, saw its share price tumble by 12.5% following a revenue growth forecast that fell short of analyst expectations. Though it recouped some of its losses to close the week down by 10%, the impact was significant. That said, not all was gloomy for Portfolio 3, with Telus International (TSE: TIXT) and goeasy (TSE: GSY) posting gains of 20% and 13%, respectively, showcasing some positive movement amidst the challenges.

Companies on the Radar
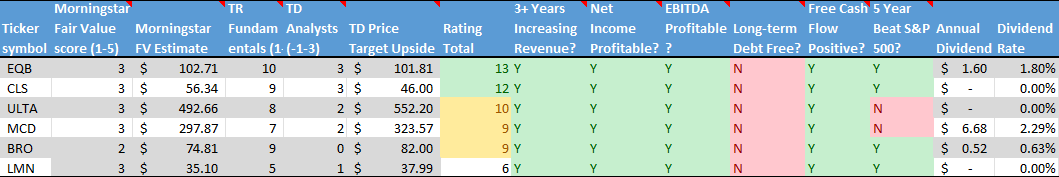
 Once again, no new companies came across my radar. The six holdovers from last week are:
- Equitable Bank (TSE: EQB), a mid sized Canadian bank that provides financial services to consumers and businesses.
- McDonald’s (NYSE: MCD), the large sized American global fast-food chain.
- Ulta Beauty (NASD: ULTA), a major American beauty product retailer, with over 25,000 products from 600 brands.
- Celestica Inc. (TSE: CLS), a medium sized Canadian company that manufactures electronic products and provides supply chain services to companies around the world.
- Brown & Brown (NYSE: BRO), a major American firm, specializing in insurance and reinsurance products and services to a wide range of clients around the world.
- Lumine Group (TSE: LMN), a young Canadian mid sized company that acquires communications and media software companies and then strengthens and grows those companies.
Please keep in mind that these are only companies that have piqued my interest. This is not a recommendation or financial advice. You should do your own research or contact a professional before making any investment decisions.
The Radar Check was last updated February 16, 2024.

Portfolio Update
Portfolio 1
Portfolio 1 for the week ended February 16, 2024: UP ![]()
- Not to often that I come across good news that involves two companies in a single portfolio, but this week Celsius Holdings (NASD: CELH), makers of Celsius energy drinks, signed a global, multi year partnership with Ferrari (NYSE: RACE). Celsius will be the official energy drink of one of the most famous racing brands.
- The European Union’s anti trust regulator, the European Commission, ruled service platforms provided by Apple (NASD: AAPL) and Microsoft (NASD: MSFT) should not be designated as ‘gatekeepers.’ This ruling saved both companies from onerous requirements.
- Lightspeed Commerce (TSE: LSPD) announced founder and former Chief Executive Officer (CEO) Mr. Dax Dasilva would resume the CEO after the market seemed to lose confidence in the company and Mr. Dasilva’s successor. Despite significant growth in revenues, the share price has lost almost 45% in value since Mr. Dasilva first stepped away from the CEO position.
- Alphabet’s (NASD: GOOGL) self driving vehicle unit Waymo issued a recall for 444 of its’ self driving cars due to two recent collisions. The accidents were a result of a software error that caused the cars to inaccurately predict the movement of vehicles being towed.
Alphabet’s more well-known unit, Google, announced they would launch an anti-misinformation campaign across Belgium, France, Germany, Italy, and Poland. I suspect this campaign will make its way to North America in time for the US election in November. 😊 - General Motors (NYSE: GM) signed a deal with Canadian mining company Nouveau Monde Graphite for a supply of refined graphite for use in its electric batteries. GM will invest $150 million with the miner in exchange for 18,000 tonnes per year of graphite.
In other GM news, the hardware chief of the company’s Cruise unit resigned as part of the fallout of Cruise suspending operations following a traffic accident.
Activity
No significant activity to report this week.
Dividends
Dividends Received this week for the following companies:
Companies followed by DRIP (Dividend Re-Investment Plan) indicate additional shares were purchased with the dividend. Any cash leftover was added to the cash balance.
Canadian $
Dream Industrial Real Estate Investment Trust (TSE: DIR.UN)
Decisive Dividend Corp (TSE: DE)
US $
Apple Inc (NASD: AAPL)
BSR Real Estate Investment Trust (TSE: HOM.U)
Costco Wholesale Corp (NASD: COST)
Quarterly Reports
Lattice Semiconductor Corporation
All currency listed in thousands of US dollars, except for per share data.
Selected highlights from their fourth quarter 2023 financial results on February 12, 2024
- Revenue of $170,596 for the three months ended December 30, compared to $175,960 for the same period ended December 31, 2022. A decrease of over 3%.
- Net income of $98,706 for the three months ended December 30, compared to net income of $51,913 for the same period ended December 31, 2022.
- Diluted earnings per ordinary share of $0.71 for the three months ended December 30, compared to earnings of $0.38 per share for the same period ended December 31, 2022.
- Revenue of $737,154 for the year ended December 30, compared to $660,356 for the same period ended December 31, 2022. An increase of almost 12%.
- Net earnings of $259,061 for the year ended December 30, compared to net earnings of $178,882 for the same period ended December 31, 2022.
- Diluted earnings per ordinary share of $1.85 for the year ended December 30, compared to earnings of $1.27 per share for the same period ended December 31, 2022.
Datadog, Inc.
All currency listed in thousands of US dollars, except for per share data.
Selected highlights from their fourth quarter 2023 financial results on February 13, 2024
- Revenue of $589,649 for the three months ended December 31, compared to $469,399 for the same period in 2022. An increase of almost 26%.
- Net income of $53,993 for the three months ended December 31, compared to a net loss of $29,034 in the same period in 2022.
- Diluted earnings per ordinary share of $0.15 for the three months ended December 31, compared to a loss of $0.09 per share for the same period in 2022.
- Revenue of $2,128,359 for the year ended December 31, compared to $1,675,100 for the same period in 2021. An increase of over 27%.
- Net earnings of $48,568 for the year ended December 31, compared to a net loss of $50,160 in the same period in 2021.
- Diluted earnings per ordinary share of $0.14 for the year ended December 31, compared to a loss of $0.16 per share for the same period in 2021.
Dream Industrial Real Estate Investment Trust
All currency listed in thousands of Canadian dollars, except for per share data.
Selected highlights from their fourth quarter 2023 financial results on February 13, 2024
- Revenue of $85,181 for the three months ended December 31, compared to $75,548 for the same period in 2022. An increase of almost 13%.
- Net loss of $8,817 for the three months ended December 31, compared to a net loss of $34,147 in the same period in 2022.
- Diluted funds from operations of $0.24 for the three months ended December 31, compared to $0.23 per share for the same period in 2022.
- Revenue of $334,180 for the year ended December 31, compared to $281,587 for the same period in 2021. An increase of over 27%.
- Net income of $104,299 for the year ended December 31, compared to net income of $705,885 in the same period in 2021.
- Diluted funds from operations of $0.98 for the year ended December 31, compared to $0.89 per share for the same period in 2021.
The Trade Desk, Inc.
All currency listed in thousands of US dollars, except for per share data.
Selected highlights from their fourth quarter 2023 financial results on February 15, 2024
- Revenue of $605,797 for the three months ended December 31, compared to $490,737 for the same period in 2022. An increase of over 23%.
- Net income of $97,323 for the three months ended December 31, compared to net income of $71,187 in the same period in 2022.
- Diluted earnings per ordinary share of $0.19 for the three months ended December 31, compared to earnings of $0.14 per share for the same period in 2022.
- Revenue of $1,946,120 for the year ended December 31, compared to $1,577,795 for the same period in 2021. An increase of over 23%.
- Net earnings of $178,940 for the year ended December 31, compared to net earnings of $53,385 in the same period in 2021.
- Diluted earnings per ordinary share of $0.36 for the year ended December 31, compared to earnings of $0.11 per share for the same period in 2021.
Roku, Inc.
All currency listed in thousands of US dollars, except for per share data.
Selected highlights from their fourth quarter 2023 financial results on February 15, 2024
- Revenue of $984,425 for the three months ended December 31, compared to $867,056 for the same period in 2022. An increase of almost 14%.
- Net loss of $78,291 for the three months ended December 31, compared to a net loss of $237,197 in the same period in 2022.
- Diluted loss per ordinary share of $0.55 for the three months ended December 31, compared to a loss of $1.70 per share for the same period in 2022.
- Revenue of $3,484,619 for the year ended December 31, compared to $3,126,534 for the same period in 2021. An increase of over 11%.
- Net loss of $709,561 for the year ended December 31, compared to a net loss of $498,005 in the same period in 2021.
- Diluted loss per ordinary share of $5.01 for the year ended December 31, compared to a loss of $3.62 per share for the same period in 2021.
Portfolio 2
Portfolio 2 for the week ended February 16, 2024: DOWN ![]()
- Bank of Nova Scotia’s (TSE: BNS) head of global banking is leaving the bank for Power Corporation (TSE: POW). This is the latest change of senior executives since new CEO Scott Thomson took over. The heads of Canadian banking, wealth management, and international banking have also left the company.
Activity
No significant activity to report this week.
Dividends
Dividends Received this week for the following companies:
Companies followed by DRIP (Dividend Re-Investment Plan) indicate additional shares were purchased with the dividend. Any cash leftover was added to the cash balance.
Canadian $
SmartCentres Real Estate Investment Trust (TSE: SRU.UN)
US $
No US$ dividends this past week.
Quarterly Reports
Airbnb, Inc.
All currency listed in millions of US dollars, except for per share data.
Selected highlights from their fourth quarter 2023 financial results on February 13, 2024
- Revenue of $2,218 for the three months ended December 31, compared to $1,902 for the same period in 2022. An increase of almost 17%.
- Net loss of $349 for the three months ended December 31, compared to net earnings of $319 in the same period in 2022.
- Diluted loss per ordinary share of $0.55 for the three months ended December 31, compared to earnings of $0.48 per share for the same period in 2022.
- Revenue of $9,917 for the year ended December 31, compared to $8,399 for the same period in 2022. An increase of over 18%.
- Net earnings of $4,792 for the year ended December 31, compared to net earnings of $1,893 in the same period in 2022.
- Diluted earnings per ordinary share of $7.24 for the year ended December 31, compared to earnings of $2.79 per share for the same period in 2022.
Dream Industrial Real Estate Investment Trust
See report under Portfolio 1.
TC Energy Corp.
All currency listed in millions of Canadian dollars, except for per share data.
Selected highlights from their fourth quarter 2023 financial results on February 16, 2024
- Revenue of $4,236 for the three months ended December 31, compared to $4,041 for the same period in 2022. An increase of almost 5%.
- Net income of $1,615 for the three months ended December 31, compared to a net loss of $1,416 in the same period in 2022.
- Diluted earnings per ordinary share of $1.41 for the three months ended December 31, compared to a loss of $1.42 per share for the same period in 2022.
- Revenue of $15,934 for the year ended December 31, compared to $14,977 for the same period in 2021. An increase of over 6%.
- Net earnings of $3,068 for the year ended December 31, compared to net earnings of $785 in the same period in 2021.
- Diluted earnings per ordinary share of $2.75 for the year ended December 31, compared to earnings of $0.64 per share for the same period in 2021.
Portfolio 3
Portfolio 3 for the week ended February 16, 2024: DOWN ![]()
- Microsoft announced they plan to spend 3.2 billion euros in Germany over the next two years. The investment will go to build up its data centre infrastructure and artificial intelligence (AI) capabilities in Germany.
Activity
No significant activity to report this week.
Dividends
Dividends Received this week for the following companies:
Companies followed by DRIP (Dividend Re-Investment Plan) indicate additional shares were purchased with the dividend. Any cash leftover was added to the cash balance.
Canadian $
SmartCentres Real Estate Investment Trust (TSE: SRU.UN)
US $
No US$ dividends this past week.
Quarterly Reports
goeasy Ltd.
All currency listed in thousands of Canadian dollars, except for per share data.
Selected highlights from their fourth quarter 2023 financial results on February 13, 2024
- Revenue of $338,112 for the three months ended December 31, compared to $273,326 for the same period in 2022. An increase of almost 24%.
- Net income of $74,602 for the three months ended December 31, compared to net income of $28,576 in the same period in 2022.
- Diluted earnings per ordinary share of $4.34 for the three months ended December 31, compared to earnings of $1.71 per share for the same period in 2022.
- Revenue of $1,250,069 for the year ended December 31, compared to $1,019,336 for the same period in 2021. An increase of almost 23%.
- Net earnings of $247,898 for the year ended December 31, compared to net earnings of $140,161 in the same period in 2021.
- Diluted earnings per ordinary share of $14.48 for the year ended December 31, compared to earnings of $8.42 per share for the same period in 2021.
Shopify Inc.
All currency listed in millions of US dollars, except for per share data.
Selected highlights from their fourth quarter 2023 financial results on February 13, 2024
- Revenue of $2,144 for the three months ended December 31, compared to $1,735 for the same period in 2022. An increase of almost 24%.
- Net income of $657 for the three months ended December 31, compared to a net loss of $623 in the same period in 2022.
- Diluted earnings per ordinary share of $0.51 for the three months ended December 31, compared to a loss of $0.49 per share for the same period in 2022.
- Revenue of $7,060 for the year ended December 31, compared to $5,600 for the same period in 2021. An increase of over 26%.
- Net earnings of $132 for the year ended December 31, compared to net earnings of $3,460 in the same period in 2021.
- Diluted earnings per ordinary share of $0.10 for the year ended December 31, compared to a loss of $2.73 per share for the same period in 2021.